111(d) Options in Context: Assessing the Future of the SE Electricity System
|
|
|
- Laura Flynn
- 5 years ago
- Views:
Transcription

1 111(d) Options in Context: Assessing the Future of the SE Electricity System Dr. Marilyn A. Brown Brook Byers Professor of Sustainable Systems School of Public Policy Georgia Institute of Technology Shaping the Southeast s Energy Future: Regional Electricity trends and the EPA s Clean Power Plan Atlanta, GA September 26, 214 1
2 The South Benefits from Low Electricity Rates* 2 cents/kwh (213 dollars) Residential Electricity Consumption in the South, (billion kwh) Year South - Residential South - Commercial South - Industrial Rest of US - Residential Rest of US - Commercial Rest of US - Industrial The average annual growth rate of residential electricity consumption from is forecast to be.67% for the US,.99% for the South *Excludes Texas and Oklahoma 2
3 Energy Efficiency Opportunities are Large in Every Sector of the South 3 The Southeast accounts for: But only: 34% of national energy consumption 28% of the U.S. population 33% of national electricity consumption 25% of the U.S. GDP (Note: excludes TX and OK) Delivered Electricity Consumption in the South in 211 (1.42 Trillion kwh)* Industrial 29% Residenti al 41% Commerci al 3% Delivered Electricity Intensity (kwh/$gdp) South U.S. Industrial Commercial Residential *Excludes TX and OK. Sources of data for : GT-NEMS; EIA Annual Energy Outlook 213; Bureau of Economic Analysis.
4 Electricity in the South is Coal-Dominated, But Natural Gas is Expanding Rapidly 4 Fraction Generation Year South - Coal South - NG South - Nuclear Rest of US - Coal Rest of US - NG Rest of US - Nuclear Dollars per MMBtu (213 Dollars) Year Natural Gas Prices Source: EIA This national trend is more pronounced in the South due to its gas pipeline infrastructure and historic reliance on coal. The South contains the only new nuclear construction in the country: Plant Vogtle in Georgia, V.C. Summer in South Carolina, and Watts Bar in Tennessee. *Excludes Texas and Oklahoma
 5 4 3 2 1 4.3% 13.7% 1.")

5 Few Southern States have Renewable Mandates, but Several Have Expanding Renewables 5 Renewable Electricity Generation (Billion KWh) % 13.7% 1.1% Wind Solar Biomass Hydro 25 Renewable electricity generation in the South, in billion kwh (212-24) 1.2% SERC SPP TRE FRCC Variability across the South, in Solar is Forecast to Increase Significantly Post Sources: GT NEMS, 213; U.S. Energy Information Administration, 213

6 The South Lags in Energy Efficiency Policies, but is Improving 6 Southern states rank consistently low in ACEEE s State Energy Efficiency Scorecards. In 213, only North Carolina and Florida ranked in the top half. But several states have shown significant improvement in recent years. In particular, Mississippi was acknowledged for passing comprehensive energy legislation Source: ACEEE State Energy Efficinecy Scorecard Ranking, 213 6
7 What Will be the Cost of 111(d) Compliance? Method: Use GT-NEMS to estimate the carbon tax needed for each NERC region to meet its goal. That tax level represents the shadow price of the region s compliance cost. Source of state mass constraints used: IPM Outputs of the Regulatory Analysis of the Clean Power Plan. IPM modeling results are available from the Option 1-State file at: cleanpowerplan.html 1 Each NERC region s goal is a proportional sum of its states goals (the proportion of CO 2 emissions from the power sector in 212 is used for the weightings). We use GT-NEMS to model carbon taxes of $1, $15, $2 and $25 starting in 218 and applied only tothe electric power sector. NEMS = National Energy Modeling System used by EIA

8
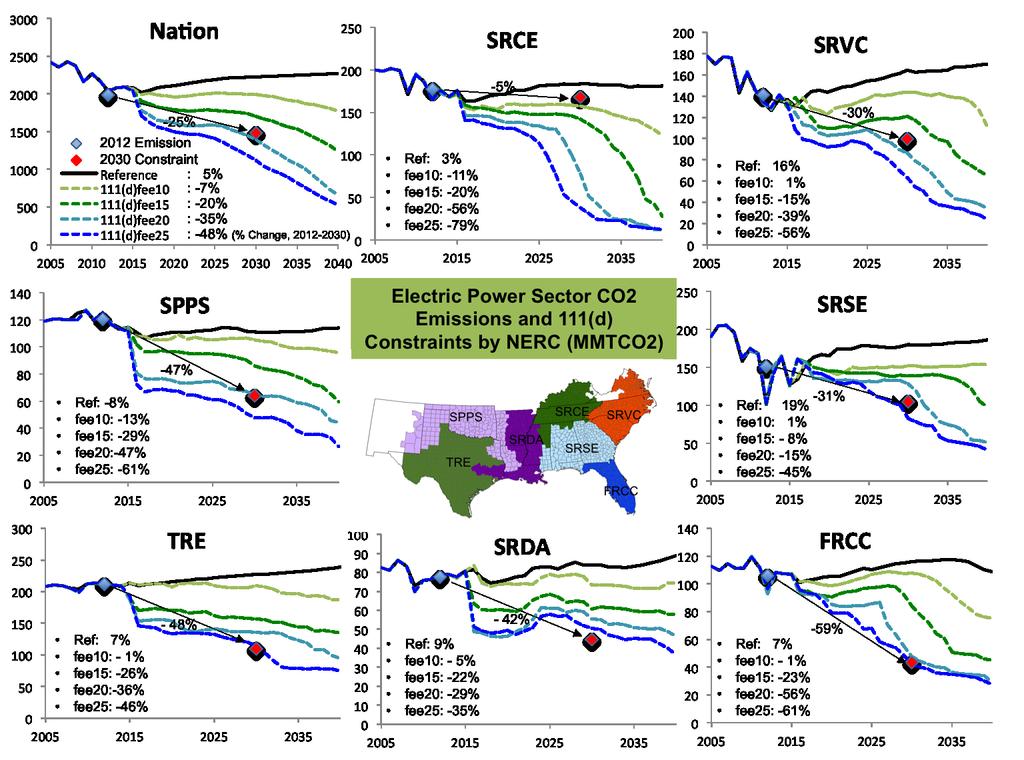
9 111(d) Compliance Costs in the South are Wide-Ranging Our initial analysis estimates compliance costs to be $2-25 per metric ton of carbon for the U.S. and most NERC regions in the South. Some regions appear to be outside of this range, underscoring the variability of carbon abatement opportunities. SRCE compliance costs appear to be lower SRDA compliance costs appear to be higher 12


10 What is the Least Cost Compliance Option for the South? Natural gas, renewable energy, nuclear power, and energy efficiency are major least cost compliance options A $25 tax would virtually eliminate coal power plants in the South 13 United States South Bill kwh % 61% 124% 1% 2% 26% 25% 28% 59% -14% -19% -42% 12% -3% -66% Renewables Nuclear Natural Gas Petroleum Coal 76% 19% 24% -55% 15% 122% 21% 23% -59% -1% 261% 77% 45% -91% -84% Reference 111(d)fee1 111(d)fee25 Reference 111(d)fee1 111(d)fee25

11 Least-Cost Options Across the South With a fee of $25/metric ton: FRCC: Nuclear displaces coal and NG. TRE & SPPS: Coal decreases, RE & NG grow. SRDA & SRSE: NG displaces coal and nuclear is steady. SRCE & SRVC: Nuclear displaces coal; NG & RE grow. FRCC Bill kwh Bill kwh Coal Natural Gas Renewables Petroleum Nuclear TRE Reference 111(d)fee1 111(d)fee25 SRDA Reference 111(d)fee1 111(d)fee25 SRCE Bill kwh Bill kwh SPPS Reference 111(d)fee1 111(d)fee25 SRSE Reference 111(d)fee1 111(d)fee25 SRVC Bill kwh Bill kwh Bill kwh Reference 111(d)fee1 111(d)fee25 Reference 111(d)fee1 111(d)fee25 Reference 111(d)fee1 111(d)fee25
12 Conclusions First, more work is needed to estimate compliance costs and to evaluate compliance options, for regions and for states 12 Variable compliance costs suggest that regional approaches might be less costly than state approaches Regions with similar portfolios of least-cost compliance options might offer productive regional collaborations

13 For More Information 13 Professor Marilyn A. Brown School of Public Policy Georgia Institute of Technology Atlanta, GA Climate and Energy Policy Lab: Research Assistants: Gyungwon Kim Alexander Smith
14 Extra Slides 14
15 Electric Power Sector 212 CO2 Emissions (MMTCO2) Electric Power Sector 23 CO2 Mass- based Constraint (MMTCO2) % 23 Constraint per 212 CO2 Emission in Electric Power Sector % ReducBon b/w 212 CO2 Emission and 23 Constraint Rate- based 23 Final Goals (lbs/mwh) % of Fossil Fuel 212 CO2 Emissions NaBon 1, , % 25.18% - TRE % 48.27% 791 Texas % 48.27% 791 1% FRCC % 58.93% 74 Florida % 58.93% 74 1% SRSE % 3.69% 97 Alabama % 26.23% 1,59 39% Georgia % 25.19% % Florida % 58.93% 74 7% Mississippi % 59.36% 692 6% SRVC % 29.53% 916 N. Carolina % 26.19% % S. Carolina % 42.1% % Virginia % 36.72% 81 16% SRCE % 5.43% 1,397 N. Carolina % 26.19% 992 2% Georgia % 25.19% 834 4% Alabama % 26.23% 1,59 8% Virginia % 36.72% 81 4% Mississippi % 59.36% 692 6% Tennessee % 11.5% 1,163 28% Kentucky % % 1,763 5% SRDA % 42.48% 91 Arkansas % 43.24% 91 41% Mississippi % 59.36% 692 4% Lousiana % 38.35% % Texas % 48.27% % Tennessee % 11.5% 1,163 9% SPPS % 46.8% 844 Oklahoma % 38.22% % New Mexico % 6.3% 1,48 2% Lousiana % 38.35% 883 9% Texas % 48.27% % Arkansas % 43.24% 91 2%
16 Fuel Composition Changes by NERC Region Details of % Changes NERC Fuels Reference 111(d)fee1 111(d)fee25 Coal 1% 2% -79% Petroleum 267% 258% -25% TRE Natural Gas 33% 28% 56% Nuclear 6% 6% 8% Renewables 8% 28% 14% Total 2% 16% 12% Coal -2% -12% -92% Petroleum -81% -83% -95% FRCC Natural Gas 17% 12% -38% Nuclear 41% 71% 537% Renewables 175% 296% 439% Total 17% 15% 7% Coal 8% -8% -82% Petroleum -9% -91% -98% Natural Gas 38% 36% 119% SERC/Delta Nuclear 11% 11% 15% Renewables 118% 216% 243% Total 22% 18% 37% Coal 49% 17% -78% Petroleum 473% 391% -18% SERC/ Natural Gas 4% 11% 68% Southeastern Nuclear 31% 31% 57% Renewables 25% 357% 242% Total 3% 26% 19% Coal 13% -7% -93% Petroleum -62% -67% -97% Natural Gas -12% 15% 66% SERC/Central Nuclear 2% 2% 161% Renewables 61% 96% 74% Total 13% 8% -4% Coal 25% 7% -8% Petroleum 17% 5% -63% SERC/VC Natural Gas 5% 46% 78% Nuclear 17% 17% 21% Renewables 269% 378% 876% Total 34% 29% 21% Coal -11% -16% -83% Petroleum -75% -75% -95% SPP/South Natural Gas 37% 32% 47% Nuclear Renewables 59% 83% 37% Total 15% 13% 15%