Groundwater Monitoring Plan. Table of Contents
|
|
|
- Avice Price
- 5 years ago
- Views:
Transcription


1
2 Table of Contents 1.0 Introduction Definitions and Acronyms Graving Dock Site Site Investigation Excavation Dewatering Deep Wells Cut-Off Walls Settling Pond Groundwater Monitoring Plan Groundwater Quality Monitoring Groundwater Flow Monitoring Plan Monitor Well Design & Procedures Reporting Appendix A - Graving Dock Reference Drawings...13 Table of Figures Figure 1 - Wellhead Platform... 3 Figure 3 - CGS in Graving Dock... 4 Figure 2 - Argentia Peninsula - Areas of Interest... 4 Figure 4 - Additional Groundwater Monitoring Piezometers...11 WH-K-98W-K-PG Rev. E1 Page 2 of 13
, is leading the development of the WREP.")
3 1.0 Introduction Husky Oil Operations Limited (Husky), on behalf of the White Rose Extension Project (WREP) proponents, Husky, Suncor Energy Inc. (Suncor) and Nalcor Energy Oil and Gas Inc. (Nalcor), is leading the development of the WREP. The WREP will involve a new Wellhead Platform (WHP) design that consists of a Concrete Gravity Structure (CGS) with topsides that consists of drilling facilities, well heads, requisite life-support services and safety systems. The WHP will be a bottom founded structure that is similar to other WHPs in use elsewhere in the world with the exception of being able to mitigate the risk posed by a combination of harsh weather, icebergs and pack ice. There will be no storage or processing of fluids onboard the WHP, therefore produced fluids will be transported via subsea flowlines tied back to the Sea Rose Floating Production Storage and Offload vessel (FPSO) for processing and off-loading to dedicated shuttle tankers. Figure 1 - Wellhead Platform The CGS portion of the WHP will be built in a Graving Dock in Argentia. The site consists of a 20 hectare lease area, access road, temporary haul road and The Pond. Refer to Figure 2 for an arrangement of the Areas of Interest. WH-K-98W-K-PG Rev. E1 Page 3 of 13


4 Figure 2 - Argentia Peninsula - Areas of Interest Figure 3 below shows a concept of the CGS in the Graving Dock. Figure 3 CGS in Graving Dock WH-K-98W-K-PG Rev. E1 Page 4 of 13
5 2.0 Definitions and Acronyms AMA CCME CD CGS EA EPP FPSO HSEQ Husky kh kv l/s Nalcor NL NLDEC-WRMD Suncor USN WHP WREP Argentia Management Authority Canadian Council of Ministers of the Environment Chart Datum Concrete Gravity Substructure Environment Assessment Environmental Protection Plan Floating Production Storage and Offload Health, Safety, Environment and Quality Husky Oil Operations Limited Horizontal Permeability Vertical Permeability Liters per Second Nalcor Energy Oil and Gas Inc. Newfoundland and Labrador Newfoundland and Labrador Department of Environment and Conservation Water Resources Management Division Suncor Energy Inc. United States Naval Wellhead Platform White Rose Extension Project WH-K-98W-K-PG Rev. E1 Page 5 of 13
6 3.0 Graving Dock Site 3.1 Site Investigation A geotechnical and hydrogeological investigation was carried out in the lease area during 2011, 2012 and The site investigation within the graving dock was comprised of nine geotechnical boreholes, seven observation wells and two pump tests. Arup Canada Inc. (Arup) scoped and interpreted the geotechnical investigation. Stantec Consulting Ltd. (Stantec) scoped, supervised and interpreted the pump tests. The fieldwork for the geotechnical boreholes and observation wells was supervised by Golder Associates Ltd. (Golder). The boreholes were drilled to 40m below ground level and penetrated between 11m to 17m below the -18m CD dock floor. A shallow pump test was located on the inland slope furthest from the sea and a deep pump test was located on the seabund slope. See Appendix A Drawing WH-K-98W-K-LY Graving Dock Geotechnical Borehole Location Plan for further information. The site investigation shows the stratigraphy to be very heterogeneous. No rock was encountered so overburden depths exceed 40m. The overburden is a heterogeneous mixing of glacially derived materials consisting of gravels, sands, silts, clays and various combinations of these constituents. Both high permeable gravel and sand lenses and low permeability silt and clay lenses exist. In-situ testing shows the ground to be generally very dense to hard. However the high particulate nature of the ground had an impact on the insitu testing leading to a very high number of refusals. PW1, the shallow pump test, indicated aquifer permeabilities to be of the order of 1*10-4 m/s while PW2 indicated aquifer permeabilities to be of the order of 2*10-4 m/s. Both wells yielded significantly higher flows than anticipated from the stratigraphy of the surrounding observation wells and boreholes. In order to assess groundwater inflow volumes into the excavated dock, flow analyses have been undertaken using numerical analysis for assessment of groundwater flow. This is particularly useful for problems with no closed form solution (i.e. anisotropic soils with cut-off walls). The outer/ inner ring of wells taken to -28mCD/ -32mCD will be partly penetrating the full aquifer. The aquifer depth was assumed to be to -50mCD in the analyses where an impermeable stratum has been modeled. The analyses are based on the following: A range of overall permeability between 1 and 2 x10⁻⁴ m/sec based on PW1 and PW2 results, respectively. The kh to kv relationship is unknown, hence sensitivity analyses were undertaken for kh=kv; kh = 10kv; kh=100kv. The base of the unconfined aquifer is unknown (assumed - 50mCD). It is assumed there is no upflow from tight bedrock. WH-K-98W-K-PG Rev. E1 Page 6 of 13
7 The inflow rate on a given cross-section depends on kh and the ratio of kh to kv, the presence and location of the cut-off wall on the cross-section and the distance to the recharge boundary (i.e. the sea). The total dock inflow was calculated to be in the range of 500l/s to 1000l/s for kh:kv = 10:1 and kh:kv=1:1, respectively. This is considered to represent the range of potential inflows. A further allowance of 250l/s vertical upflow has been assumed into the dock floor slope toe drains and drainage blanket. A total dock inflow between 750 and 1250 l/sec has thus been considered in design. A further allowance of 250l/s vertical upflow has been assumed into the dock floor slope toe drains and drainage blanket. A total dock inflow between 850 and 1250 l/sec has thus been considered in design. During 2011, 2012 and 2013, Husky conducted a soil sampling program within the area of the proposed Graving Dock site located on the former United States Naval Base in Argentia, Newfoundland and Labrador (NL). The scope of work involved the excavation of ten (10) test pits and drilling ten (10) boreholes to assess the environmental conditions at the site to determine any environmental impacts to soil. Note that only seven (7) boreholes provided sufficient amount of soil samples for reliable laboratory testing. The test results from the soil sampling program demonstrate compliance of the material with Canadian Council of Ministers of the Environment (CCME) guidelines. 3.2 Excavation The overall quantity of material to be excavated from the lease area during the construction of the Graving Dock is currently estimated at 1,366,000 m 3. Approximately 192,000 m 3 of this material will be used to raise the level of the Lease Area leaving a balance of 1,174,000 m 3 to be removed from the Graving Dock area. The finished base level of the Graving Dock during CGS construction shall be at -18m CD to allow a minimum 0.5m underkeel clearance at all states of tide so that there are minimal restrictions on the date of the float-out. A working space of at least 13m width shall be provided around the perimeter of the CGS. The current dimensions of the dock floor at m CD where the CGS will be constructed are approximately 148m x 172m. Refer to the Graving Dock Cross Sections drawing WH-K-98W-K-LY for further information. 4.0 Dewatering In order to lower and maintain the groundwater levels during excavation and construction of the CGS in the Graving Dock area, a dewatering design has been provided based on anticipated flows in the order of 850 and 1250 l/sec. The dewatering elements are deep wells, cut off walls and a settling pond. WH-K-98W-K-PG Rev. E1 Page 7 of 13
8 4.1 Deep Wells Eighty three (83) deep wells, comprising filter zones, well screens and submersible pumps shall be installed around the Graving Dock on benches at various levels to lower the water table inside the Graving Dock. An outer ring of deep wells will be installed at 20m centers from the -4m CD bench in the seabund and at +8.5mCD along the land slopes for the 1st stage of groundwater level reduction from +3mCD to -12mCD. An inner ring of deep pumped wells will be installed from the -11mCD bench at 20m centers (offset 10m from the upper ring) for the 2nd stage groundwater level reduction to - 19mCD below the dock floor. A groundwater monitoring system comprising of 21 standpipe piezometers will be installed to allow monitoring of ground water levels in the Graving Dock during excavation and the construction of the CGS. Monitoring of the dewatering pumps and the permanent works piezometers shall be maintained to ensure controlled dewatering conditions are adequate. A series of inclinometers in the seabund will be installed to provide information on potential ground movements and developing conditions. A standard piped trench drain at the toe of the slopes and a drainage blanket under the CGS will be installed to drain surface and ground water. These drains are connected to the pumped dock floor sumps. The dewatering system, deep wells, piezometers and inclinometers can be seen in Appendix A Drawing WH-K-98W-K-LY Graving Dock Dewatering Layout Sheet 1 of 2 and WH-K-98W-K-LY Graving Dock Dewatering Layout Sheet 2 of Cut-Off Walls An impermeable cut-off wall will be constructed to prevent the transmission of seawater to the Graving Dock along the seabund approximately 80m along the side land slopes. The seabund cut off wall is 800mm thick and extends to -28mCD from an elevation of +5mCD along the seabund side and +3mCD along the landside returns. A second impermeable cut-off wall will be constructed along the line of the proposed Graving Dock Gates. This will extend to -40mCD with a top elevation of -18mCD along the dock floor and the remainder following the slope of the Graving Dock side slopes before tying into the seabund Cut-Off Wall returns at a minimum elevation of +5mCD. Refer to Appendix A Drawing WH-K-98W-K-LY Graving Dock - Cut-Off Wall Layout and Monitoring Details for further information. WH-K-98W-K-PG Rev. E1 Page 8 of 13
9 4.3 Settling Pond A settling pond shall be constructed through which all water removed from the Graving Dock and site will pass before discharge to the sea. The settling pond is sized to allow residence time for suspended solids to settle so as to avoid sedimentation plumes in the sea from construction activities. The settling pond will be located outside of the cut off wall. It will consist of three parts; Area 1 the forebay will cater for initial settlement of the majority of the sediment remaining in the storm water runoff. The water in the forebay will then discharge to Area 2 via a weir structure where further settlement will occur. The third area will cater for dewatering water and the final surface water after settlement has occurred. The pond will be lined with a geotextile liner to prevent infiltration to the ground. The water from the third area will discharge over a weir, through a silt fence then to a soakaway channel before making its way to the sea. Refer to Appendix A Drawing WH-K-98W-K-LY Graving Dock - Settling Pond - Sections and Details for further information. 5.0 Groundwater Monitoring Plan Baseline Hydrogeological Characterization Concrete Gravity Structure Graving Dock Site Argentia, NL was completed by Stantec as part of the Addendum to the WREP EA (submitted to DOEC on April 23, 2013). This study was carried out to gain a better understanding of the hydrogeological conditions at the Graving Dock site, and in particular to provide information on potential impacts to groundwater quality and quantity in the site area related to the construction and operation of the Graving Dock facility. Based on the results of the study, the project report included a general framework for a groundwater flow and quality monitoring plan for the Graving Dock site. This general groundwater monitoring framework was subsequently modified based on discussions with the Newfoundland and Labrador Department of Environment and Conservation Water Resources Management Division in preparation of this document. The following sections outline the proposed groundwater monitoring plan for the Graving Dock site. This Plan has been prepared to satisfy the requirements of White Rose Extension Project Scoping Document (C-NLOPB, 2012), and will serve as guidance for monitoring of groundwater flow and quality during the construction and operation of the Graving Dock facility. 5.1 Groundwater Quality Monitoring Water generated from construction dewatering activities as well as surface water drainage inside the graving dock will be directed into a settling pond prior to discharge into the marine environment. Water samples will be collected at the overflow weir and compared to the NL Environmental Control Water and Sewage Regulations, 2003 Schedule A parameters. The sampling program will include the following requirements: - Once a day for first week of pumping prior to discharge or where additional source of water are added to the treatment system. - Twice a week (every three or four days) for next three weeks. WH-K-98W-K-PG Rev. E1 Page 9 of 13
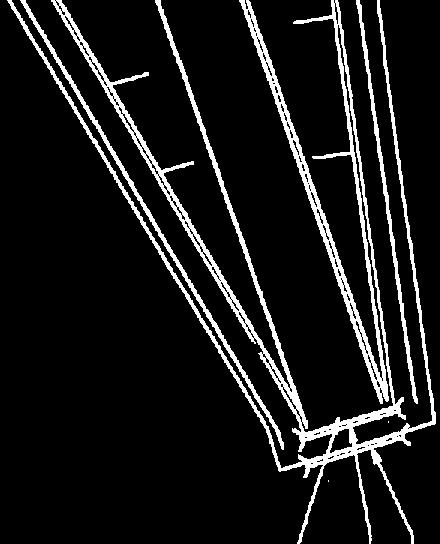
10 - Once a month thereafter. If exceedances are detected appropriate mitigation measures will be implemented. Also, the applicable regulatory bodies will be contacted. Effluent discharge from the settling pond will be visually inspected on a daily basis. If issues are identified a sample will be collected immediately. 5.2 Groundwater Flow Monitoring Plan Based on results of the Baseline Hydrogeological Characterization study (Stantec, 2013), the Graving Dock dewatering is anticipated to result in drawdown in the host aquifer that decreases with distance from the excavation. While preliminary estimates of drawdown extent exceed 2,000 m, the actual degree of drawdown will depend on the mitigative effects of the cut-off walls and actual dewatering flows. Monitoring of water levels in the aquifer adjacent to and at distance from the excavation will monitor actual groundwater level drawdown effects and changes to natural hydraulic gradients both within and in outlying areas of the Graving Dock site. The dewatering plan includes a series of monitor wells (piezometers) located in the excavation, seabund and land-side slopes to monitor groundwater levels and hydrostatic pressures at the Graving Dock site. In addition, two (2) additional monitoring wells (piezometers) will be installed inland at a distance of approximately 80 m from the west side of the Graving Dock to monitor any changes in regional groundwater flow patterns associated with construction and operation of the facility, and to verify that actual effects on the regional groundwater flow regime are consistent with that predicted as part of the Baseline Hydrogeological Characterization study. The locations of the monitoring wells (piezometers) for the dewatering system and the additional monitoring wells for regional groundwater flow effects are shown in Figure 4 below. WH-K-98W-K-PG Rev. E1 Page 10 of 13

11 Figure 4 - Additional Groundwater Monitoring Piezometers Monitor Well Design & Procedures The water levels will be measured using an electric water level tape in combination with insitu, automated water level dataloggers. The results of routine groundwater level monitoring will be added to a cumulative database, and ultimately used to generate long-term water level hydrographs for select monitor wells at key locations of the site, including for the two (2) outlying monitoring wells located inland from the Graving Dock. Groundwater level data collected from these two (2) monitor wells will be compared to groundwater levels and drawdowns predicted during construction and operation of the Graving Dock as part of the Baseline Hydrogeological Characterization Study. The water levels in the monitoring wells (piezometers) will be measured daily. Depending on results of groundwater level monitoring, additional evaluation of the groundwater monitoring plan will be undertaken. WH-K-98W-K-PG Rev. E1 Page 11 of 13
12 5.3 Reporting In order to maintain a consistent, accurate and useful monitoring program, all aspects of the sampling, analysis, and data management will be maintained and trended in a consistent manner so that groundwater levels and water quality will be comparable over long time periods. Groundwater monitoring reports will be prepared and submitted quarterly to the NL Department of Environment and Conservation during construction of the Graving Dock and CGS. A database management system will be established for the Graving Dock project. This will be populated with the existing baseline work, and added to with the new monitoring data over the course of the project. The database will include ground water levels and water chemistry. WH-K-98W-K-PG Rev. E1 Page 12 of 13
13 6.0 Appendix A - Graving Dock Reference Drawings WH-K-98W-K-PG Rev. E1 Page 13 of 13


14


15


16


17


18


19