Solid Waste Problem and Waste Characterization in Phnom Penh, Cambodia
|
|
|
- Jerome Hill
- 5 years ago
- Views:
Transcription
1 Solid Waste Problem and Waste Characterization in Phnom Penh, Cambodia *Takeshi Fujiwara 1), Yim Mongtoeun 2), and Sour Sethy 3) 1) Waste Management Research Center, Okayama University 2) Graduate School of Environmental and Life Science, Okayama University 3) Environmental Science, Royal University of Phnom Penh ABSTRACT In Cambodia, on the other hand of economic developing, urban cities, such as Phnom Penh and Siem Reap, have big issue of municipal solid waste. Still many districts in Phnom Penh do not have waste collection services. Household waste is often thrown away to rivers and ponds, or illegally left at the vacant space in public area. These actions cause pollution in water environment and litter of waste with bad smell and view. Such insufficient control of municipal solid waste (MSW) management might bring high risk of widespread infection. We conducted waste characterization analysis, household waste survey, and questionnaire survey during one month in As a result of waste characterization analysis, the combustible, noncombustible, and recyclable component ratio were 89.7%, 8.9% and 1.4%, respectively. As for physical components, the ratio of food was the largest (66.27%), followed by plastic (9.81%), others (8.15%), and paper (4.55%). Calorific value was 1569 kcal/kg, which is lower than that of Japanese but it is good enough for incineration. KEYWORDS Municipal solid waste, Cambodia, Solid waste management problem, Waste characterization INTRODUCTION Population of Cambodia is over 14.8 million (2008) in area 181,035 km 2, and population of the capital of Cambodia, Phnom Penh, is over 2.23 million (2011) in area 678 km 2. In urban area such as Phnom Penh and Siem Reap, solid waste is classified into domestic, industrial, or hospital waste and the three kinds of waste are collected by different way. Even in Phnom Penh, the waste is not collected in many districts, so household waste is often thrown away to rivers and ponds, or illegally left at the vacant space in public area. These actions cause pollution in water environment and litter of waste with bad smell and view. Such insufficient control of municipal solid waste (MSW) management might bring high risk of widespread infection.
2 JICA conducted research on solid waste in Phnom Penh and reported in However, survey data on characteristics of household waste have not been reported after that, and information of citizen s awareness to the solid waste management is not found at all. Collecting basic information in terms of solid waste quantity and composition is necessary to understand the current situation of solid waste management in Phnom Penh; also it is important to know citizen s consciousness to 3R when considering reduction of landfill waste. Therefore, Takeshi Fujiwara and Yim Mongtoeun, a professor and a doctor course student of Okayama University, visited Sour Sethy, lecturer of Royal University of Phnom Penh, and we conducted three kinds of surveys in Phnom Penh: 1) waste characterization analysis, 2) household waste survey, and 3) questionnaire survey on awareness of solid waste management, during September It is expected that these results will be utilized for considering appropriate solid waste management based on 3R concept. In this paper, the result of waste characterization analysis is focused on. Detail method and results is described in a research paper submitted to SWAPI meeting. (Mongtoeun et. al 2012) MATERIALS AND METHODS 1. Waste characterization analysis Surveys were conducted in Phnom Penh. After sampling about 317.1kg of waste bags from storage sites in a day, open the bag and sort the waste by physical component, finally measure the weight of each component to identify the waste composition. 2. Household waste survey The sorted household waste classified by physical component category is provided from 26 sampled households every day for 2 weeks is collected and measured in weight. Small samples of each component were extracted, and dried at 105 ± 5 o C until the weight of sample becomes unchanged. Analyze 3 major compositions: moisture, combustible, and ash (incombustible or inert). Moreover, calorific heat of combustible physical components such as food, paper, and plastic, and (C, H, N) elemental components was also analyzed to evaluate the treatment options. RESULTS AND DISCUSSION 1. Report on visiting waste source and disposal site 1) Landfill in rice paddy area In Cambodia, household discharges waste after selling valuable things to the waste buyers. A waste cleansing company that contracts with local government collects the waste without any separation and transports to dispose at final landfill site. Landfill is usually owned by the private company, but managed and controlled by Phnom Penh Municipality (PPM) or Provincial Authority (PA). We tried to ask permission from PPM to visit landfill, unfortunately they rejected. So visiting landfills in Siem Reap province is reported in this paper.
3 We visited the provincial environmental bureau of Siem Reap and were guided to the landfill sites near Tonle Sap River by an officer. The landfills were located in the middle of rice paddy field. We watched a landfill hole that was almost filled out with waste but not covered yet (Figure- 1). Another is a new landfill hole but much water caused by rain or flown from outside was stored. It was heard from the officer that the owner of the land has dug the holes to use the soil for construction, after that, the land with hole was sold to the waste cleansing company. Five tons truck dumped waste to another landfill in service, and some scavengers picked up something and put it in a plastic bag. (Picture-2) Some scavenger s houses were found around the landfill. Since the landfill area has been suffered from flooding every year, some waste in the landfills is flown away, actually it was heard that farmers or residents living nearby sometimes complain about this issue. Picture-1 High risky landfill: waste is dumped into a hole in rice paddy that has been dug for getting soil for construction. Picture-2 Scavengers live near landfill located in rice paddy. 2) Waste source on the wet land In Siem Reap district, wet land spreads in the surrounding area of Tonle Sap lake and Siem Reap river, which is famous agricultural area having nutrient-rich soil. In dry season, the area of the lake is narrow (2700 km 2 ) and water level is low (only 1m), however, in wet season, the area
.")
4 becomes almost 6 times (16,000 km 2 ) and water level elevates by maximum 9m. To avoid suffering from river flooding every year, housing in the wetland stands on long pillars to be supported at high position from the ground level (Picture-3). Clusters of rubbish remaining on the ground were found in many places. These wastes might be disposed to the lake by residents, tourists, some commercial sectors, and be diffused by flooding and washed ashore. Critical reason causing water pollution of rivers and ponds is a problem of insufficient waste collection and people s weak consciousness to keep clean in public area as well. Picture-3 Houses on wet land which stands on long pillars 2. Quantity of Waste Generation Result of household survey indicates that about 1.95kg/household/day was generated with the average family size of 5.69 people. This result is quite similar to JICA research (2005) which is 5.9, and roughly 0.34kg/capita/day (Fig. 1). JICA (2005) also identified that household waste generation in 2003 is kg/capita/day in rainy season which is a bit higher compared to current study. However, the generation fraction ratio in dry season, kg/capita/day, is higher than rainy season (JICA, 2005). Research conducted by Yatim (2010) in Selangor, Malaysia, shown that 1.70 kg/household/day, and 0.34 kg/person/day is quite the same as current study in Phnom Penh, Cambodia kg/day Kg/HH/day Kg/capita/day By Experiment By Questionnaire Waste Generation Figure 1: Waste generation per household and per capita
5 3. Waste Physical Composition Three major compositions of the household waste in Phnom Penh city are shown in Table.1 and Fig. 2. The combustible is the largest composition (89.7%), followed by non-combustible (8.9%), however recyclable is small (1.4%). This result is similar to Nablus district, Palestine, with 85% of recyclable and compostable materials and 65% of putrescible (Al-Khatib et al., 2010). In Can Tho city of Southern Vietnam is 80.20% of compostable and 11.73% of recyclables (Thanh et al., 2010). Recyclable materials in Phnom Penh are quite low due to a very active in sorting valuable thing at home. Table 1: Three contents- Ash, Moisture and Combustible by total waste Combustible (%) C/N ratio* Ash (%) Moisture content (%) Household Solid Waste (total) : *Referred to putrescible materials only %, Non- Combusti ble, 8.9 %, Recyclabl e, 1.4 %, Combusti ble, 89.7 Figure 2: Waste Composition by percentage 3. Calorific Value and Chemical Component Fig. 3 and Table 2 show the high ratio of biodegradable and intermediate C/N ration 20:1 which is a good choice to treat with composting, exothermic processes. Table 2 shows the waste composition by categories which is the separation at source should be encouraged based on beneficiaries such as income, volume reduction (lifespan of landfill), and environmental degradation. Composting is a key option because the organic material accounting for up to more than 60% of the total waste. On the one hand, it is a good way to make soil more fertile through soil amendment. Furthermore, approximately 80% of the total population is farmers. Chemical usage reduction means conserve environment, pollution prevention, and less expense. Incineration is another option to treat waste in Phnom Penh in term of combustible fraction which accounts for up to 94.5% (JICA, 2005) and in current study has shown that around 90% (Fig. 2). Fig. 3 shows detailed composition in the combustible waste, so that, the food has the highest fraction (66.27%), followed by plastics (9.81%), others (8.15%), and paper (4.55%). Calorific value which is measured with a bomb calorie meter is 1569 kcal/kg. This calorific value is lower than that of Japanese, but is enough combustible.
6 Combustible Waste by Category (%) Food Plastic Others Paper Textile Wood and Grass Rubber Garden Figure 3: Combustible Waste by percentage Table 2: Chemical content, moisture content, ash and combustible by Waste Category Waste Chemical Content Moisture Ash Combustible Categories C% H% N% S & O % (%) (%) (%) Combustible Food Garden Paper PET bottle Plastic Textiles Wood Others Noncombustible Aluminum Metal Glass CONCLUSIONS AND PERSPECTIVES We visited Cambodia and watched several problems in waste collection and disposal. In spite of enlargement of the urban city, waste collection capacity is less than the required. The center of Phnom Penh where tourists visit impresses us cleanliness in town. On the other hand, the outskirt is dirty because of less waste collection, as a result, throwing away to river/pond or dumping in public space increase. Therefore, uncollected waste problem and polluted water problem cannot be separated. Flooding strengthens up the relationship waste and water problems. Especially, protection of landfill from flooding is important issue of landfill management. In Cambodia, there has lack of essential data of municipal solid waste for understanding current situation of solid waste generation. In this study, waste generation from household, physical component, calorific value and chemical component were figured out. These results will also contribute to planning of appropriate treatment technologies and management policies. This issue is discussed in another our paper (Mongtoeun et. al. 2012)
7 REFERENCES Al-Khatib, I.A., (2010). Solid Waste characterization, quantification and management practices in developing countries. A case study: Nablus district-palestine. Environmental Management, Vol 91, pp Bolaane. B and Ali. M, (2004). Sampling household waste at source: lessons learnt in Gaborone. Waste Management and Research, Vol 22, pp JICA, (2005). The study on solid waste management in the municipality of Phnom Penh in the Kingdom of Cambodia. Kokusai Kogyo Co., Ltd. Mongtoeun Y, T. Fujiwara, S. Sethy, (2013) A Study on Household Waste Characteristics in Phnom Penh City, CAMBODIA, SWAPI meeting, in press. Thanh. N. P., (2010). Household solid waste generation and characteristic in a Mekong Delta city, Vietnam. Environmental Management.
8 Solid Waste Problem and Waste Characterization in Phnom Penh, Cambodia Takeshi Fujiwara 1), Yim Mongtoeun 2), and Sour Sethy 3) 1) Waste Management Research Center, Okayama University 2) Graduate School of Environmental and Life Science, Okayama University 3) Environmental Science, Royal University of Phnom Penh


9 Introduction of Cambodia Population of Cambodia is over 14.8 million (2008) in area 181,035 km 2 Population of Phnom Penh, is over 2.23 million (2011) in area 678 km 2 Siem Reap: famous for Angkor Wat., Population 171,800(2009)

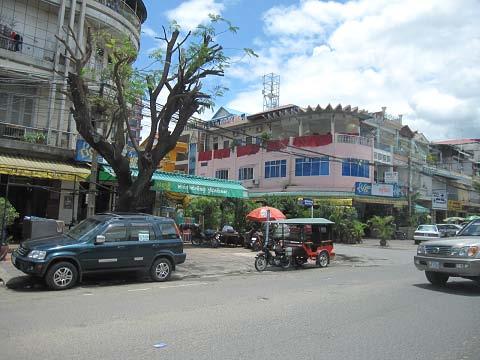

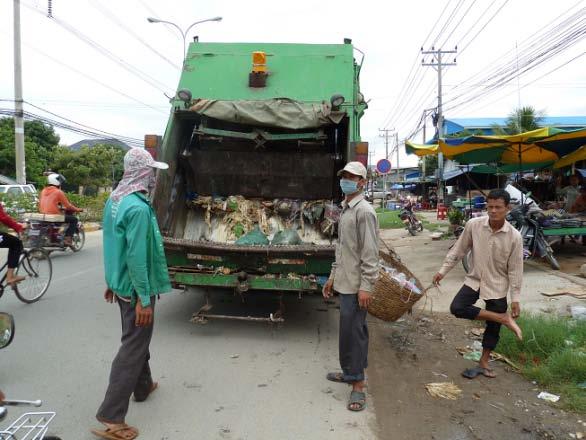
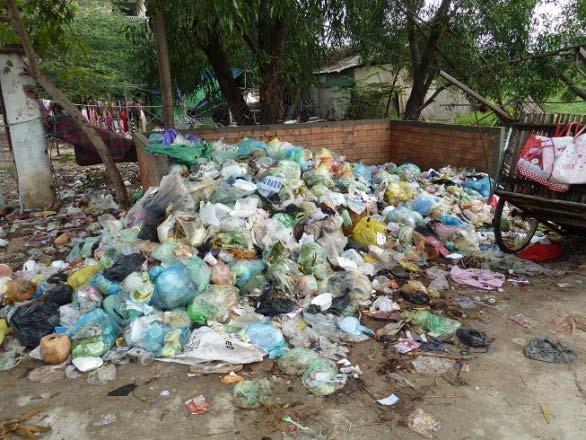
10 In Phnom Penh City In sightseeing places, it looks clean along main streets, but is not in housing area. Waste overflows a collection station


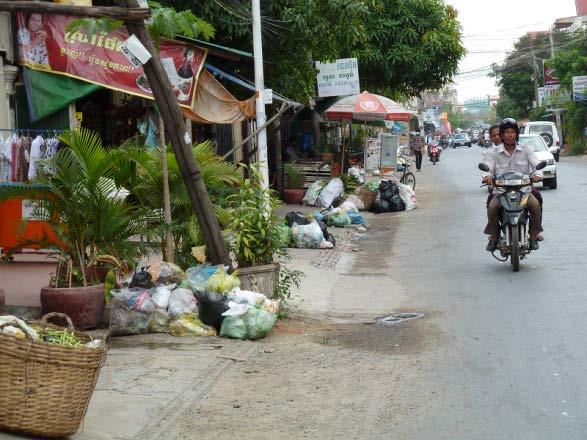
11 In Outskirts of Phnom Penh Waste is often damped in vacant ground illegally due to no collection service. Smoke from burned waste can be seen.

12 Landfill in rice paddy (SR) High risky landfill: waste is dumped into a hole in rice paddy that has been dug for getting soil for construction.


13 Scavengers live near landfill located in rice paddy. They are selling collected materials in the plastic bags.


14 Houses on wet land which stands on long pillars. Many people are living on boat houses
 is")


15 Recycling Activity by CSARO CSARO (Community Sanitation and Recycling Organization) is NGO Manufacturing sewn products from recycled materials Waste is collected from community, separation into organic, recycling and landfill. Composting form organic waste (market).


16 Recycling Activity by CSARO Sewed product is manufactured, such as cap, bag, and accessory, and are sold. Educational programs for recycling


17 Questionnaire Survey Questionnaire distribution and hearing was conducted. Over 500 responses were collected.

18 Waste Characterization Analysis Sample about 317.1kg of waste bags from storage sites in a day, in Phnom Penh Open the bag and sort the waste by physical component Finally measure the weight of each component to identify the waste composition.
19 Household waste survey The sorted household waste classified by physical component category is provided from 26 sampled households every day for 2 weeks is collected and measured in weight. Small samples of each component were extracted, and dried at 105 ± 5 o C until the weight of sample becomes unchanged. Analyze 3 major compositions: moisture, combustible, and ash (incombustible or inert). Calorific heat of combustible physical components such as food, paper, and plastic, (C, H, N) elemental components was also analyzed to evaluate the treatment options.
20 Result of Waste Generation Result is 1.95kg/hd/day or 0.342kg/cap/day (5.69 people/family). Similar to 0.34kg/cap/day by JICA (2005) Our result is a little bit lower than kg/cap/day in rainy season (2003) by JICA. Similar to 1.70 kg/hd/day and 0.34 kg/cap/day in Selangor, Malaysia by Yatim (2010)
21 Result of Major Composition Combustible (%) C/N ratio* Ash (%) Moisture content (%) Household Solid Waste (total) : *Referred to putrescible materials only In Japan case, average ratios of moisture content, combustion, and ash are 46-60%, 40-55%, and 5-15%, respectively.
22 Three major components The combustible is the largest composition (89.7%), followed by non-combustible (8.9%), however recyclable is small (1.4%). Similar to Nablus district, Palestine, with 85%, of recyclable and compostable materials (2010). In Can Tho city of Southern Vietnam is 80.2% of compostable and 11.7% of recyclables (2010). Recyclable materials in Phnom Penh are quite low due to a very active in sorting valuable thing at home. %, Non- Combusti ble, 8.9 %, Combusti ble, 89.7 %, Recyclabl e, 1.4
23 Physical Waste Composition Food has the highest fraction (66.3%), followed by plastics (9.81%), others (8.15%), and paper (4.55%). Combustible Waste by Category (%) Food Plastic Others Paper Textile Wood and Grass Rubber Garden
24 Chemical Content, Moisture, ash and Combustible High C: PETbottle, plastic, textile, wood, food High H: plastic High N: food, garden, others Waste Chemical Content Moisture Ash Combustible Categories C% H% N% S & O % (%) (%) (%) Combustible Food Garden Paper PET bottle Plastic Textiles Wood Others Non-combustible Aluminum Metal Glass
25 Conclusion Waste collection capacity is less than the required. The center of Phnom Penh where tourists visit impresses us cleanliness in town, however, the outskirt is dirty because throwing away to river/pond or dumping in public space increase. Flooding strengthens up the relationship waste and water problems. Lack of essential data of municipal solid waste for understanding current situation of solid waste generation. In this study, waste generation from household, physical component, calorific value and chemical component were figured out.