Coupling soil and canopy processes to. moisture uptake and hydraulic
|
|
|
- Bridget George
- 5 years ago
- Views:
Transcription


1 2008 CPPA PIs Meeting Climate Prediction Program for the Americas Coupling soil and canopy processes to nutrient dynamics: impacts of root moisture uptake and hydraulic redistribution Praveen Kumar Darren Drewry Department of Civil and Environmental Engineering University of Illinois Urbana, Illinois

2 30 years ago Long et al., Science, 2006 Present day 2 Woody Thickening, Australia
3 3
4 Understanding Biophysical Coevolution: Model For Couple Water, Carbon, Energy and Nutrient Dynamics Canopy-Atmosphere Exchange of CO 2, latent and sensible heat NEE LE H Canopy-Top Forcing: SW down Ta VPD Ca U PPT Soil Carbon and Nitrogen Transformations, Uptake and Transport Soil moisture transport, uptake, and passive redistribution Mineral N Uptake Litter Deposition SOM Pools Immobilization Mineral N Mineralization Leaching 4


5 Canopy Flux Model dz c 5
6 Canopy & Root System Structure Normalized Leaf Area Density Beta Function [Massman, 1982] [Stenberg et al, 1994] Logistic Function QuickTime and a TIFF (Uncompressed) decompressor are needed to see this picture. Root Density [Schenk and Jackson, 2002] 6

 by turbulent")
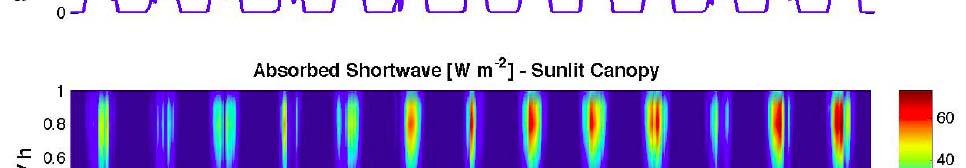
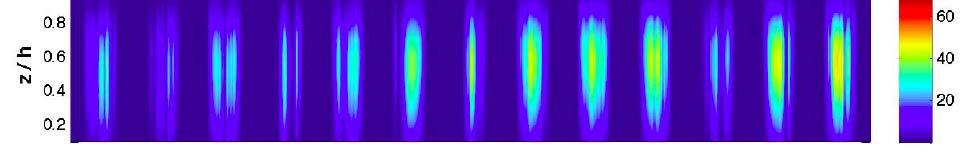
7 Canopy Scaling We have examined processes occuring on a single leaf Now we can compose a complete canopy as multiple layers of leaves : --> Radiation attenuation, Turbulent Mixing, Wind Speed Profile PAR NIR LW Mixing of canopy microclimate states (C a, T a, e a ) by turbulent eddies U 7
: SW dn, LW dn, C a, T a, e a, U, U* And, the model")
dz c c LE H h 0 0 h S v (z)dz S h")
8 Canopy Scaling Canopy-top measurements provide model forcing data (upper BCs): SW dn, LW dn, C a, T a, e a, U, U* And, the model validation data: F c, LE, H --> Eddy covariance: vertical integral of sources/sinks h 0 h F c S c (z)dz c c LE H h 0 0 h S v (z)dz S h (z)dz 8


9 Effects of Enriched Ambient CO 2 Bondville Ameriflux Tower SoyFACE site 9


10 PAR NIR LW U 10


11 PAR NIR LW U 11


12 12
13 13
14 14
15 15
16 Modeling Framework: Coupled Photosynthesis - Stomatal Conductance - Leaf Energy Balance Leaf Energy Balance + BLC g bh Leaf Energy Balance g bv Boundary Layer Conductance (free / forced convection) Required Inputs Q: PAR NIR LW T l T l C i g s g bv Outputs C i g s T l T a a Rh a C a U Biochemical Photosynthesis th (Farquhar et al) Stomatal Conductance (Ball/Berry/Collatz) A n H LE A n Leaf Ecophysiology 16
17 CO 2 - Control: average of all noon values for each simulation day Leaf Energy Balance + BLC Leaf Energy Balance g bh g (+0 [molm m -2 s -1 ]) bv Boundary Layer Conductance (free / forced convection) Required T l (+0.25 [C]) g Inputs bv (+0 [mol m -2 s -1 ]) Q: Outputs PAR C i ( NIR (-0.05 [ppm]) T C g LW l (+0.25 [C]) s i ( [ppm]) [mol m -2 s -1 ]) g s (-0.05 [mol m -2 s -1 ]) T a Biochemical Stomatal T Rh l (+0.25 [C]) a Photosynthesis th C +190 Conductance a [ppm] U (Farquhar et al) A (Ball/Berry/Collatz) n (-3.34 [µmol m -2 s -1 ]) H (+56.3 A n (-3.34 [W m -2 ] [µmol m -2 s -1 ]) LE (-56.3 Leaf Ecophysiology [W m -2 ] 17

18 Extending Control Volume to Include ABL Dynamics Tropospheric Properties: Jump Discontinuities and Lapse Rates h ABL Warm, Dry Air C a, T a, e a, SW dn, LW dn H LE NEE 18
19 Drier, warmer BL H elev LE elev NEE elev H amb LE amb NEE amb 19
20 Hydraulic Redistribution Canopy-Top Forcing: SW down Ta VPD Ca U Canopy-Atmosphere Exchange of CO 2, latent and sensible heat: NEE LE H Soil moisture transport, uptake and passive redistribution Mineral N Uptake Litter Deposition SOM Pools Immobilization Mineral N Mineralization Leaching 20

21 lina Virginia ia Washing ngton Plant roots are much deeper than traditionally thought in our modeling approaches. In particular, this is true for water-limited environments Tropical Evergreen Forest Tropical Deciduous Forest Tropical Grassland/Savana Desert Shrubs Tempera rate Grassland Tempera rate Deciduous Forest Tempera rate Coniferous Forest Cropland Boreal Forest F Tundra Arizona Californi nia Colorado Florida Iowa Missouri Nebraska New Mexico New York Oregon S. Caroli Texas Max. Root Depth (m) Approximate Maximum Rooting Depth for Current Climate Models Maximum Root Depth Average Root depth Observed Max. Rooting Depths for USA 53 m 61 m Based on the study by Canadell et al. (1996) & Kleidon and Heimann (1998) 21 Root Depth (m)
22 Hydraulic Redistribution is the passive transport of soil water via plant roots from wet soil layers to dry soil layers. 22 Movement of water via the plant roots from the more moist soil layers to drier soil layers during dry and wet seasons.


23 Hydraulic Redistribution by plant roots can be modeled by coupling water flow within the soil media and the root media, where flow in both media is governed by water potential gradient and hydraulic conductivity of the system. Flow in the root xylem Flow in the soil pores Hydraulic Rditibti Redistribution Flow into the root from the soil Soil Root 23
24 Δz i-1 θ i-1, ψ i-1 J i-1 Flow in soil media is modeled as : Δz i q i-1 θ i, ψ i K s,i-1 J i t q z soil J Δz i+1 q i θ i+1, ψ i+1 K s,i J i+1 t z K soil z soil 1 Krad, root( soil xylem) Water flow in root media can be modeled d as a pipe flow: q root J z Δz i-1 Δz i ψ i-1 J i-1 K rad,i-1 K ax,i-1 q i-1 ψ i J i K rad,i z K z 1 xylem axial, root 1 Krad, root ( soil xylem ) K ax,i q i Δz i+1 ψ i+1 J i+1 K rad,i+1 24
 180")


 Jun Jul Aug Sep")
25 CASE STUDY SITE: Fresno Boundary of study site Precipitation (mm m) Jan Feb Mar Apr May The major PFTs at the site include C3 grasses (52%), needle leaf evergreen temperate trees (46%), and broadleaf deciduous temperate trees (2%) Jun Jul Aug Sep Oct Nov Dec 25
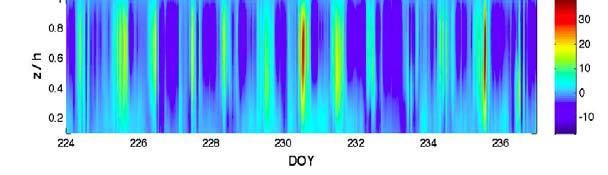
26 Without HR With HR L1 Mid- Night Mid-Day Mean L1 Mid- Night Mid- Day Mean L2 L2 L3 L3 L4 L4 Soil Layer In ndex L5 L6 L7 L8 Soil Layer In ndex L5 L6 L7 L8 L9 L9 L10 L10 L11 L11 L12 L Uptake (mm/day) Uptake (mm/day) 26
27 y Without HR ( y) With HR L1 L2 Wet Season [Jan] Dry Season [Jul] Mean L1 L2 Wet Season [Jan] Dry Season [Jul] Mean L3 L3 L4 L4 dex Soil Layer In L5 L6 L7 L8 So oil Layer Ind dex L5 L6 L7 L8 L9 L9 L10 L10 L11 L11 L12 L Uptake (mm/day) Uptake (mm/day) 27
28
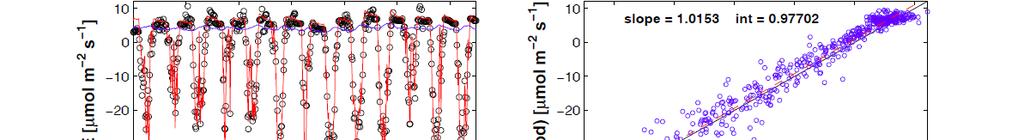
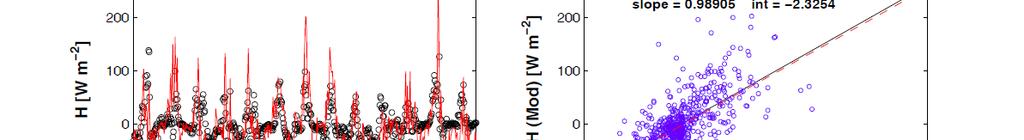
29 Comparison of simulated and observed latent heat flux for the Sierra Nevada study site for the different simulation cases. 29
30 Vegetation C and N Cycling Examine effects of hydraulic redistribution (HR) on: vertical patterns of C and N NO 3- leaching Mineral N uptake Canopy litter deposition Root Distribution H 2 O Mineral N (NH 4+ and NO 3- ) production N Upake Root litter deposition
31 Nutrient Dynamics Canopy-Top Forcing: SW down Ta VPD Ca U Canopy-Atmosphere Exchange of CO 2, latent and sensible heat: NEE LE H Soil moisture transport and passive redistribution Mineral N Uptake Litter Deposition SOM Pools Immobilization Mineral N Mineralization Leaching 31
 decompressor are needed to see this picture.")
32 Subsurface Carbon & Nitrogen Cycling H 2 O N NH + 4 NO - 3 QuickTime and a TIFF (Uncompressed) decompressor are needed to see this picture.
33 Subsurface Carbon & Nitrogen Cycling H 2 O N Organic matter decomposition and mineral N uptake are functions of, T s Soil Moisture No HR HR NH + 4 NO - 3 Soil Moisture Limitation for Decomposition No HR HR
34 HR vs NO HR : N Uptake and Leaching


35 HR vs NO HR : N Uptake and Leaching
36 Summary Multilayer vegetation-soil-nutrient nutrient model incorporating deep rooting and hydraulic redistribution. Model designed to capture transient behavior in energy, water and nutrient dynamics arising from alteration in biophysical response due to elevation in CO2 and temperature 36