****************** Biomass Combustion Evaluation Final Report
|
|
|
- Lora Waters
- 5 years ago
- Views:
Transcription
1 The following Biomass Combustion Evaluation Report was requested by a major US power company to evaluate the potential of using Bio-Coal produced by Vega Biofuels to replace traditional coal in their coal-fired power plant. Due to contractual obligations at this time, we have removed the name of the power company. As you will see in the report, our Bio-Coal performed the same or better than traditional coal. Western Research Institute is a highly respected multi-million dollar, not-for-profit, research organization renowned for work in advanced energy systems and technologies.
2 3474 N. 3 rd St., Laramie, WY Phone: (307) Fax: (307) ****************** Biomass Combustion Evaluation Final Report ****** *** Provided to: ****************** ****** *** ****** *** Provided by: Western Research Institute Energy Production and Generation Jerrod D. Isaak, Lead Engineer Nico Wibisono, Senior Engineer FINAL REPORT
3 Table of Contents List of Figures... iii List of Tables... iii Professional Biographies... iv Executive Summary... 5 Introduction... 7 Combustion Test Facility... 7 Testing Methods Biomass Combustion Evaluation Test Protocol Results Solid Fuel Analysis Data Summary Thermal Evaluation Observed Combustion Stability; O 2 and CO Profiles Particle Burn Out Analysis Ash Formation and Characterization Combustion Imaging Post Run Imaging Conclusion Attachment I. Test Day Log Book Summaries Attachment II. Fuel Analytical Results Attachment III. Recorded Flue Gas Characterization Profiles ii
4 List of Figures FIGURE 1. SCHEMATIC OF THE COMBUSTION TEST FACILITY... 8 FIGURE 2. A PHOTOGRAPH OF WRI CTF... 8 FIGURE 3. CROSS SECTION OF THE FURNACE AT THE BURNERS LEVEL... 9 FIGURE 4. PROCESS FLOW DIAGRAM OF THE CTF... 9 FIGURE 5. FLY ASH SAMPLING SET UP FIGURE 6. TYPICAL TIME/TEMPERATURE PROFILE DURING A RUN AT THE CTF FIGURE 7. AVERAGE FLAME ZONE TEMPERATURE AND STABILITY FIGURE 8. AVERAGE PLANT TEMPERATURE PROFILE COMPARISON FIGURE 9. BASELINE COAL, O2 AND CO PROFILE FIGURE 10. BIOMASS 300 C, O2 AND CO PROFILE FIGURE 11. BIOMASS 300 C DUPLICATE TEST, O2 AND CO PROFILE FIGURE 12. BIOMASS 450 C, O2 AND CO PROFILE FIGURE 13. FLAME ZONE IMAGE COMPARISON FIGURE 14. POST RUN FURNACE WALL CONDITION FIGURE 15. POST RUN FURNACE BOTTOM CONE CONDITION FIGURE 16. POST RUN BURNER NOZZLE CONDITION FIGURE 17. POST RUN SUPER HEATER TUBE CONDITION FIGURE 18. POST RUN UPPER FURNACE BULL NOSE REGION FIGURE 19. POST RUN RE HEATER TUBES FIGURE 20. POST RUN ECONOMIZER TUBE CONDITION FIGURE 21. POST RUN AIR PRE HEATER CONDITION FIGURE 22. POST RUN 300C BIOMASS ESP FIELD 1 CONDITION FIGURE 23. POST RUN 300C BIOMASS DUPLICATE ESP FIELD 1 CONDITION FIGURE 24. POST RUN 450C BIOMASS ESP FIELD 1 CONDITION FIGURE 25. POST RUN BAGHOUSE BAG CONDITION List of Tables TABLE 1. FUEL ANALYSIS... 5 TABLE 2. LIST OF ANALYZERS USED FOR FLUE GAS MEASUREMENTS TABLE 3. TYPICAL COAL ANALYSIS REPORT TABLE 4. TYPICAL FLY ASH ANALYSIS REPORT TABLE 5. PROXIMATE, ULTIMATE, BTU ANALYSIS TABLE 6. BIOMASS TESTING MEASURED DATA SUMMARY TABLE 7. AVERAGE PLANT TEMPERATURE PROFILE COMPARISON TABLE 8. CARBON CONVERSION ANALYSIS TABLE 9. AVERAGE ASH LOADING RATE (CALC.) TABLE 10. FUEL ASH CHEMISTRY TABLE 11. ASH COLLECTION AND LOCATIONS TABLE 12. BASELINE COAL FUEL ANALYSIS PRB COAL SPRING CREEK MINE TABLE 13. BASELINE COAL ASH ANALYSIS PRB COAL SPRING CREEK MINE TABLE 14. BIOMASS 300 C FUEL ANALYSIS TABLE 15. BIOMASS 300 C ASH ANALYSIS iii
5 TABLE 16. BIOMASS 450 C FUEL ANALYSIS TABLE 17. BIOMASS 450 C ASH ANALYSIS Professional Biographies Jerrod D. Isaak is a Lead Engineer for Western Research Institute (WRI) in Laramie, WY. He holds a Bachelor of Science degree in Mechanical Engineering from the University of Wyoming. Mr. Isaak has worked in the energy industry as a Mechanical Engineer for 10 years. His research and work responsibilities include management and operation of the Combustion Test Facility and Biomass/Coal Processing pilot facilities. Mr. Isaak also provides engineering support in the form of pilot plant design and operation for various other energy and fuel based processes currently housed at WRI. Nico Wibisono is a Senior Engineer at Western Research Institute (WRI) in Laramie, WY. He holds a Master of Science degree in Chemical Engineering from the University of Wyoming. His research topics at the University of Wyoming included simulation coding in Fortran, micro DSC operations on ionic liquids and microfluidic gas/liquid reactor experiments. Mr. Wibisono s role at WRI is to collect, analyze, and summarize data from various plant operations. He aides in proposal preparation and equipment design on various energy based research projects. Additionally, he works with various CEMS (Continuous Emission Monitoring Systems), including FTIR, method 30B sorbent trap system, and mercury vapor AAS. iv
6 Executive Summary ****************** (*********) is in the process of evaluating potential biomass feedstocks for use as a replacement fuel in their ******** Power Station which has traditionally fired a Powder River Basin (PRB) coal. In an effort to further develop their program of biomass fuel evaluations, ********* has partnered with Western Research Institute (WRI) to perform combustion studies of a torrified biomass product selected by *********. WRI s Combustion Test Facility (CTF), a 75kW thermal pulverized fuel fired pilot unit, which replicates conventional pulverized coal fired utility installations was utilized for the torrefied biomass fuel evaluation. Objectives for this evaluation were to characterize the biomass fuel properties, combustion properties, resulting ash and emission profiles. The following report details the specifics of WRI s CTF, the specific test objectives and program results. The evaluation program developed between WRI and ********* included a baseline test period utilizing PRB coal from the Spring Creek Mine and a specific fuel test period utilizing the supplied torrefied biomass fuel samples. The program encompassed chemical evaluations of the fuels used and resulting combustion characteristics. In an effort to screen the potential torrefied biomass fuel products, ********* and Vega Biofuels provided a supply of two separate torrefied biomass fuels, the chemical analysis of the fuels provided are shown in Table 1. The fuels labeled Biomass 300 C and Biomass 450 C were torrified under different temperature conditions by Vega Biofuels and were provided for the combustion evaluation, a description of the Vega Biofuel torrefaction process is beyond the scope of this report. Both biomass fuels provided were pulverized to a similar specification as is used with coal, 80% passing 200 mesh. The biomass fuels were easily pulverized and represented no significant challenges during the milling process. The fuel analysis represented significant differences when compared to PRB coal including increased BTU content, reduced moisture and reduced Sulphur. Review of Table 1 indicates that combustion of this fuel will result in reduced SO 2 formation and increased formation of NO X due to the increased fuel nitrogen content. Table 1. Fuel Analysis ASTM Method D7582 PRB Spring Creek Coal 300 C Biomass 300 C Biomass 450 C Biomass 450 C Biomass PROXIMATE As Received As Received % Diff. From Coal As Received % Diff. From Coal Component wt% wt% wt% Moisture % % Ash % % Volatile % % Fixed Carbon (calc.) % % Total ULTIMATE Component wt% wt% wt% Moisture % % Ash % % Carbon % % Hydrogen % % Nitrogen % % Sulfur % % Oxygen (calc.) % % Total BTU BTU/lb (HHV) ASTM D % % 5
7 To perform the combustion evaluations four separate testing days were scheduled with each test lasting approximately 8 hours, a list of the test series is shown below. During the test firings data collected included stack emission profiles, combustion conditions, flame formation, thermal profiles and resulting ash formation. A similar heat load of approximately 250,000 BTU/hr (+/ 10%) was used for each test in order to provide a consistent basis for comparison of data recorded. Following each test day the facility was disassembled for sampling and imaging/inspection of ash deposition on heat transfer surfaces. Test #1 Baseline PRB Coal Test #2 Biomass 300 C Test #3 Biomass 300 C, Duplicate Test Test #4 Biomass 450 C The 100% Biomass 300 C test firings were successfully conducted with minimal fuel related challenges. All results obtained were compared to the baseline coal test and indicate similar combustion performance with the exception of ash behavior. While the CTF is not capable of fully predicting the ash related concerns, as they relate to the ******** Power Station, it does provide an indication of what can be expected. The pilot facility indicated ESP performance loss in that approximately 10% of the total ash collected after completion of the test was found in the downstream baghouse. This suggests the ash generated from the biomass was of a chemical composition and/or particle size not capable of being captured by the pilot facility ESP. Additionally, the ash generated was also observed to increase fouling and blockage in the pilot facility air preheater and ESP inlet screen. This required frequent soot blowing to maintain low induced draft (ID) fan loads, 100% coal operations do not require any soot blowing during operation. Inspection of heat transfer surfaces such as the super heater tubes, re heater tubes and economizer section showed an increased deposition of biomass ash, from that of the baseline coal ash. Nearly all ash generated and collected from throughout the plant resembled fly ash and was bright white in color. The stack emissions related with the Biomass 300 C test confirm the assumptions generated from review of the fuels chemical analysis. There was an increase in NO x formation and substantial decrease in SO 2 formation compared to the baseline coal. The Sulphur reported in the fuel analysis was 90% less than that of the coal and is confirmed with analysis of the flue gas composition, as the stack gas analyzer did not detect any SO 2. Furthermore, the calcium reported in the ash chemistry may also provide a native capture of any SO 2 formation that may have been present. Combustion stability and efficiency was marginally different from that of the baseline coal as defined by the carbon monoxide present in the stack gases. Some periods of elevated and unstable CO formation were observed which suggests the fuel is slightly more difficult to burn than the baseline coal. This is also evident in the comparison of the fuels volatile matter as it is 30% less than the coal. The plant thermal profile generated during the Biomass 300 C testing was steady and nearly equivalent to that of the baseline coal test confirming similar thermal performance and combustion efficiency. The 100% Biomass 450 C tests were not as successfully completed as the Biomass 300 C fuel. Flame stability and incomplete combustion conditions were observed during the test. Attempts were made to alter the combustion air settings to improve the combustion characteristics which still resulted in highly elevated (+1000ppm) and unstable CO formation. The test was allowed to continue however an excessive 6
8 amount of air was required to sustain combustion and unstable flame zone temperatures were present. Considering the low volatile matter of the 450 C sample it is suspected that a much higher flame zone temperature, then is capable in the pilot facility, would be required to efficiently complete combustion of the Biomass 450 C fuel. Similar ash challenges were observed and frequent soot blowing was required. Post run facility inspections reveled a much darker ash formation than the Biomass 300 C, suggesting an increase in carbon content which is to be expected with the combustion challenges observed. Introduction ********* has contracted with Western Research Institute to conduct a solid fuel combustion evaluation program using WRI s Combustion Test Facility (CTF). ********* is currently evaluating potential biomass based fuels for replacing the traditional Powder River Basin (PRB) coal that is currently fired at the ********* ******** Power Station. Representatives from ********* and Vega Biofuels have supplied a torrified biomass fuel for this evaluation. Two separate biomass fuels were produced under different temperature conditions and were supplied for this evaluation. The objectives for testing were to screen the potential feedstocks for their combustion characteristics, emission profiles and provide a preliminary indication of resulting ash formations. This evaluation and its results are to be used by ********* in screening the potential feedstocks and determining a preliminary estimation of performance when fired in the ******** Power Station. Combustion Test Facility WRI s coal Combustion Test Facility (CTF) is a nominal 250,000 Btu/hr balanced draft system designed to replicate a pulverized coal fired utility boiler. A schematic and a photograph of the CTF are shown in Figures 1 and 2. In its present configuration, the unit is set up to simulate a tangential fired boiler (Figure 3), but may be adapted to wall fired or other configurations. A process flow diagram of the CTF is shown in Figure 4. The fuel feed system consists of screw based feeders and pneumatic transport to four burners inserted in the corners of a refractory lined firebox. The burners can be angled to attain different tangential flow characteristics in the firebox. The unit is equipped with appropriately sized heatrecovery surfaces such that the time/temperature profile of a utility boiler is replicated. These surfaces comprise water cooled panels that simulate the water wall, an air cooled super heater, re heater, two economizers and preheater. CTF includes provisions for preheating the combustion air to mimic a utility air preheater. The system also includes over fire air injection ports for combustion staging and several ports for injecting sorbents into the furnace. The CTF is equipped with two baghouses, electrostatic precipitator (ESP) and spray dry absorber (SDA). 7


9 Figure 1. Schematic of the Combustion Test Facility Figure 2. A photograph of WRI CTF 8

10 Figure 3. Cross Section of the Furnace at the Burners Level Figure 4. Process Flow Diagram of the CTF 9
11 Coal & Sorbent Feeding System All coals utilized in the CTF were pulverized to 80% passing 200 mesh. The coal and sorbent feeding device are screw type feeders with a controlled augur speed. The system is equipped with four large size coal feeders and two small sorbent feeders. Each feeder is placed over a balance where its weigh is continuously monitored and recorded using a data acquisition system. The feed rate is determined from the slop of the weight loss of the feeder over time. Air Feed System The air supplied to the furnace consists of primary, secondary and overfire air. The primary air is used as a carrier of coal from the coal feeder to the burner. The secondary air is used to balance the ratio of air to coal in the burner zone and accordingly control the degree of staging in this area, therefore, influencing the NOx and unburned carbon levels in the flue gas and fly ash, respectively. The overfire air is used to balance the air supply in order to maintain excess air/oxygen in the furnace. Both the primary and the secondary air are fed to the burner. The overfire air is injected at ports located at 12 inch above the coal burner. A total of ten mass flow meters are used to determine the flow rate of air to the furnace, that is, four for the primary air, four for the secondary air, one for the lower furnace overfire air (12 inch port), and one for upper furnace overfire air. System Pressure The system operates at a slight negative pressure using an induced draft (ID) fan located downstream of the bag house. The upper furnace pressure is maintained at a negative 0.3 inches of water column utilizing a variable frequency drive that controls the ID fan speed. The ID fan motor speed is used as a gauge of the fly ash loading on the baghouse filter. The baghouses are air pulsed to control the amount of fly ash over the filter. Flue Gas Measurements The flue gas can be sampled from three locations, two are located upstream of the baghouse and one downstream. Two filtration devices exist upstream of the bag house, one at the exit from the backpass (i.e., high temperature side) and the second at the exit from the cold temperature side. The third location is at the exit from the bag house filters. Flue gas sample is withdrawn from the filtration device through a sample conditioner using a sample pump, then pumped through several rotameters and finally to the flue gas analyzers. The sample line to the sample conditioner is heat traced. The flue gas analysis train consists of O2, SO2, NO, NO2 and CO analyzers. A list of various analyzers used for measuring the flue gas constituents is given in Table 1. Each instrument is regularly and routinely calibrated. Typically, the calibration process takes place during the beginning of the test day and is then checked throughout the test process. 10
12 Table 2. List of Analyzers used for Flue Gas Measurements Analyzer Basis for Analysis Brand/Model No. SO 2 Photometric Bovar Engineered Products/Model 721M NOx Chemiluminescence Thermo Environmental Instruments/Model 42I CO NDIR Fuji Model 3300 O 2 Paramagnetic M&C Instruments/PMA 22 Hg Photometric VM 3000 by Mercury Instruments Multi Gas FTIR MKS 2030 Fly Ash Sampling Train Figure 5 illustrates the fly ash sampling train. Fly ash samples are withdrawn at the same velocity in the sampling tube as is the velocity of flue gas in the main pipeline (iso kinetic). The fly ash is separated from the flue gas using a thermally insulated cyclone. The temperature of the flue gas inside the cyclone is continuously monitored and compared to the temperature of flue gas at the point the sample was extracted. The difference between these two temperatures is minimized, therefore, it is expected that the fly ash sample withdrawn to be a representative sample of fly ash in the main duct. Furnace Residence Time Figure 5. Fly Ash Sampling Set up A typical temperature residence time profile achieved during a test is displayed in Figure 6. Please note that the heat extraction rates in the furnace and the backpass can be adjusted to match any desired profile. 11
13 Figure 6. Typical time/temperature profile during a run at the CTF Combustion Evaluation Parameters Heat Release Monitor furnace and plant temperatures from the flame zone to the air preheater, approximately every 12 inches downstream of the flame zone. Flame Ignition/Stability Visually monitor and record (via photography and video) flame ignition distance from burner nozzles as well as flame/swirl stability. Heat Recovery Monitor temperatures and flow rates associated with the heat recovery surfaces in the furnace. Heat Recovery Monitor temperatures and flow rates associated with the air cooled superheater lid. Burn Out Efficiency Measure and evaluate stack CO concentrations. Burn Out Efficiency Sample fly ash at particulate control device. Evaluate for LOI and Carbon Content to determine combustion efficiency as compared to a coal baseline. Continuous Emissions Monitoring (CEM) Record and evaluate complete uncontrolled emissions profile during combustion (i.e. NOx, SOx, CO, HCL, O2). Laboratory Analysis Fuel Analysis Ult/Prox/Btu Laboratory Analysis Complete fly ash characterization and comparison 12

 with de ionized water to synthesize 8.8% by weight solution.")
14 Spray Dryer Absorber (SDA) SDA manufactured by GEA NIRO was integrated with the CTF on May The volume of the SDA is 12.5 ft 3, which allows a residence time in the range from 9 to 12 seconds depending on the volumetric flow rate of flue gas to the SDA and the operating temperatures. The SDA is equipped with a two fluid nozzle for atomizing the lime slurry in the chamber. Lime slurry is prepared by mixing pulverized hydrated lime (source: Mississippi lime) with de ionized water to synthesize 8.8% by weight solution. Analytical WRI works closely with Wyoming Analytical Laboratories located in Laramie Wyoming for routine solids analyses. Typical coal and fly ash analyses reports received are displayed below for reference. Table 3. Typical Coal Analysis report 13

, Biomass 300 C and Biomass 450 C provided by Vega Biofuels via ********* Flue Gas Path Air Pre heater outlet directed to ESP then fabric filter baghouse During the heat up")
15 Table 4. Typical Fly Ash Analysis Report Testing Methods Biomass Combustion Evaluation Test Protocol Test Objectives Combustion evaluation of torrefied biomass as compared to PRB coal Flame stability comparison Emission profile comparison Ash characterization and deposition locations compared to PRB coal Plant thermal profile Daily Test Set Up Fuel: PRB (Spring Creek Mine), Biomass 300 C and Biomass 450 C provided by Vega Biofuels via ********* Flue Gas Path Air Pre heater outlet directed to ESP then fabric filter baghouse During the heat up cycle target an oxygen level of 10% in order to reduce the possibility of CO formation (unburned carbon in fly ash) and consequently its negative impact on subsequent sampling. 14
16 Start solid fuel feeding only when baghouse exit temperature exit is over 160F and Furnace is about 1400F. Test Fuels PRB (Spring Creek Mine), Prepped at 80% passing 200 mesh, Moisture less than 15%. Biomass 300 C and Biomass 450 C; prepped at 80% passing 200 mesh. Heat Rate Adjust fuel feed rate to match 250,000 BTU/hr. Based on fuel analysis. Primary Air: lb/hr to each burner, adjustable to allow for continuous feeding of fuel Secondary Air: 20 lb/hr or higher to each burner Over fire Air: Adjust flow to reach 5% O2 in the furnace Actual air rates will be determined after review of the feed analysis (Prox/Ult/BTU) a target of 20% excess air will be used for all testing. Take sample of daily test coal Take Sample of daily biomass fuel Heat up cycle Start plant using Natural Gas and Coal, Target an average baghouse inlet temperature of 300 F before conducting the prescribed daily test Flue gas sampling Sample from baghouse outlet (Stack location). Sample both FTIR gases and O2 from this location. Combustion Evaluation Prepare appropriate amounts (~300lbs) of fuel for prescribed test day (i.e. baseline coal, Biomass 300 or Biomass 450). Baseline Reach steady state furnace operations on daily prescribed 250,000 BTU/hr and 20% excess air. Operate for a minimum of 8 hours to achieve representative steady plant conditions. Adjust primary air to achieve a ratio of 2.5 pounds of air per pound of coal, maintain 20% excess air using secondary and over fire airs. Note Furnace and flame zone stability, i.e. flame ignition distance and swirl stability Still and Video recording of flame zone via sight glass. Adjust air flows if necessary based on flame zone visual observation, CO and O2 profile Monitor and record complete plant temperature profile Monitor and record water wall flow rate and temperature in/out Monitor and record super heater lid temperature in/out Monitor and record Economizer flow rate and temperature in/out Measure stack gases with FTIR and O2 analyzer for entire test period Post Run Evaluation 15
17 Conduct imaging of all plant interior surfaces o Burner Walls o Bottom Ash hopper o Upper furnace o Super heater and Re heater Tubes o Economizer section o Air preheater o ESP and baghouse Ash sampling o Bottom ash o Super heater and re heater tubes o Economizer o ESP and Baghouse Note: Reserve samples for analysis, collect any unusual ash formation and note location. Results Results from test burns performed are reported below. To conduct the following tests, each day began by stabilizing the furnace on the prescribed fuel of interest. Once relative stability was achieved the natural gas fired ignitor was turned off and representative temperature profiles of the furnace, downstream ducting and heat recovery surfaces were recorded for approximately 8 hours. During this time flue gas characterization and flame zone imaging was also conducted. The day following each test the facility was disassembled for post run imaging of the furnace and heat recovery surfaces, as well as collection of ash and slag samples from the bottom cone, super heater lid and particulate control devices. The entire pilot plant was then cleaned of all deposits to avoid contamination of subsequent testing. Solid Fuel Analysis The following table represents the as received fuel analysis conducted for each fuel used during the testing campaign. Additionally, the percent difference between the biomass fuels and coal is presented. The fuel analysis presented was used in determining the stoichiometry for combustion of each fuel. For all testing fuel feed rates were maintained at approximately 250,000 BTU/hr. 16
18 Table 5. Proximate, Ultimate, BTU Analysis ASTM Method D7582 PRB Spring Creek Coal 300 C Biomass 300 C Biomass 450 C Biomass 450 C Biomass PROXIMATE As Received As Received % Diff. From Coal As Received % Diff. From Coal Component wt% wt% wt% Moisture % % Ash % % Volatile % % Fixed Carbon (calc.) % % Total ULTIMATE Component wt% wt% wt% Moisture % % Ash % % Carbon % % Hydrogen % % Nitrogen % % Sulfur % % Oxygen (calc.) % % Total BTU BTU/lb (HHV) ASTM D % % Solid fuel analysis was performed utilizing ASTM Standard Testing Methods at commercial laboratories. The original reports can be found in Attachment II 17
19 Data Summary The overall results for each test day are summarized in Table 8. This table provides the fuel description, combustion conditions, furnace heat recovery values and average emission profile data. Supplemental data including raw and refined recordings from the CTF data acquisition system has been provided to ********* staff. The file list supplied is shown below. Baseline 3_22_2016 Data.xlsx Biomass 300 C 2_28_2016 Data.xlsx Biomass 300 Duplicate 3_30_2016.xlsx Biomass 450 4_1_2016.xlsx Combustion Conditions Combustion conditions utilized during test firings are reported. A primary air to fuel ratio of approximately was targeted, using an overall combustion stoichiometry of 1.2. The exception to this was the 450 C test firing which required significantly higher excess air in an attempt to stabilize flame formations and complete combustion. Target combustion conditions included burner zone stoichiometry of approximately with the additional 20% provided via the over fire air ports. As shown in Table 8 each test was conducted at approximately 250,000 BTU/hr (+/ 10%) energy input, depending upon the feeding stability and overall average feed rates. Heat Rejection Heat recovery results reported are that of the measured heat input into the water wall working fluid (glycol), super heater working fluid (air) and upper economizer (glycol). Heat recovery values are developed by monitoring the delta T and mass flow rates of the working fluid across the heat recovery devices. This value gives an indication of the fuels combustion efficiency as it relates to stable flame formation and complete conversion. Furthermore, these values can give an indication of increased fouling or deposition on heat recovery surfaces. The biomass testing indicated increased heat transfer from that of baseline by 15% (Biomass 300) to 20% (Biomass 450) in the water wall working fluid. The super heater heat rejection from biomass testing was reduced from that of baseline by 20% (Biomass 300) to 25% (Biomass 450). The economizer heat rejection for biomass testing was shown to be reduced from that of baseline by 10% (Biomass 450) to 21% (Biomass 300). The reduction in heat transfer is assumed to be the consequence of increased heat removal in the water walls and increased deposition of ash observed on the super heater and economizer surfaces. Total heat recovery from the water walls, super heater and economizer for each test conducted was similar. All heat recovery working fluid volumetric flow rates were matched for each test day. Therefore, providing a basis for comparison of the heat rejection, considering similar heat input rates. Average Flue Gas Characterization Flue gas characterization was conducted by monitoring stack gases using a multi gas FTIR analyzer and a paramagnetic oxygen analyzer. The values reported in Table 8 are that of the average, during steady 18
20 state conditions, for each test conducted and represent the uncontrolled emission profile observed for each blend at the feed rate considered. The plotted emission profiles for each test can be seen in Attachment III. The biomass emission profile was significantly different from that of the baseline coal due to the difference in feedstock chemistry and combustion properties. SO 2 formation was undetectable during biomass combustion due to the low Sulphur present in the feedstock and presumably the high calcium ash chemistry. The NO x formation was observed to increase from that of baseline due to the increased nitrogen content of the biomass feedstocks. Carbon monoxide formation was increased from baseline in all biomass cases due to the combustion properties and flame stability. The biomass test firings both the 300 and 450 samples showed unstable CO formation and is suspected to be due to the deceased volatile content of the feedstocks and consequently decreased ease of combustion. The Biomass 450 C sample proved to be the most difficult to combust and required highly increased air rates to attempt complete carbon conversion. This phenomenon may be reduced with increased flame zone temperatures and or flame zone residence time which are not observed in the pilot facility. 19
21 Table 6. Biomass Testing Measured Data Summary Parameter Run Date 3/22/2016 3/28/2016 3/30/2016 4/1/2016 Fuel PRB Spring Creel Coal 300 C Biomass 300 C Biomass Duplicate Test 450 C Biomass Particle Size 80% Passing 200 mesh 80% Passing 200 mesh 80% Passing 200 mesh 80% Passing 200 mesh Fuel Feed Rate lb/hr Primary Air to Fuel Ratio lb/hr Overall Stoichiometry (Calc.)-Target 1.2 Ratio Burner Stoichiometric Ratio Ratio Total Air lb/hr Air/Fuel Ratio Fuel Heat Content BTU/lb 10,311 12,207 12,207 12,004 Heat Input (Calc) Target 200K BTU/hr 238, , , ,681 Water Wall Heat Rejection (Calc) BTU/hr 94, , , ,417 Super Heater Heat Rejection (Calc.) BTU/hr 38,334 30,643 30,180 28,841 Economizer Heat Rejection (Calc.) BTU/hr 10,137 8,015 8,015 9,194 Total Heat Recovery (Calc.) BTU/hr 143, , , ,452 Oxygen (measured at Stack) %, dry CO2 (measured at Stack) %, dry H2O (measured at Stack) % CO@3% O 2 PPM, dry NOX@3% O 2 PPM, dry SO 3% O 2 PPM, dry 315 Below Detection Limit Below Detection Limit Below Detection Limit 20
22 Thermal Evaluation Evaluation of the plant temperature profile alludes to several specific fuel/material properties including heat release and thermal stability as it relates to combustion efficiency, as well as material handling and fuel feeding. Figure 7 below depicts the recorded flame zone temperature profile and average flame zone temperature for each test conducted. In the case of the baseline 100% Coal test it shows a steady profile indicating consistent feeding characteristics and stable flame formation, when coupled with flue gas CO values one can also conclude efficient or near complete combustion. Both Biomass 300 C tests showed similarly stable flame zone temperatures. The Biomass 450 C flame profile showed increased instability and is also verified by the CO formation profile recorded. Emission profiles can be seen in Attachment III. Flame Zone Temperature Baseline PRB Coal Biomass 300C #1 Biomass 300C #2 Biomass 450C degf :00 09:00 10:00 11:00 12:00 13:00 14:00 15:00 16:00 17:00 18:00 19:00 Time Figure 7. Average Flame Zone Temperature and Stability. Table 7 and Figure 8 compares the average plant temperature profile from the flame zone to the ESP outlet. The data presented shows similar temperatures for all tests conducted which is expected considering a similar heat input rate was used for each test and the operating parameters of the heat recovery surfaces were matched for each test (i.e. flow rates of water wall system, super heater lid and economizer). The most notable differences are the post super heater and post economizer sections which show increased flue gas temperatures from baseline which is assumed to be a result of increased ash deposition on the heat transfer surfaces resulting in reduced heat transfer. 21
23 Table 7. Average Plant Temperature Profile Comparison. TC Location Description > 16" Above 32" Above 60" Above Post Super Pre Post Air Pre Air Pre Flame Zone Flame Flame Flame Furnace Exit Heater Economizer Economizer heater In Heater Out ESP In ESP Out Test Test Fuel TC1 TC2 TC3 TC5 TC31 TC6 TC7 TC10 TC11 TC12 TC13 TC14 Date ID Composition degf degf degf degf degf degf degf degf degf degf degf degf 2016/03/22 Baseline 100% Coal /03/28 Test #1 100% Biomass C /03/30 Test #2 100% Biomass 300 C (2) /04/01 Test #3 100% Biomass 450 C Figure 8. Average Plant Temperature Profile Comparison % Coal 100% Biomass C % Biomass 300 C (2) 100% Biomass 450 C Flame Zone 16" Above Flame 32" Above Flame 60" Above Flame Furnace Exit Post Super Heater Pre Economizer Post Economizer Air Pre heater In Air Pre Heater Out ESP In ESP Out 22
24 Observed Combustion Stability; O2 and CO Profiles In an effort to quantify combustion stability oxygen and carbon monoxide in the stack gas is monitored. The formation of CO gives an indication of the flame zone stability and resulting combustion efficiency. The following figures show the recorded O 2 and CO profiles for each test conducted. Baseline Coal The formation of CO during the baseline coal test indicates stable combustion and feeding characteristics. The measured CO was below 10 ppm and stable for the entire testing period. Changes in O2 concentration are a results of fuel feed adjustments of pulsing/soot blowing activities which are conducted with compressed air. % of O₂ O2 CO Baseline PRB Coal :00 10:00 11:00 12:00 13:00 14:00 15:00 16:00 17:00 18:00 19: ppm of CO Biomass 300 C Figure 9. Baseline Coal, O2 and CO profile. The formation of CO during the Biomass 300 C test was less stable than that of the baseline coal and indicates increased combustion difficulties due to the low volatile matter. The average CO formation was manageable (< 100 ppm) and improvements would be expected at larger scale due to increased flame zone temperatures and residence time. The duplicate test resulted in different CO profile and it is suspected to be due to disturbances in flue gas velocities resulting from downstream plugging observed in the air pre heater and ESP inlet screen. Again, spikes in O2 are a result of baghouse pulsing and soot blowing activities. These activities were increased in the duplicate test due to the variability of ash deposition and requirement to soot blow the areas prone to blockage or plugging with a higher frequency than the first test. 23
25 % of O₂ O2 Biomass 300C #1 8 CO :00 10:00 11:00 12:00 13:00 14:00 15:00 16:00 17:00 18:00 19:00 ppm of CO % of O₂ Figure 10. Biomass 300 C, O2 and CO profile O2 Biomass 300C #2 8 CO :00 10:00 11:00 12:00 13:00 14:00 15:00 16:00 17:00 18:00 19:00 ppm of CO Figure 11. Biomass 300 C Duplicate Test, O2 and CO profile. Biomass 450 C Formation of CO observed during the 450 C test was highly variable and unstable. This suggests increased difficulty to completely combust the fuel at the temperatures observed. This results in reduced carbon conversion and increased carbon content of the fly ash generated. Furthermore, the unstable flame zone environment observed would be cause for concern in operation of a utility boiler and ability to maintain stable furnace pressure conditions. To increase the stability much higher flame zone temperatures would be required to efficiently complete the combustion of the sample provided. 24
26 % of O₂ 10 9 O2 Biomass 450C 8 CO :45 09:45 10:45 11:45 12:45 13:45 14:45 15:45 16:45 17: ppm of CO Figure 12. Biomass 450 C, O2 and CO profile. Particle Burn Out Analysis In an effort to compare the fuel burn out efficiency with that of the baseline coal test, ash samples from the ESP were collected and analyzed for carbon content. Utilizing the data obtained a balance was performed to determine the amount of unburnt fuel remaining in each fly ash sample. The analysis relies upon the carbon content in each fuel sample, the ash content and the resulting carbon content observed in the actual fly ash sample produced during testing. Assuming zero carbon content of the ash reported in the ultimate fuel analysis the percent carbon in the collected fly ash samples is considered to be from unburnt fuel. Based on the amount of carbon in the ultimate fuel analysis, percentage of unburnt fuel in fly ash is then determined, the results from this analysis are presented in the table below. Table 8. Carbon Conversion Analysis Test Date Test ID Fuel Analysis Ash Analysis Fuel Feed Rate Unburnt Carbon Carbon Ash Carbon Composition wt% wt% lb/hr BTU/lb MMBTU/hr wt% wt% lb/hr lb/mmbtu 2016/03/22 Baseline PRB Coal /03/26 Test #1 Biomass 300C # /03/28 Test #2 Biomass 300C # /04/01 Test #3 Biomass 450C The amount of unburnt carbon was lowest in the baseline ash sample and suggests near complete conversion of carbon. Values of unburnt carbon in all tests is increased from that of the baseline coal test. The difference is presumed to be the result of the combustion conditions, fuel properties and behavior observed within the CTF. The effect of fuel properties such as particle size and volatile matter dictate burn out rates and the reported unburnt carbon values suggest that insufficient residence time or flame zone temperatures existed. This would most likely be improved in a commercial PC boiler setting due to increased furnace temperatures, residence time and favorable material handling conditions (i.e. larger burner arrangements and less wall effects). 25
27 Ash Formation and Characterization Table 9 shows the expected ash loading from the various fuels and is presented based on both mass and BTU rates. In both the Biomass 300 C and Biomass 450 C fuels the ash loading per MMBTU is shown to decrease based on results from the proximate and ultimate analyses conducted. Table 9. Average Ash Loading Rate (calc.) Test Test Fuel Fuel Analysis Average Fuel Feed Rate Average Ash Rate Date ID Composition Ash, wt% lb/hr (ave.) BTU/lb MMBTU/hr lb/hr lb/mmbtu 2016/03/22 Baseline PRB Coal /03/26 Test #1 Biomass 300C # /03/28 Test #2 Biomass 300C # /04/01 Test #3 Biomass 450C Ash chemistry was conducted on the various fuel samples supplied for the test campaign. The elemental analysis was performed directly from fuel samples ashed under lab conditions using ATSM Method D6349. A comparison is given in Table 10 below, the original reports can be found in Attachment II. The most notable difference between the coal and biomass is the amount of calcium in the biomass. Table 10. Fuel Ash Chemistry Elemental Ash Analsyis Comparison from Fuel Sample Ash Component, Metals as Oxides Baseline Coal, % Biomass 300 C, % Biomass 450 C, % ASTM Method Calcium D6349 Iron D6349 Magnesium D6349 Sodium D6349 Potassium D6349 Aluminum D6349 Manganese D6349 Silicon D6349 Barium D6349 Phosphorus D6349 Titanium D6349 Strontium D6349 Sulfur D6349 Evaluation of ash formation and deposition was conducted during the testing campaign. The day following completion of the test runs the pilot facility was cooled and disassembled for surface imaging and ash sampling. Efforts are made to collect as much of the ash deposits as possible, however due to the construction of the pilot facility and sampling capabilities a complete mass balance on ash sampling cannot be accomplished. Therefore, the mass data recorded does not reflect the total amount of ash generated and provides only a qualitative representation of ash deposition locations. To provide consistency for test comparisons the same sampling techniques are used for each test and each sample location. 26
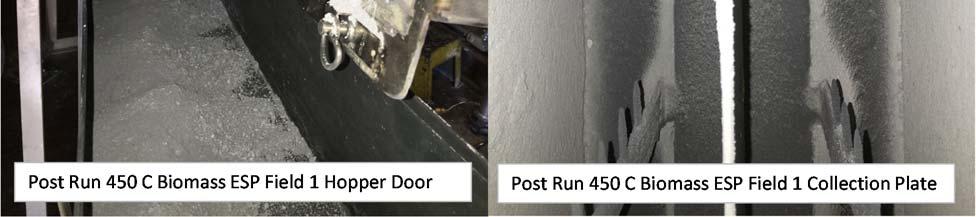
28 Table 11 is descriptive of the sampling locations and amounts present. No unusual formations were reported for the baseline testing and the electrostatic precipitator was capable of collecting nearly all of the ash introduced. This is determined by collecting any ash present in the baghouse as shown in Table 11 no ash was present or collectable in the baghouse during the baseline run. The Biomass 300 tests showed significant particle slip past the ESP with 10 11% of the total ash collected being present in the baghouse. This suggests reduced ESP performance and is suspected to be due to the biomass ash chemistry and particle size. The pilot facility ESP has 4 separate fields in series with fields 1 and 2 operating independently and fields 3 and 4 operating from the same power supply and control. During the Biomass 300 test Fields 3 and 4 did not have a collectable sample amount, only a light dusting. This suggests a portion of the biomass ash is of a nature that is not capable of being captured in the pilot facility ESP. Similarly, the Biomass 450 test showed particle slip past the ESP at approximately 2.5% of the total ash collected. During this test some ash was collected in Fields 3 and 4 and suggested improved/reduced ash resistivity. However, considering the ash was dark grey color it is suspected that this ash contains a high carbon content which would aide in reducing the resistivity and improve ESP performance. No significant ash or slag accumulation was observed in the furnace. The heat exchange tubes (super heater, re heater and economizer) did have a thicker deposit as compared to baseline. The pilot facility uses an ash knock out device before the air preheater to prevent ash plugging. This device would not be typical in the ******** Plant and the ash collected here would be expected additional load on the ESP or particulate control device. It is important to note that significant plugging in the air preheater and ESP inlet distribution screen was observed during biomass testing, this issue is not observed during baseline coal. The plugging suggests increased adhesion properties of the biomass ash (i.e. sticky). Pilot plant operators had to soot blow or pulse the air preheater, ESP inlet and baghouse several times during the test day. No soot blowing or pulsing is required during baseline coal operations. After consultation with ********* staff is was determined to only conduct ash chemistry of the produced ash samples on the Biomass 300 samples and the baseline samples. Due to the large nature of the ash chemistry report those results were provided to ********* staff in separate document and are not addressed in this report. 27
29 Table 11. Ash Collection and Locations Baseline Coal Test Sample Location Sample Weight % of Collection Comments Bottom Ash % Small Sample Suspected from Thermal Shed Super Heater Tubes % Thin layer of milky colored ash Economizer % This sample is a composite of Econ. and Ash knock out Air Preheater Ash Knock out % See comment above ESP Field % Normal collection loose fine material ESP Field % Normal collection loose fine material ESP Field % Light dusting on surfaces no collection ESP Field % Light dusting on surfaces no collection Baghouse % Light dusting on bags no collection Biomass 300 C Test #1 Sample Location Sample Weight % of Collection Comments Bottom Ash % Small Sample Suspected from Thermal Shed Super Heater Tubes % Thicker layer than baseline Bright white in color Economizer % White in color powder and some hard material Air Preheater Ash Knock out % Large sample Bright white in color Expected ESP load in utility boiler ESP Field % Sticky material stuck to hopper door and collection plates ESP Field % Sticky material stuck to hopper door and collection plates ESP Field % Light dusting on surfaces no collection ESP Field % Light dusting on surfaces no collection Baghouse % Not captured by ESP Suspect high resistivity and or particle size issue Biomass 300 C Test #2 Sample Location Biomass 300 #2 % of Collection Comments Bottom Ash % Small Sample Suspected from Thermal Shed Super Heater Tubes % Thicker layer than baseline Bright white in color Economizer % White in color powder and some hard material Air Preheater Ash Knock out % Large sample Bright white in color Expected ESP load in utility boiler ESP Field % Sticky material stuck to hopper door and collection plates ESP Field % Sticky material stuck to hopper door and collection plates ESP Field % Light dusting on surfaces no collection ESP Field % Light dusting on surfaces no collection Baghouse % Not captured by ESP Suspect high resistivity and or particle size issue Biomass 450 C Test Sample Location Biomass 450 % of Collection Comments Bottom Ash % Small Sample Suspected from Thermal Shed Super Heater Tubes % Thicker layer than baseline White/Grey in color suspect increased carbon Economizer % Grey in color powder and some hard material Air Preheater Ash Knock out % Grey in color, suspect increased carbon Expected ESP load in utility boiler ESP Field % Darker Grey in color suspect increased carbon ESP Field % Darker Grey in color suspect increased carbon ESP Field % Darker Grey in color suspect increased carbon Sample note observed in Bio 300 test ESP Field % Darker Grey in color suspect increased carbon Sample note observed in Bio 300 test Baghouse % Not captured by ESP Suspect high resistivity and or particle size issue 28
30 Combustion Imaging During the steady state testing periods for each test day flame zone imaging was conducted. This included still photography and video imaging, the video imaging is supplied as additional data with this report. Review of video imaging demonstrates flame/swirl formation, fuel ignition location, evidence of flame zone pulsing, furnace wall condition and overall combustion and feeding stability. Below is a summarized list of observations made, by CTF Staff, from flame zone videos using the 100% PRB coal case as a comparison. 100% Baseline Coal o Well developed flame swirl o Visible ignition distance from burner nozzle (3 4 inches) o No visible furnace wall accumulation o Minimal flame zone pulsing o Stable fuel feeding 300 C Biomass o Sufficient flame swirl development, i.e. some flame pulsing o Observed larger flame ball or swirl circumference o Visible ignition distance from burner nozzle (4 5 inches) o No visible furnace wall accumulation o Minimal visible sparks from unburnt fuel particles o Stable fuel feeding 300 C Biomass Duplicate Test o Similar observation to first Biomass 300 C Test o Sufficient flame swirl development, i.e. some flame pulsing o Observed larger flame ball or swirl circumference o The CO formation from the duplicate test was increased from the 1 st test and suggests increased pulsing o Visible ignition distance from burner nozzle (4 5 inches) o No visible furnace wall accumulation o Minimal visible sparks from unburnt fuel particles o Stable fuel feeding 450 C Biomass o Sufficient swirl development with decreased flame stability from that of Biomass 300 as evident by the CO profile and periods of fuel rich conditions, i.e. decreased combustion efficiency o Stable fuel feeding o Observed larger flame ball or swirl circumference o Visible ignition distance from burner nozzle (4 5 inches) o No visible furnace wall accumulation o Minimal visible sparks from unburnt fuel particles The observation made during flame zone imaging indicate the supplied biomass fuel samples have different flame formations from that of the baseline coal. This is evident in the chemical analysis of the fuels as the biomass samples have increased carbon content and reduced volatile matter from that of the coal sample used, similar to a pet coke fuel. As a result the biomass fuel requires higher flame zone 29
31 temperatures and or increased flame zone residence time to complete the combustion process. The biomass flames observed appeared cloudy compared to baseline coal, suggesting increased soot formation from unburnt carbon. This was most evident in the Biomass 450 C sample. Figure 13 below is representative of the flame developed for each case considered. The images build upon the observations made from the flame zone videos and show swirl development and any presence of furnace wall accumulation or burner nozzle fouling. w 30


32 Figure 13. Flame Zone Image Comparison. 31
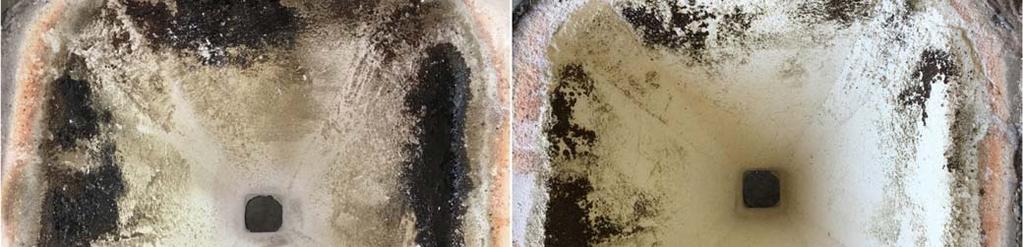
33 Post Run Imaging The following section details the condition of the interior plant surfaces under post run conditions. Images of the bottom cone, furnace wall, burner nozzles, super heater tubes, re heater tubes, upper furnace/bull nose, economizer section, air preheater and ESP are provided for observation. Additional high resolution images are provided with the data files previously referenced. Figures provide a reference for the varying degrees of furnace wall accumulation and general adhesion characteristics on heat recovery surfaces of the slag and ash produced during each run. Additionally, they indicate the degree of burner nozzle fouling observed and the amounts of bottom ash/slag created. Samples of heat transfer surface deposits, bottom ash and fly ash were collected from the respective areas and are being analyzed for major elemental composition. Furnace Walls (Figure 14) Review of the furnace wall imaging indicates that in all cases considered there was no significant additional accumulation from that of the baseline coal testing. The main observation is that of a color difference from baseline as would be expected due to the differing ash composition. Observations made during operation and plant clean out was that the material was extremely friable and easily removed from the wall surfaces, by light brushing or compressed air. Bottom Cone (Figure 15) Condition of the furnace bottom cone indicated very minimal accumulation of bottom ash material, suggesting all fuel constituents were entrained in the furnace flow a reported as fly ash. During 300C Biomass Testing some hard molten slag was formed near the edges of the bottom ash hopper and is visible in Figure 11. Burner Nozzle (Figure 16) The burner nozzle condition represented varying degrees of nozzle fouling in all tests including baseline. The formation of friable material near the burner nozzles was easily removed via air lance and was evident on all tests. 32


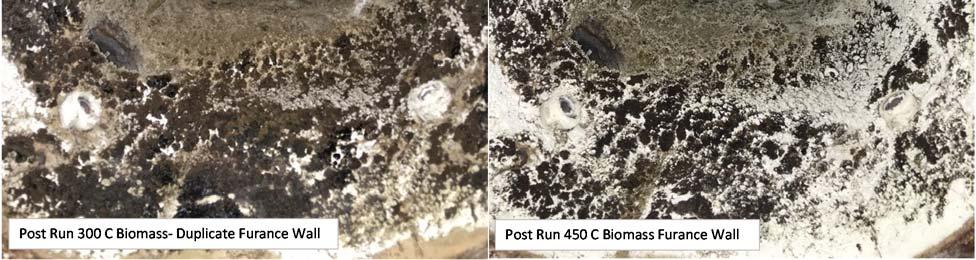
34 Figure 14. Post Run Furnace wall Condition. 33


35 Figure 15. Post Run Furnace Bottom Cone Condition. 34


36 Figure 16. Post Run Burner Nozzle Condition. 35


37 Super Heater Tube/Bull Nose Section (Figures 17 & 18) Super heater tubes are shown to have increased material deposit from that of baseline coal and are also varied in color as expected from the different chemical composition of the ash produced from the biomass fuel samples. The amount of material deposited at the furnace exit or bull nose section was increased from that of baseline for all biomass samples tested. The first and second 300 C tests showed similar accumulation with the 450C showing some darker material suspected to be carbon resulting from combustion instability. Figure 17. Post Run Super Heater Tube Condition. 36


38 Figure 18. Post Run Upper Furnace Bull Nose Region. 37


39 Re Heater Tubes (Figure 19) The Re Heater tubes showed a deposit very similar to the Super Heater tubes and resembled the fly ash collected. The deposit was increased from that of baseline suggesting increased adhesion properties of the biomass ash formed. The material was light and fluffy and easily removed with compressed air. Figure 19. Post Run Re Heater Tubes. 38


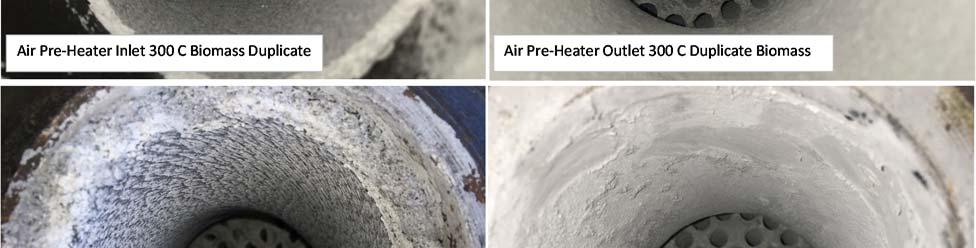
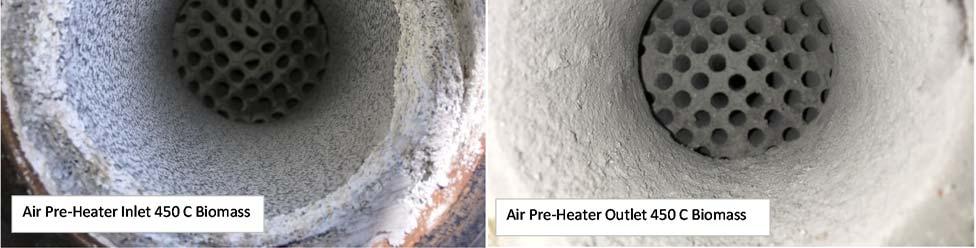
40 Back Pass/Economizer Section (Figure 20) The back pass and economizer section indicate increased fouling from the baseline case and was observed to be most prevalent in the 450 C Biomass test. The images indicate an increased quantity of carbon/unburnt fuel present in the deposited 450 C ash. Again the material was not hard and easily removed via air lance. Air Pre Heater Heat Exchanger (Figure 21) Figure 20. Post Run Economizer Tube Condition. The air preheater was cause of significant plugging during biomass test firings and increased ID fan speeds. This is not observed during baseline testing and consequently air preheater images were not recorded after baseline testing, the baseline fly ash typically forms a very fine layer on the air preheater tube surfaces. The fouling between the two 300 C biomass tests appears different however this is a result of increased soot blowing procedures during the duplicate test run. 39


41 Figure 21. Post Run Air Pre Heater Condition 40

 there is a portion of the material that the ESP was not capable of capturing efficiently.")
42 Particulate Control Devices ESP and Baghouse (Figure 22 25) The ash collected in the ESP fields for the two 300 C Biomass test firings was very similar in form and had increased adhesion properties as it can be seen stuck to the hopper doors after being opened. This suggests reduced efficiency of rapping systems and may decrease the performance of the ESP. Both fields 1 and 2 exhibited similar properties. Fields 3 and 4 showed only a fine layer of ash for the 300 C tests. Considering fly ash was collected in the baghouse (post ESP) there is a portion of the material that the ESP was not capable of capturing efficiently. Further evaluation of the material collected, such as particle size, elemental composition and resistivity should be considered to further define the reduced efficiency of the ESP. Figure 22. Post Run 300C Biomass ESP Field 1 Condition. 41


43 Figure 23. Post Run 300C Biomass Duplicate ESP Field 1 Condition. Figure 24. Post Run 450C Biomass ESP Field 1 Condition. 42


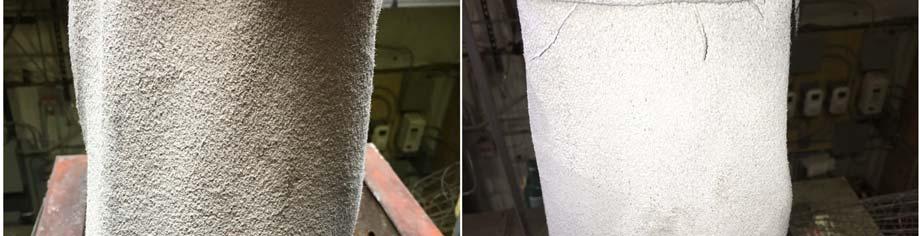

44 Figure 25. Post Run Baghouse Bag Condition. 43
45 Conclusion The purpose of the reported combustion evaluation was to screen potential torrefied biomass fuels for use a replacement fuel at the ******** Power Station. In doing this the combustion characteristics and pilot test facility operating conditions, while fired with biomass fuels, were monitored and compared with a baseline coal evaluation. The testing program included monitoring flame formation, heat release, plant thermal profiles, ash generation/deposition and stack emission characterization. The pilot facility utilized to conduct the evaluations is designed to replicate a full scale pulverized coal fired installation. The facility is capable of indicating many of the changes and or challenges present when considering a fuel change at given installation. The testing conducted has revealed several differences and similarities in performance of the pilot facility as compared to a coal fired test. The Biomass 300 C fuel produced plant thermal profiles very similar to that of the coal fired test. Minimal thermal differences were noted across the heat recovery surfaces, such as reduced delta T across the super heater and economizer. This difference is suspected to be an effect of reduced flue gas velocities, due to lower flue gas moisture, and additional accumulation of ash discovered on the surfaces. As expected, the uncontrolled stack gas emission were also found to be different from that of the coal fired tests. The NO x formation was found to be approximately 45% greater than the coal fired test and SO 2 formation was not detectable indicating 100% reduction from the coal test. The most notable difference between the biomass fuel and coal was the formation of ash and ash characteristics. Ash formation per MMBTU is reduced by approximately 3% based on the fuel analysis performed. However, the fly ash generated was more likely to adhere to heat transfer surfaces than the fly ash generated from coal. The ash chemistry was also rather different and is suspected to be of higher resistivity as ESP particle slippage was present. Approximately 10% of the total ash collected after completion of the test found in the baghouse downstream of the ESP. Similarly the Biomass 450 C fuel produced comparable thermal profiles. However, the combustion stability was greatly reduced from that of the Biomass 300 C as indicated by the unstable and high CO formation. The test conducted was not found to be highly comparable to the coal or Biomass 300 test due to the combustion instability and the requirement of increased combustion air rates used. In an attempt to fully combust the Biomass 450 air rates were increased by approximately 17% with minimal improvement in CO formation observed. It is suspected that the low volatile matter content of the fuel would require higher furnace temperatures and or increased furnace residence time to fully complete combustion in the pilot facility. In conclusion, the testing performed indicated that Biomass 300 C fuel was superior to that of the 450 C as it relates to combustion stability and efficiency in the pilot facility. Both fuels are capable of being burned in a commercial PC boiler but each represent challenges with respect to ash formation/deposition and particulate control. Additionally, the increased nitrogen content of the fuels may also be cause for concern as it relates to regulated NO X emissions. 44
46 45
47 Attachment I. Test Day Log Book Summaries 46
48 Baseline Test 100% Coal Spring Creek Coal 2016/03/22 ********* Baseline Run 3/21/ Start Natural Gas Overnight Warm Up 3/22/2016 Timeline 0728 Start Feeder Start Feeder Start Feeder Start Feeder 4 Note: Target Feed Rate 23.6 lb/hr APC Arrangment ESP > BH PA 16.5 lb/hr per feeder SA 27 lb/hr per feeder OFA 45 Total 1300 O2=5.1% SO2=275ppm Nox=240 ppm ESP Inlet Temp = 350 F 1459 Rise in O2 and ID Fan suspect blockage in duct 1508 Pulse BH > ID Fan and O2 back to normal conditions 1530 Conduct Baseline Flame Zone Imaging 1900 Shut Down End of Test 3/23/2016 Post Run Notes/Observations Conduct Post Run Plant Imaging Ash Sampling Cleanout Very Minimal Bottom ash < 100g No furnace wall sample taken nothing unusual ESP Field 3 and 4 hoppers empty very light dusting Normal NO ash in Baghouse Hopper 47
49 100% Biomass 300 C 2016/03/28 ********* Biomass 300C Run #1 3/27/ Start Natural Gas Overnight Warm Up 3/28/2016 ********* Biomass 300C Run # Load Feeders with Biomass 300 C Sample 0748 Start Feeder 1 Note: Similar O2 profiel as Coal 0756 Start Feeder 3 Note: Similar O2 Profile as Coal Note: Biomass 300 C Received Friday 3/25/2016 Barrel 1= 201 lb. Barrel 2= 196 lb. Barrel 3= 90 lb. Total = 487 lb, Total minus barrel weight 436 lb. of biomass Sample ID (Biomass 300 C) 0803 Start Feeder 3 TC2 Fail > Replaced 0815 Start Feeder Cut Natural Gas to 20% CV 0838 Cut Natural Gas to 10% CV 0853 Start FTIR measuring gas from baghouse out Stack 0952 Natural Gas Off 1030 Flame Zone Imaging Note: Target Feed Rate 20.8 lb/hr PA= 14 lb/hr per feeder SA= 27 lb.hr per feeder OFA= 56 lb/hr total 1046 Set ESP vibrator on auto 1314 Rap ESP with Large Vibrator 1316 Pulse Baghouse 1409 Pulse Baghouse > No change in ID fan Hz Baghouse DP=1.25" h20 Ahs plugging somewhere in plant up stream of ESP 1416 Air Lance/Soot Blow Super Heater lid and Reheater No Change in ID Fan speed 1418 Air Lance Economiser section minimla change Suspect blockage in air pre heater HX tubes Blockage is not bad and draft is being maintained but load on ID Fan is Increasing 1422 Hz on ID fan= 50 Hz 1444 Air lance air preheater HX tubes ID fan drop to 47 Hzfrom 52 Hz 1639 ID Fan 51 Hz 1644 BH DP= 2" h20 ID Fan at 48 Hz Pulse Baghouse DP drop to 1.25 " h Flame Zone Imaging 1804 Shut Down End of test 3/29/2016 Post Run Clean out, sampling and imaging Notes: Minimal Bottom Ash <100g Furnace walls minimal accumulation nothing unusal noted lighter in color than Baseline Thick white ash on Super heater tubes ahnd reheater tubes (compared to baseline) Ash knockout before air preheater has a lot of white fluffy ash whcich was sticky Air preheater HX tubes were heavily coated with sticky white ash some tubes blocked ESP Field 1 significant ash volume > Stuck to hopper door ESP F2 Similar to 1 Baghouse has some ash and was expected due to DP increase across BH during run Feeders clean no clogging in transer lines 48
50 100% Biomass 300 C Duplicate 2016/03/30 ********* Biomass 300C Run #2 3/29/2016 Start Natural Gas Overnight Warm Up 3/30/ Load Feeders with Biomass 300 C 0739 Start Feeder Start Feeder Start Feeder Start Feeder 4 Note Similar start up as previous test 0830 Cut Gas to 20 % CV Ramp Bio feedrate 0840 Cut Gas to 10 % CV Ramp Bio feedrate 0844 Duplicate 3/28/2016 Comb. Settings 0952 Natural Gas Off Note: Baghouse DP=1.4" h Step Change in ID Fan Speed, suspect air preheater plug 1039 Soot blow air pre heater minimal change in fan speed 1041 Note: As ID fan suction increases downstream of blockage larger vacuum is seen in baghouse and ESP and increases possibility of any seal leaks which makes O2 read high at stack; O2 rise is not a consequence of combution 1300 Soot Blow HX clog cleared ID fan from 52Hz to 47 Hz 1443 Soot Blow HX clog cleared ID fan from 52Hz to 47 Hz 1447 Baghouse DP = " h2o 1600 Step change in ID fan speed 52 Hz >54 Hz O2 increasing 1602 Soot Blow Fan speed decrease to 53 Hz no O2 recovery 1605 Baghouse DP upto 1.75" h2o 1608 Pulse BH DP drop to 1.25" O2 still high 1612 Soot blow HX 1617 Hopper door seal on ESP is leaking due to increased suction down stream of air preheater 1744 ID Fan speed 54 Hz Soot blow No change 1800 Shut Down End of Test 3/31/2016 Plant Clean Out, Sampling and imaging Notes Minimal bottom ash < 100g Similar accumulation on furnace walls as previous test Some hard black slag formation on bottom cone edges Thick white ash on SH and reheat tubes Ash knock out + 1 gallon of ash collection more than normal Air preheater tubes dirty some blockage ESP Inlte screen blocked off cause of draft issues ESP field 1 full ash sticks to hopper door and collection plates ESP field 2 similar to field 1 Field 3 and 4 light dusting on internal surfaces Baghouse bags were coated with ash and some sample was retreived 49
51 100% Biomass 450 C 2016/04/01 ********* Biomass 450C 3/31/ Start Plant on Natural Gas Overnight Warm up 4/1/2016 ********* Biomass 450 C Test Biomass 450 Barrels #1 = lbs #2 = 91.5 lbs Total (minus barrle tares)= 206 lbs Start Feeder 1 Start Feeder 3 Note: Furnace pressure surging every few min. Suspected pulsing feed or unstable flame Flue gas O2 drop associated with pressure surge event is fuel/combustion related Expect improvement as furnace gets hotter Start Feeder 2 Start Feeder 4 Cur natural gas to 20% CV Increase feed to 18 Hz Cut Natural Gas to 10% Increase Feed to 24 Hz Bio 300 Density (lightly packed/ milled) =23.45 lb/ft3 Bio 450 Density (lightly packed/milled)= lb/ft3 Feeding properties are different from the Biomass 300 Suspect due to density difference Higher Feeder speeds required to achieve feed rate Natural Gas still on waiting for feedrate stability Increase OFA to try and lower High CO values CO ppm much higher than Biomass 300 startup CO spiking due to pulsing flame Varialbe furnace temps as well Natural gas off Baghouse DP= 1.0" h2o Increase PA to 15 lb/hr each and observe O2/CO profile Increase OFA to 76 lb/hr No change in Combution stability Decrease PA to 13 lb/hr each Trying to Stabilize flame Visually flame looks better less pulsing Reduce PA to 12 lb/hr Return to 14 lb/hr on PA 76 lb/hr (20lb/hr higher) 30% excess air stoich 0.9 in flame zone and.4 in OFA 1048 max 90 lb/hr 1100 Reduce OFA back to 56 lb.hr and observe O2/CO profile 1106 OFA at 86 lb/hr seems best setting combustion still poor 1143 SOOT blow esp screenand air preheater (ID fan speed 51 47) 1300 SOOT blow esp screenand air preheater (ID fan speed hz) 1328 Baghouse DP 1.5" h2o 1423 SOOT blow esp screen and air preheater (53 51) 1427 Baghouse DP 1.75"h2o > pulse > 1.0" h20 ID fan speed hz 1508 SOOT blow esp screen and air preheater 1510 Pulse baghouse 1.25" >1.0" 50
52 1534 Soot blow esp screen and air preheater and pulse baghouse (1.5" >1.1") ID fan speed 53 >51 hz 1542 O2 Icrease, suspect high suction pressure downstream of ESP increasing any potential system leaks 1655 Soot blow and pulse BH 1711 Feed rate low due to lack of feeder head No more fuel 1720 Flame zone temp dropping due to low feed rate Increase feeder setting to max 1722 Flame zone temp still dropping 1725 Shut Down End of Test 4/2/2016 Plant Clean out/sampling and Imaging Notes: Ash is darker (more grey) suspect high carbon content due to poor combustion isses Air preheater similar blockage as Bio 300 ESP inlet screen similar blockage as Bio 300 Super heater and Reheater tubes thick grey coating Economizer also has thich ash coating All 4 ESP fields contain ash, much smaller baghouse sample compared to Biomass
53 Attachment II. Fuel Analytical Results 52


54 Table 12. Baseline Coal Fuel Analysis PRB Coal Spring Creek Mine. 53


55 Table 13. Baseline Coal Ash Analysis PRB Coal Spring Creek Mine. 54
56 Table 14. Biomass 300 C Fuel Analysis. 55


57 Table 15. Biomass 300 C Ash Analysis. 56
58 Table 16. Biomass 450 C Fuel Analysis. 57


59 Table 17. Biomass 450 C Ash Analysis. 58