Driving Efficiency with Interval Meter/Smart Meter Data. Mukesh Khattar, Energy Director, Oracle
|
|
|
- Wendy Stewart
- 5 years ago
- Views:
Transcription

1 Driving Efficiency with Interval Meter/Smart Meter Data Mukesh Khattar, Energy Director, Oracle SVLG Energy Summit, June 8, 2012
2 Oracle Hardware and Software, Engineered to Work Together Annual Revenues: $36+ Billions and growing Global Employees: 111,000+ and growing Global Real Estate and Facilities: ~19 M sq. ft ~50% owned
3 Managing Energy Use Energy use data quality and frequency determines ability to manage energy use Annual/quarterly/monthly reviews Actual vs. Budget => budget adjustments Monthly utility bills => too late to take meaningful actions Interval meter data => useful for timely response Smart meter data => real time availability of data leads to more sophisticated response
4 CA Energy Crises of 2000/2001 Insufficient power availability Rotating power outages Increased power costs A group of SVLG members under guidance of CEC Commissioner Art Rosenfeld conducted first Demand Curtailment test in summer of 2000 Blackout Busters 10 MW curtailed from 100 MW connected load CEC offered grant to automate curtailment in early 2001
5 Power Demand Oracle power curtailment Typical Weelky Load Profile


6 Demand Curtailment 2001 Pilot Test data Helps stabilize power grid so no one loses power Oracle HQ campus, CA
7 12:00 12:30 13:00 13:30 14:00 14:30 15:00 15:30 16:00 16:30 17:00 17:30 18:00 18:30 19:00 Demand, kw Summer 2001 Pilot Test Data Oracle HQ Demand Responsive Demand Reduction Test Day Comparative hot day Previous 10-days rolling average 6000 Time of Day
8 GWh California HQ Energy Use Trend < Calendar Year
9 GWh Energy Efficiency Gains 2001 savings driven from preparation for demand response 80 Base Year -10.5%
10 GWh Persistence of energy efficiency gains 80 Base Year -10.5% -9.3% -11.7% Calendar Year
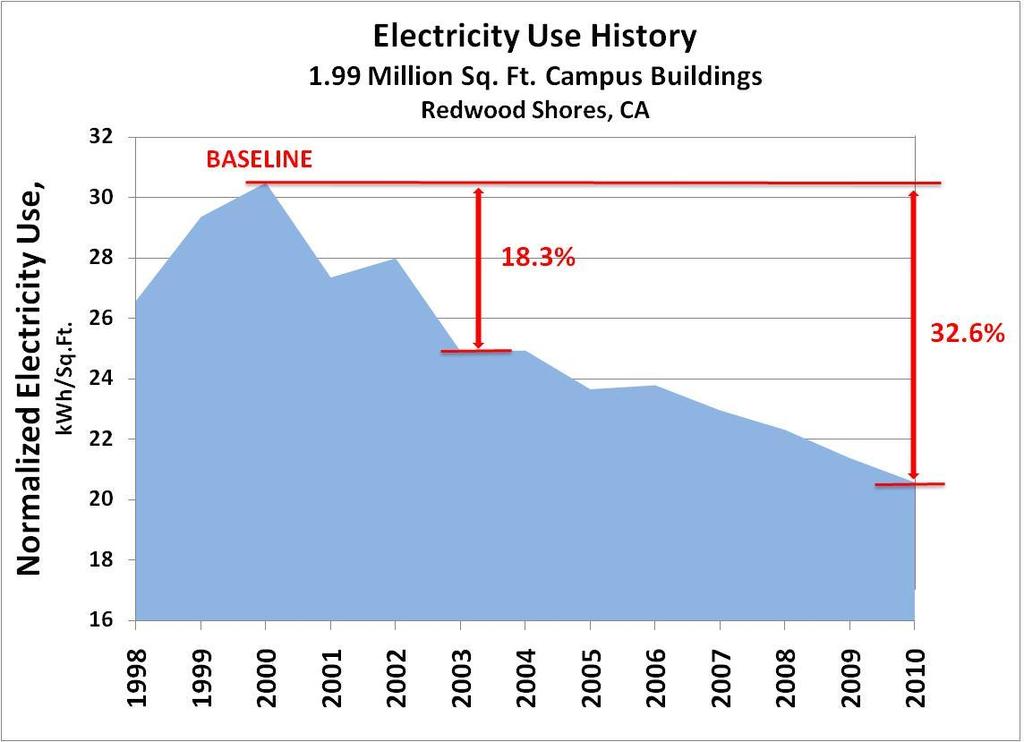
11

12 Natural Gas Use History 1.99 Million Sq. Ft. campus building Redwood Shores, CA
13 Return on Investment Very attractive Return on Investment The energy savings at HQ campus: Annual : ~20 Millions KWh; ~$2 Million Initial energy management focused investments: Demand curtailment preparation: ~$700k Net expenses after CEC grant: ~$250k Subsequent Investments: Leveraged with routine maintenance/upgrades Energy management is continued to be integrated with operations
 Electricity Interval Meter Load Profile 1200 Reston Building 2 1000 800 600 400 10/9/05 10/8/05 10/7/05 10/6/05 10/5/05 10/4/05 10/3/05 200 0 Time")
14 0:30 1:30 2:30 3:30 4:30 5:30 6:30 7:30 8:30 9:30 10:30 11:30 12:30 13:30 14:30 15:30 16:30 17:30 18:30 19:30 20:30 21:30 22:30 23:30 Power Demand, kw Load Profile Analysis (As found) Electricity Interval Meter Load Profile 1200 Reston Building /9/05 10/8/05 10/7/05 10/6/05 10/5/05 10/4/05 10/3/ Time of Day

15 BMS operational data: Reston Bldg 2 Floor 8 Nov 21, 2005 RA reaches set point in less than an hour Why is fan at 83% during unoccupied hours? SA reaches set point < an hour Why is cooling on during unoccupied hours? Unit starts at early Can be delayed until an hour before occupancy FRI SAT SUN Add 3 hours for PST MON
16 0:30 2:30 4:30 6:30 8:30 10:30 12:30 14:30 16:30 18:30 20:30 22:30 Load Profile Analysis (post changes) Energy savings from 122,610 to 94,310 kwh/week, 23% 1400 Reston 1900 Weekly kwh profile Mon Tue Wed Thu Fri Sat Sun 0
17 0:30 2:30 4:30 6:30 8:30 10:30 12:30 14:30 16:30 18:30 20:30 22:30 Load Profile Analysis (as found) Reston 1910 Weekly kwh profile Mon Tue Wed Thu Fri Sat Sun
18 0:30 2:30 4:30 6:30 8:30 10:30 12:30 14:30 16:30 18:30 20:30 22:30 Load Profile Analysis (post changes) Energy savings from 167,695 to 128,800 kwh/week, 24% Reston 1910 Weekly kwh profile Mon Tue Wed Thu Fri Sat Sun
19 Interval Meter Data Drives Start/stop timing adjustment Ventilation control review outdoor air; economizer; CO2 sensors Eliminate simultaneous cool and reheat VAV box adjustments Duct supply air static pressure reset Supply air temperature reset Chilled water temperature reset

 = 9.")
20 Energy savings from start/stop adjustments Case Study, Sydney, Australia Impressive Results: Savings in % (compared to week 2) = 12.66% Savings in % (compared to week 3) = 9.58%

21 More BMS Data Analysis VAV Box Observations Box Temp does not change appreciably over night Cool down is very fast, few minutes

22 More BMS data analysisvav Box Observations Box Airflow demand is low in the morning. Not much cool down required


23 kwh/day -16.4% -11.4% -16.0% -26.2% -26.1% -19.0% -14.2% -13.6% -5% -18.7% -16.2% -11.5% Energy Efficiency Gains Oracle UK Reston /2007 Savings: $ 143, Oracle India Jan Feb Mar Apr May Jun Jul Aug Sep Oct Nov Dec
24 Total Energy Consumption (kwh/sft) Interval/Smart Meter data can lean an energy efficient building to become even more efficient Total Energy Consumption Trend Elec+Natral Gas Electricity-Buildings Natural Gas 19 % %


25 Participation in Leadership Programs U.S. EPA Climate Leaders Program First software company to participate U.S. EPA Green Power Partnership Program Climate Savers Initiative Carbon Disclosure Project Silicon Valley Leadership Group OBMC Optional Binding Mandatory Curtailment CEC Demand Response