Understanding Global Warming
|
|
|
- Britton Collins
- 5 years ago
- Views:
Transcription
1 Math 483 Spring Semester, 2013 California State University, Northridge Understanding Global Warming
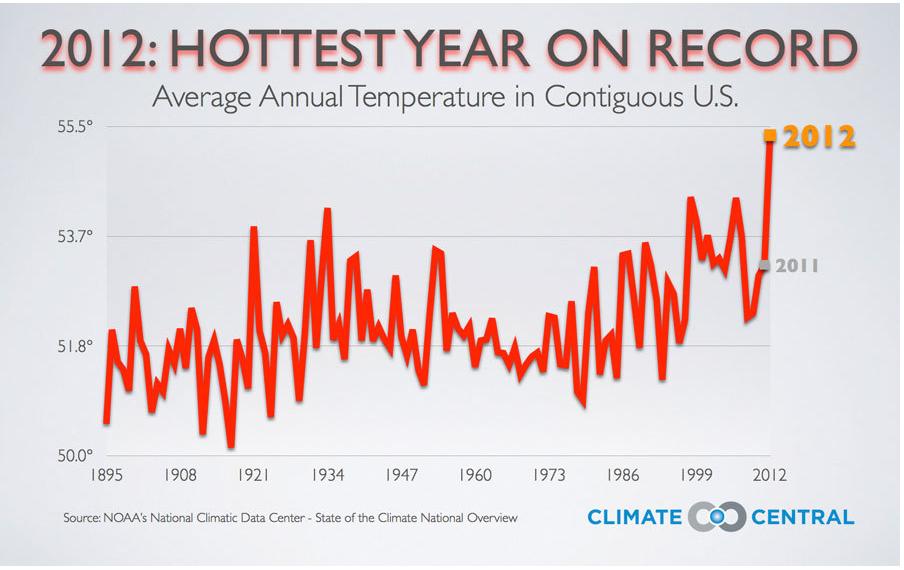
2 Global Warming is Real December 2012 is 334th consecutive Month with global temperatures above the 20th century average. Most recent decade hottest on record


3 Temperature Anomalies Relative to 20th Century Average
4

5 Disappearance of Arctic Sea Ice 2012, European Space Agency: 900 km 3 sea ice lost each year since Arctic sea ice could vanish in 10 years.

6 Disappearance of Arctic Sea Ice Arctic sea ice on 26 Aug Sea ice dipped to its smallest extent ever recorded in more than three decades of satellite measurements: Scientific Visualization Studio, NASA Goddard Space Flight Center

7 CO2 Concentration over Time Carbon dioxide concentration December 2012: 394 ppm
8 CO2 Concentration Keeling Curve
9 2007 Intergovernmental Panel on Climate Change (IPCC) (4,000 scientists from more than 150 countries) Warming of the climate system is unequivocal. Most of the observed increase in globally averaged temperatures since the mid-20th century is very likely (> 90%) due to the observed increase in anthropogenic (human) greenhouse gas concentrations. Global atmospheric concentrations of carbon dioxide, methane, and nitrous oxide have increased markedly as a result of human activities since 1750 and now far exceed pre-industrial values over the past 650,000 years

10 IPCC Climate Models Global and continental evolution of the temperature since 1900, based on measurements (bold line) and ensemble simulations with coupled climate models (bands). Only simulations with a complete forcing which includes changes in greenhouse gases, aerosols, observed volcanic eruptions and variable solar radiation, show reasonable agreement with the observations over the entire 20th century. In case the effect of anthropogenic forcings (greenhouse gases, aerosols) on the radiative balance is not taken into account, the global increase in temperature cannot be simulated. (Figure from IPCC 2007, Summary for Policymakers,
11 U.S. Climate Change Science Program (2008) Warming exceeds IPCC estimates. The Antarctic and Greenland ice sheets are losing 48 cubic miles of ice a year.
12 MIT and Penn State Study, 2012 Worldwide Average Temperature increase of 9 degrees Fahrenheit by 2100 Arctic will warm three times as fast as IPCC study found, along with greater ocean warming, sea level rise, and extreme weather events Nature article by group of 22 scientists, 2012 Warns that Earth may be near tipping point, pushing planet to calamitous and irreversible changes
13 UCLA Center for Climate Change Solutions 2012 Study aided by supercomputer more precise than previous climate models for the region. Roughly 1 quintillion calculations over a period of six months to assess aspects of 25 global warming models applicable to Southern California. Findings: By mid-century, the number of days with temperatures above 95 degrees each year will triple in downtown L.A., and quadruple in portions of the San Fernando Valley. The hottest of those days will break records. National Research Council, Ca, Or, Wa Study 2012 Study, commissioned by federal agencies and 3 states predicts 5 1/2 feet sea level rise in California by 2100.
14 U.S. Global Change Research Program Draft National Climate Assessment (2013) U.S. average temperature has increased by about 1.5 F since 1895; more than 80% of this increase has occurred since The most recent decade was the nation s hottest on record. U.S. temperatures will continue to rise, with the next few decades projected to see another 2 F to 4 F of warming in most areas. The amount of warming by the end of the century is projected to correspond closely to the cumulative global emissions of greenhouse gases up to that time: roughly 3 F to 5 F under a lower emissions scenario involving substantial reductions in emissions after 2050, and 5 F to 10 F for a higher emissions scenario assuming continued increases in emissions.
15 Corporate Responses Reuters reports (Jan 9, 2013): [...] the U.S. Energy Information Administration said on Tuesday that the country's crude oil production will rise by the largest amount on record in 2013, and is set to soar by a quarter over two years. BBC reports (Jan 9, 2013): US oil production will jump by a quarter by 2014 to its highest level in 26 years, figures suggest. Seth Kleinman, global head of energy strategy at Citigroup, told the that the rise was due "entirely because of the application of fracking" which is releasing significant new resources into the market.

16 The Climate System is Complicated...

17 ...But the key ingredient to Global Warming is the greenhouse effect

18 Visible Spectrum Low Frequency High Frequency R o y G B i v

19 Electromagnetic Spectrum Infrared Ultraviolet

20 Radiation and Matter

21 Albedo is the ratio of reflected sunlight to incident sunlight.

. sea ice pack is largely determin.")
22 Earth s Planetary Albedo 0.3 The albedo of snow-covered ice is close to 1 Figure 6. White, ice-covered polarof regions are important for r (larger than 0.8); the albedo sea water is radiation during summer, whereas sea water absorb close to zero (less of than reflectance, or albedo, the0.1). sea ice pack is largely determin. those shown on the right in the Arctic in June 2007
23 What happens to the 70% of solar radiation that is not reflected back into space?


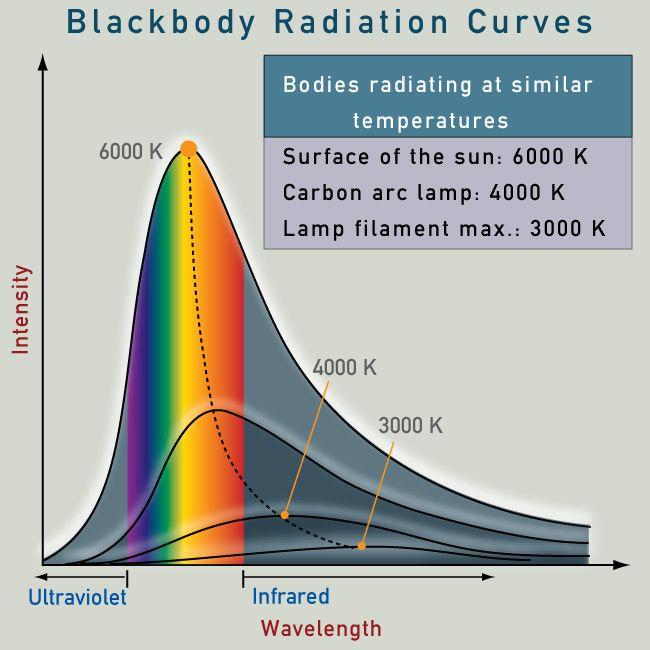
24 Heat and Light The temperature of an object determines the frequency of radiation it emits.
25

26 How does a green house work?


27 Green house gases and radiation CO2 H2O Molecular structure and quantum mechanical properties determine which frequencies can be absorbed. Green house gases absorb infrared light.

28 Absorption Bands of Atmospheric gases

29 Light from the Sun Photosphere: ~ 6000 K
30 Some Vocabulary Energy: 1 Joule = 0.74 foot-pounds Power: 1 Watt = 1 Joule/second Power from Sun (top of atm) 1370 W/m 2 Average power Earth surface: 240 W/m 2 (approx 1000 W/m 2 at noon)

31 Sun vs Earth

32 Radiation Spectrum: Sun vs Earth

33 Radiative Power: Sun vs Earth

34 Green House Effect

35 Current level of radiative forcing (IPCC) is 1.6 watts per square meter (with a range of uncertainty from 0.6 to 2.4). Taking into account total land area of the Earth, this gives a total warming effect of about 800 terawatts more than 50 times the world s average rate of energy consumption, which is currently about 15 terawatts.


36 Want to learn more? CSUN, with support from NASA, is developing a new program and courses for the study of climate science.