Status - Indian Electrical Industry April to March
|
|
|
- Neal Hall
- 5 years ago
- Views:
Transcription

1 Status - Indian Electrical Industry April to March


2 Source: CEA & MNRE 112% achievement with Thermal power achieving 127% addition on planned Generation 60% achievement with power achieving 104% addition on planned Generation 13 th Plan Capacity Addition NIL addition of Thermal Power as 50,025 MW projects are already under construction Gas 4340MW; Hydro-15300MW, Nuclear-2800MW Solar 81,237 MW Wind MW Other RES 5,055 MW


3 Transmission Addition in CKM during 12 th Plan Up to March 2017 Source: CEA Sub-station Addition in MVA/ MW during 12 th Plan Up to March % 31% 400 KV Transmission & Sub-Station completion is over achieved in 12 th Plan; 765kV also achieved >95%. HVDC & 765 KV will be the key focus area in the 13 th plan period up to 2019 Draft 13 th plan published; however, to be finalized after adding Intra-state additions ource: CEA, MNRE

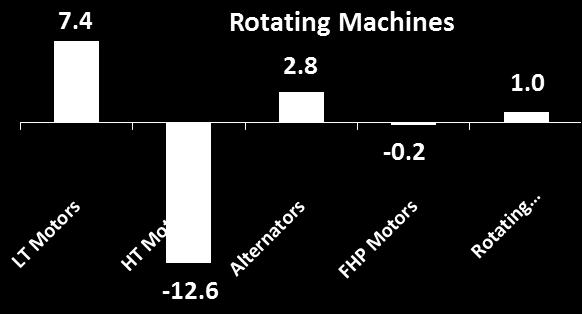
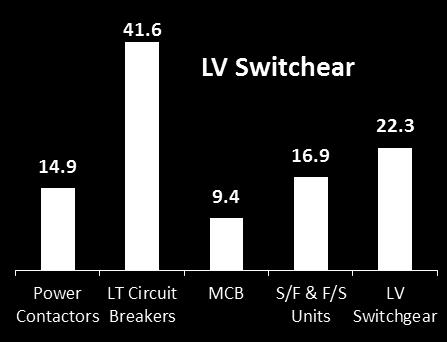
4 Growth Index for Electrical Equipment industry for the period Overall Growth Index 64% 31% Marginal growth in motors, declining trend for HT motors due to core sector industry capex not taking off Decline in Dist. Trf. REC range & Meters due to delay in DDUGJY & IPDs implementation Growth for Power TRF, LV and MV_HV SWGR Cable, TLT register moderate growth; decline in Conductors Exports playing major role in overall growth


5 Sector wise break up of weightages Sector wise break-up of Growth Index 64%
 0.7 11.")
 5.1 3.5 1. Conductors declining consistently in all Qtrs 2.")
6 Sector wise break-up of % Quarterly Growth Index Cum growth Till Mar (-) In Q4 HV Swgr shown high growth, MV Swgr shown moderate growth 4.7 (-) Conductors declining consistently in all Qtrs 2. TLT declined in Q4 due to low off-take 3. Insulator sales picked up in Q4


7 Sector wise break-up of % Quarterly Growth Index Decline in DTs in all Qs due to delay in order finalizations thru various schemes; Pick-up in Power Trf. & Cables Cum growth Till Mar (-) (-) 4.0 (-) 13.9 Meters & Capacitors declining due to less domestic & export orders; RM maintain sustain growth
8 Trend of Imports & Exports ITC codes Product Groups Source: DGCI&S, MoC, GOI Apr-Feb % Growth over Domestic Import Export Import Export Industry Size for Rs. Crs Domestic Growth % Value in Rs. Crores 8501 excl & 20 Motors & AC Generators (-) 9.7 (-) Power TRF , Distribution TRF (-) 40 (-) (-) Capacitors (-) , % HV SWGR incl. Panels , LT Switchgears incl Panels /49/60 Cables - LV & HV (-) , 20, 90 Insulators 31% Energy Meters (-) Tr. Line Towers (-) & 7614 Conductors (-) (-) 5.1 High Imports (Main Country) HV Custom Built products (Korea), Insulator (China), Power Cap (USA), Power Trf. HVDC(UK), AC motors > 75 KW (China), AC Generators > 750 KVA (China)
9 Raw Material Price Trend for past 3 years to Consistent growth in AL & CU price in last 6 months of about 20% CRGO prices now stabilized & showing rising trend in Q4 Growth in Steel prices due to MIP support
10 Raw Material Price Trend for past 3 years to USD Exchange rate declined in Q4; however remained above 67 levels during the year Decline in Labour Index in last 9 months indicate inflation under check Growth in Fuel & Power WPI by 12% in FY16-17 due to increase in prices of petroleum products & Coking Coal
11 Important discussion points in IEEMA Divisions Dist Trf Poor visibility of demand beyond 2019 due to introduction of solar pumps in rural electrification RM Serious concern due to increase in Imports; Recommending mandatory IS:12615 Cable Impractical & Unacceptable tender conditions in some utilities MV_HV Swgr Need for workshop with Utilities, DHI & MoP for model terms & conditions & promoting Make in India and CEA Advisory on domestically funded projects; exploring use of technology evolutions and engaging with R&D institutions for the same; LV Switchgear - voltage for DC applications in Rural areas was agreed for 48V DC for DC applications in remotely located rural areas. Standard approved by ETD50 under printing Capacitor -explore the genesis of penalty imposed on harmonics at TNEB and MSEDCL Power Trf Vendor development for world class quality and explore medium term status of demand drivers EIM EU exports declining; Defense sector demand picking up Renewables- 90% of Solar Capacity installed is thru Imports of equipment s from China. Power Generation- Thermal business are going down drastically with no point of returning normal anytime soon. Common Point Review of Test gaps with CPRI and ERDA + high testing charges particularly at CPRI Thank you!