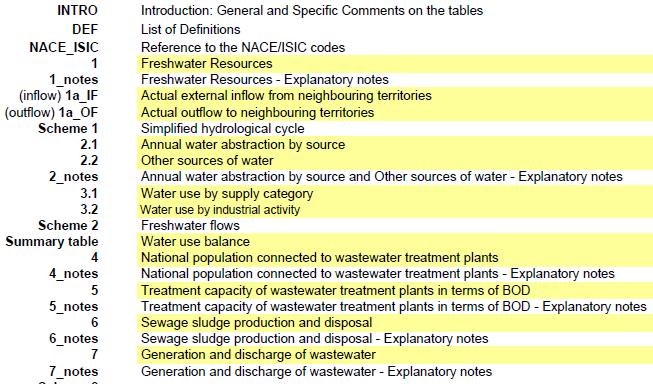
Table 6: Sewage sludge production and disposal
|
|
|
- Leonard O’Brien’
- 5 years ago
- Views:
Transcription

 Training course on Water Statistics Vienna,")
1 Table 6: Sewage sludge production and disposal B.FRIBOURG-BLANC, OIEau With support of: G.WINDHOFER, UBA Training course on Water Statistics Vienna, 4-6 June 2012
2 slide 2
3 Table 6: Sewage sludge production and disposal SOURCES SOURCES POINT SOURCES: POINT SOURCES: Agriculture Agriculture Industrial Activities Industrial Activities Mining and Quarrying - Mining and Qarrying Manufacturing Industry - Manufacturing Industry Prod./Distr. Electricity - Prod./Distr. Electricity - Construction Construction Domestic Sector (37) Domestic Sector Services - Services - Private Private Households households NON-POINT SOURCES: Run-off Rainwater - Runoff Rainwater Agriculture - Agriculture Atmospheric Deposition - Athmospheric Deposition I D N COLLECTING SYSTEMS TREATMENTS DISCHARGES COLLECTING SYSTEMS TREATMENTS RECEIVING WATERS B.1 I.1 A.1 D.1 Independent Wastewater Independent Waste Collecting water System (42) Collecting System (42) Other WWTP (43) I.0 Other WWTP C.2 (43) Urban Wastewater C C.1 UWWTP (35) and Collecting System Urban (44) Wastewater UWWTP Collecting Systems C (35) (44) T A.2.2 Independent Treatment (45) Independent Treatment (45) Rainwater runoff from paved area, D.0 A.2.1 infiltration and drainage into collecting N.1 Rainwater run-off from paved area, system infiltration and drainage into collecting system SLUDGES SLUDGES (49) B.2.2 I.3 } B.2.1 B.2 I.2 D.2 N.3 D D.1 U.2 U U.1 C.3 C.1 D.3 D.2 N.2 Drainage from soils, direct transfers, etc. Drainage from soils, direct transfers, etc. } A.2 I N L A N D W A T E R S I N L A N D W A S T E E A R S / S E A Output of Treatments : Water + sludges slide 3


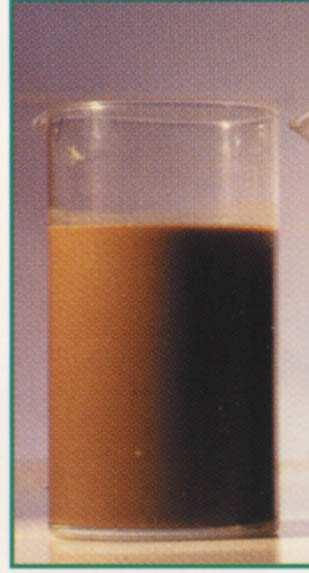
4 Table 6: Sewage sludge: how does it look like? slide 4

5 Table 6: Sewage sludge from liquid to solid SLUDGE CONSISTENCY L I Q U I D shovelable P A heapable S T E S O L I D slide 5 % dryness
6 Table 6: Sewage sludge production Depending on final destination, 2 main constraints ASSOCIATION OF UNHAPPY RESIDENTS REDUCE SLUDGE VOLUME H2S LIMIT ODOURS slide 6 Before After


7 Table 6: Sewage sludge production, reduce volume Static thickening Belt filter Flottation Pressure filter slide 7


8 Table 6: Sewage sludge production, limit odours Biological stabilisation: * aerobic/anaerobic digestion * composting * Chemical stabilisation: lime addition slide 8


9 Table 6: Sewage sludge disposal Agriculture Compost Landfill Dumping at sea Incineration Others slide 9
10 Table 6: Sewage sludge: main issues slide 10 URBAN WASTEWATER TREATMENT (35) Total sludge production Total sludge disposal of which: Agricultural use (b) Compost and other applications (c) Landfill (d) Dumping at sea (e) Incineration (f) Others, please specify OTHER WASTEWATER TREATMENT (43) Total sludge production Total sludge disposal of which: Agricultural use (b) Compost and other applications (c) Landfill (d) Dumping at sea (e) Incineration (f) Others, please specify Single unit: 10 6 kg DS Three types of treatment Sludge Production Three types of treatment Sludge disposal Agricultural use INDEPENDENT TREATMENT (45). Total sludge production Compost and other applications Landfill Dumping at sea Incineration Others For EU countries: dumping at sea is forbidden since 1998
11 JQ Table 6: Decision tree Data available on national level Data available on regional/provincial level Data available on operational level slide 11 Estimation methods / Tailormade questionnaires
12 JQ Table 6: Data availability Data on sewage sludge might be available from: national level: NSI units for waste, agriculture, soil reporting obligations: Directive on Urban waste water treatment (91/271/EEC) Directive on Sewage Sludge (86/278/EEC) water associations (national, regional) provincial governments operators of WWTPs or waste treatment plants slide 12
13 JQ Table 6: Overview of best practices Quality check of data available on institutional level on institutional and operational level Best practices at administration level Methods of direct / indirect measurement Methods of estimation Best practices at operators level slide 13
14 JQ Table 6: Quality check of data available Quality check on institutional level: ranking of amounts of sewage sludge according to disposal routes check with data reported under different Directives Quality check on institutional and operational level: comparing measured data with estimation coefficients mass balances for carbon, nitrogen and phosphorus slide 14
15 JQ Table 6: Best practices at administration level Methods of direct and indirect measurement Circulation of a questionnaire (owners / operators of WWTPs) - data related to sludge disposal for each disposal route - type of waste water treatment, sludge stabilisation, de-watering - actual occupation (P.E. or BOD) - most accurate measurement in the transfer process to sludge disposer - industrial sewage sludge: few economic sectors account for large share of industrial sewage sludge Stratified sample survey - French example: 5,000 municipalities sampled out of 36,000 - covers almost all large municipialities and only 5% of small ones slide 15
16 JQ Table 6: Best practices at administration level Methods of estimation I Estimation coefficients for amounts (D.S.) of sewage sludge produced Most often based on actual occupation (P.E.) of WWTP Actual occupation not known: estimation based on population connected or design capacity Influences on amount of sludge production: - P-removal kg D.S. / P.E./ a sewage sludge from treatment plants with without Ca - addition with Ca - addition Complete stabilisation*, without P-precipitation Complete stabilisation*, with P-precipitation Simultaneous aerobic stabilisation without P-precipitation Simultaneous aerobic stabilisation with P-precipitation sludge stabilisation - sludge conditioning (Ca) *complete stabilisation: all methods of anaerobic sludge stabilisation and separate aerobic stabilisation slide 16
17 JQ Table 6: Best practices at administration level Methods of estimation II No data concerning WWT available: [sludge production/ person/ year] x [population in a country] Estimation coefficients for volumes (m³) of sewage sludge produced If data concerning the amount of sewage sludge is available: De - watering technique D.S.(%) Drying beds* 30 Static thickening 2-7 Mechanical excess sludge thickening 6 10 Lagoons 24 Belt filter press Centrifuges Pressure filter (e.g. chamber filter press) with polymer or metal salt conditioning without lime/aggregate with lime/aggregate Full-drying slide 17
18 JQ Table 6: Best practices at operators level Liquid sludge: Flow measurement Recording volume of sludge through use of sampling points Flow rate: IDM-methods Dry solid: EN 12880:2000 De-watered sludge: Tanker movement / weight Weight bridges installed: wet weight of sludge + EN 12880:2000 No weight bridges installed: known volumes tanker + EN 12880:2000 Sludge coefficients on the basis of waste water treatment category and / or de-watering technique slide 18
19 Thanks for your attention B.FRIBOURG-BLANC, OIEau Training course on Water Statistics Vienna, 4-6 June 2012