Storm Surge Risk Modeling and Coastal Engineering Adaptations in a Changing Climate
|
|
|
- Chrystal Marshall
- 5 years ago
- Views:
Transcription


1 CAPE COASTAL CONFERENCE Linking Science with Local Solutions and Decision-Making Storm Surge Risk Modeling and Coastal Engineering Adaptations in a Changing Climate Kirk F. Bosma, P.E. kbosma@woodsholegroup.com

2 Outline 1. Combined Sea Level Rise and Storm Surge Risk 2. Preparedness Planning 3. Vulnerability Assessment 4. Engineering Adaptation Options and Examples Photo by John Minchilo, AP

 to 6.")
3 Background on Sea Level Rise Sea Level Rise (SLR) Thermal expansion of ocean water Increased input of water from landbased sources Northeast SLR is higher than global average Photo by Andrew Burton, Getty Images 1.75 mm/yr (Maine) to 6.05 mm/yr (Virginia) Changes in Ocean Circulation (Yin et al., 2009)
 Relative => SLR and local land movement (local tide")
4 Background on Sea Level Rise Eustatic versus Relative SLR Eustatic => Increase in Ocean Volume (SLR) Relative => SLR and local land movement (local tide gauges)
5 Wide Range of Projections Pfeffer et al. Average of: Vermeer & Rahmstorf Horton et al. Jevrejeva et al. Grinsted et al. IPCC 95% CI (NOAA, 2012)
 4.0 5.0 2050 6.")

6 Importance of Storms MHHW yr Storm 100 yr Storm NAVD88 (ft)


7 Sandy in Boston If peaks were simultaneous 9.4 feet Sandy 7.4 feet 3.3 yr event $50 billion damages in NYC


8 Climate Change Preparedness 1. Vulnerability Assessment Assess current vulnerabilities Project future conditions Evaluate processes and flood pathways Analyze system sensitivity and resiliency Small Change -> large system response System is prepared to accommodate 2. Develop Preparedness Plan over Time and Scale Managing risk in the face of uncertainty Multiple scales: National down to individual buildings Times to re-act: Actions now and into the future Balance of robustness and flexibility Identify adaptation options based on risk tolerance 1. No Action 2. Accommodate ( Living with water ) 3. Protect ( Keep water out ) 4. Retreat Range of adaptation options
9 SLR Planning Process (courtesy of Simm, 2010)

10 Vulnerability and Adaptations Post Katrina forensic studies Louisiana FIRM appeals Coastal Emergency Risks Assessment (ASGS operation) Combined SLR and surge risk for EPA s National Coastal Property Model Groton and Groton Long Pt, CT East Boston and Long and Central Wharves, MA Shinnecock Nation, Long Island Boston Harbor Association - Preparing for the Rising Tide MassDOT-FHWA Boston Central Artery Pilot Project
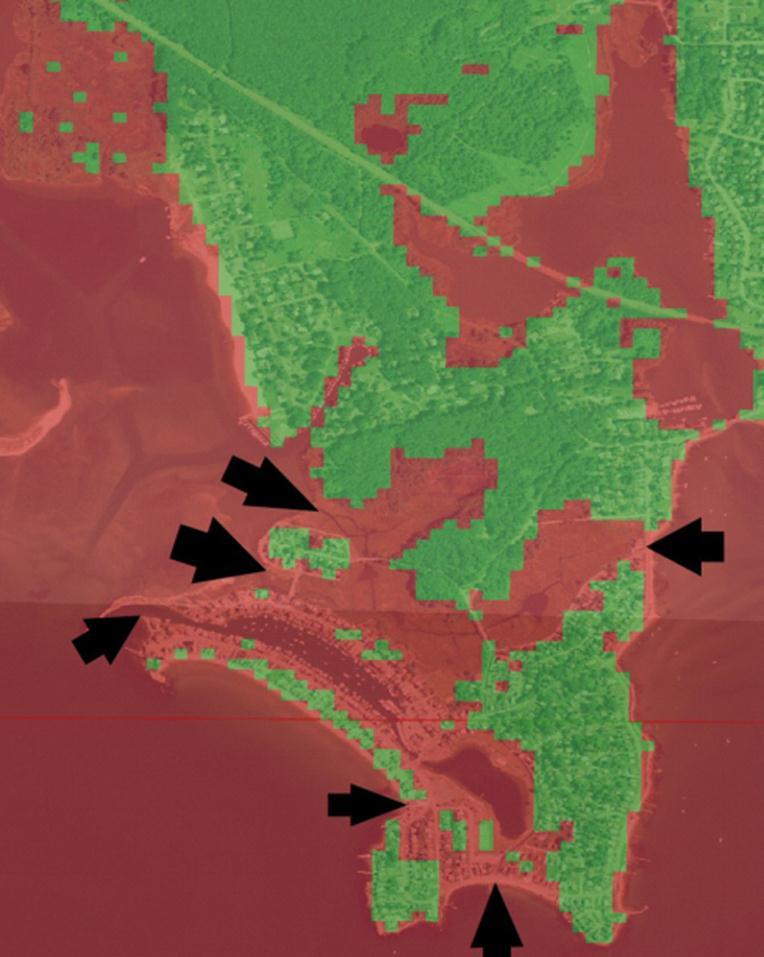
 Inundation maps based on")
")
 Present and future climate scenarios simulations Develop water level cumulative")
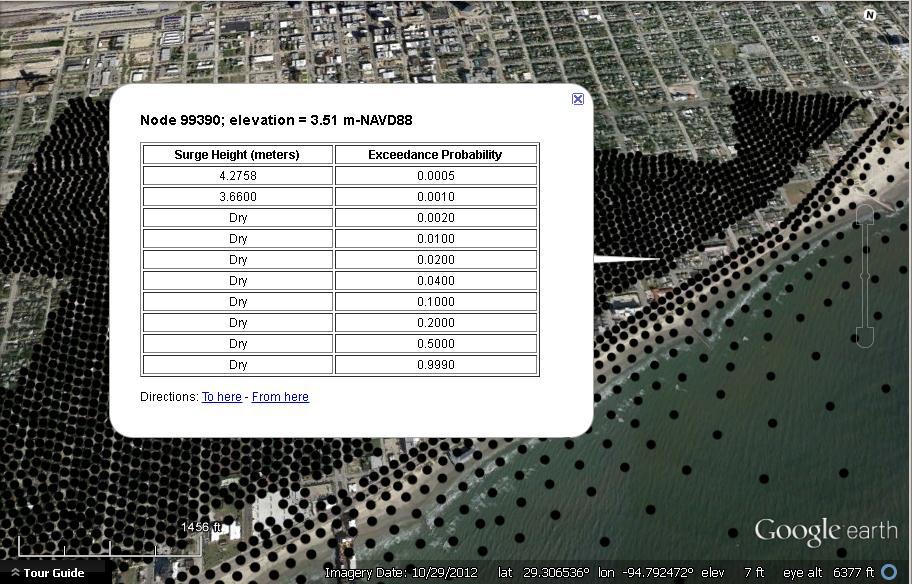
11 Vulnerability Assessment Includes all relevant physical processes (tides, storm surge, wind, waves, wave setup, river discharge, sea level rise) Inundation maps based on standard bathtub model do not reflect dynamic nature of coastal flooding (e.g., bathymetry, coastal geometry, infrastructure, frictional effects, and processes) FEMA is only backward looking A large statistically robust set of storms (Emanuel, et al., 2006) Present and future climate scenarios simulations Develop water level cumulative distribution functions

12 Storm Surge Modeling

13 Storm Surge Modeling

14 Storm Surge Modeling Contemporary, Consistent, Accurate, Elevation Data

15 Storm Surge Modeling Contemporary, Consistent, Accurate, Elevation Data

16 Storm Surge Modeling Lidar Contemporary, SuperOverlays Consistent, Accurate, Elevation Data

17 Storm Surge Modeling Contemporary, Consistent, Accurate, Elevation Data

18 Storm Surge Modeling

19 Storm Surge Simulations

20 Storm Surge Simulations

21 Storm Surge Simulations

22 Storm Surge Modeling
 Hard Engineering Alternatives (Protect) Managed Retreat (Retreat) Evacuation Planning (Accommodate) Co-Benefit")
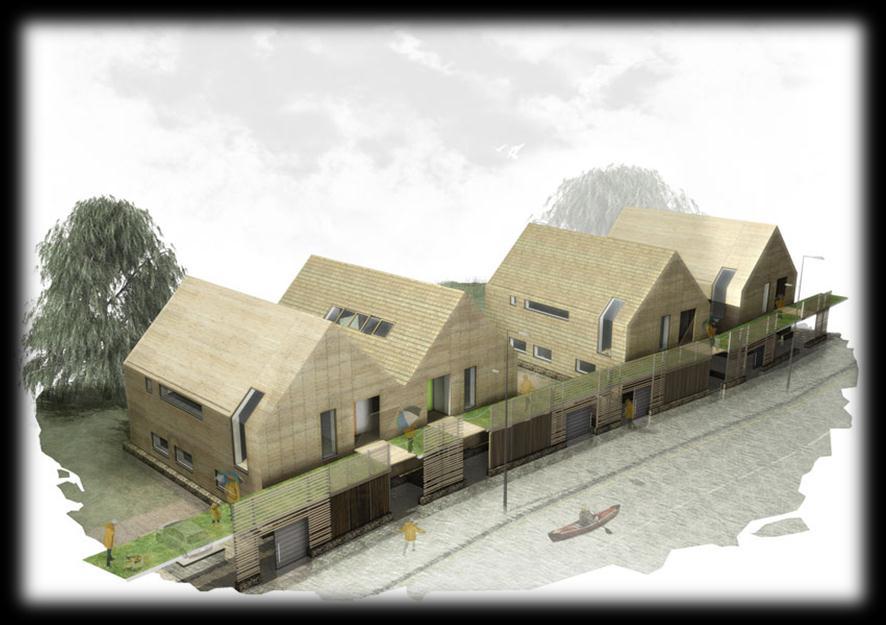
23 Types of Engineering Adaptations Strongly consider modular and/or phases approaches Facility Improvements/Upgrades (Accommodate) Floating Developments Elevated Developments Floodable Developments Soft Engineering Solutions (Protect) Hard Engineering Alternatives (Protect) Managed Retreat (Retreat) Evacuation Planning (Accommodate) Co-Benefit Solutions
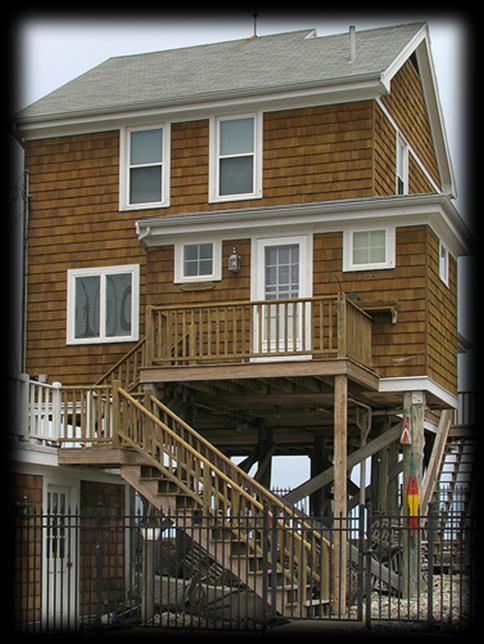
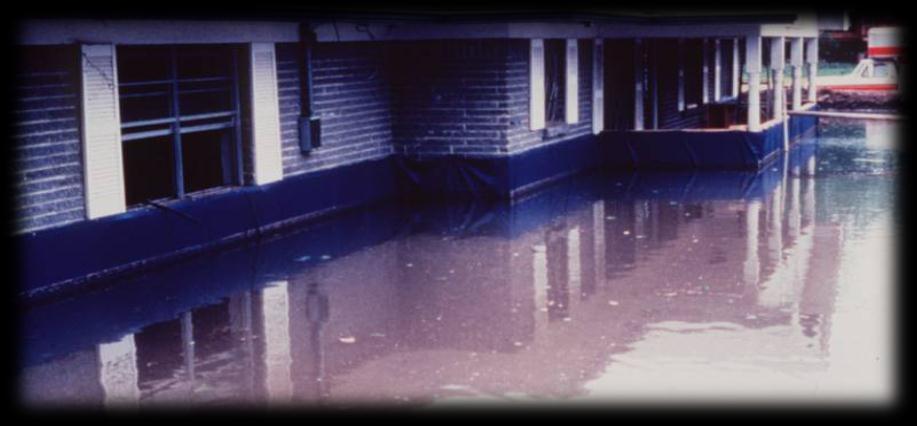
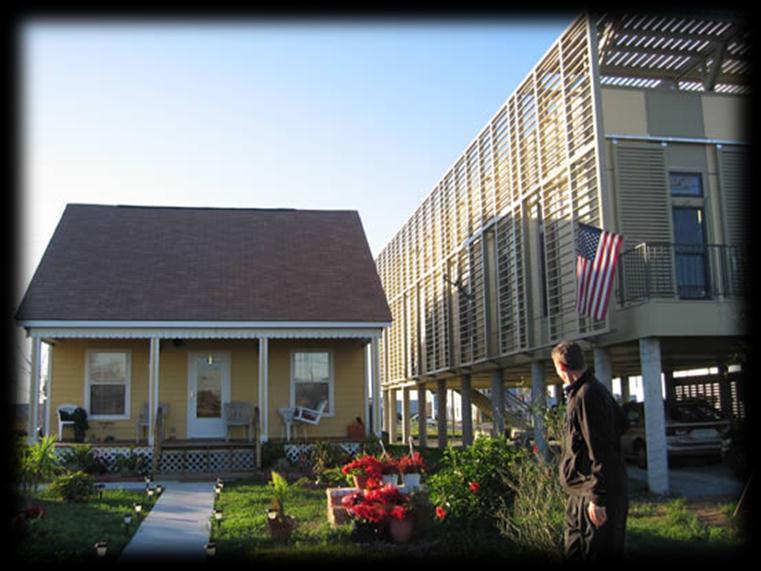
24 Facility Improvements
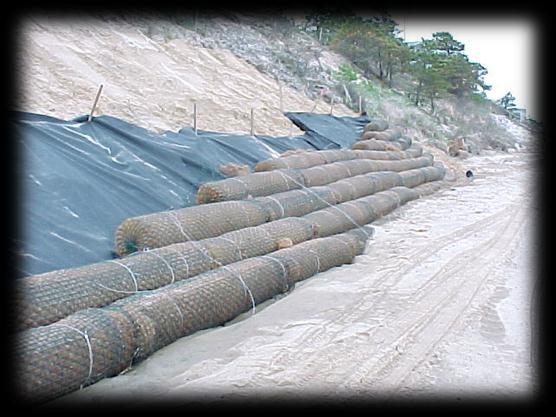


25 Soft Engineering Solutions


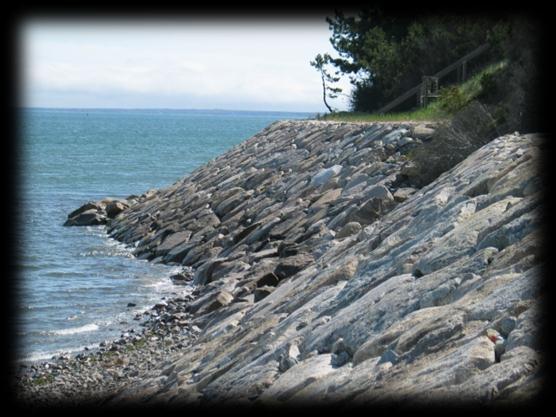
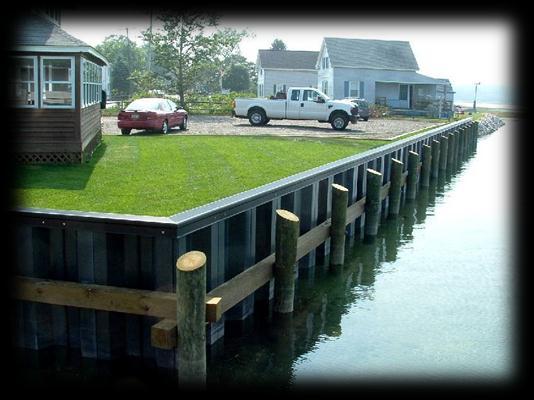
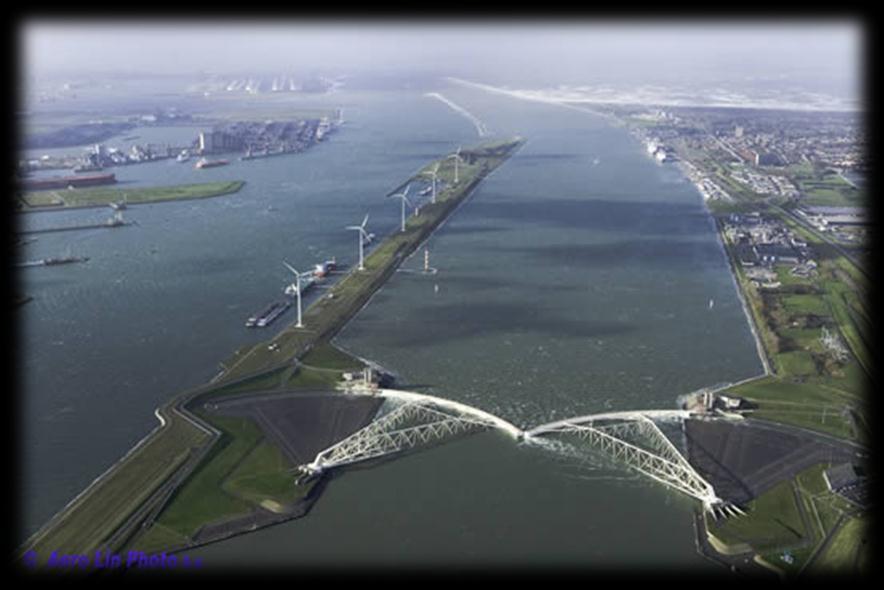
26 Hard Engineering Solutions

27 Examples Groton, CT

28 Examples Groton, CT

29 Inundation Maps


30 Examples South Boston Sometimes regional problems can be solved by minor projects


31 Mean Higher High Water (MHHW) Timeline Annual (1-year) Storm Surge Timeline 100-year Storm Surge Timeline Examples South Boston Approximate Maximum Water Surface Elevation (ft, NAVD88) Upland Flooding Potential Recommended Engineering Adaptations Estimated Adaptation Cost* Upland Flooding Potential Recommended Engineering Adaptations Estimated Adaptation Cost* No Flooding Expected Flooding of Morrissey Blvd. approximately 1/4 mile south of campus entrance. No Action Required N/A Poor Drainage of Bayside Expo Parking areas during heavy rainfall events. No Flooding of areas from Dorchester Bay waters. Minor flood proofing of structures Installation of a pump house and pumped based-drainage system for parking area + Capital Cost: $ 2.0 Million Annual Maintenance Costs: $ 10, No flooding of campus entrance or campus facilities Flooding of campus entrance. Initially from Patten's Cove (tidal pond to the west of entrance), and subsequently from Savin Hill Cove. Tidal control structure installation at entrance to Patten's Cove. Soft solution (beach nourishment and vegetation enhancement) along Savin Hill Cove. Capital Cost: $ ,000 Annual Maintenance Costs: $10,000 Flooding of Bayside Expo areas from Dorchester Bay. Water overtops harbor walk in places. Modular seawall installation at critical locations along Harbor walk Seawall extension along Harbor walk as needed Capital Cost # : $ million ( 1,000 foot length) Annual Maintenance Costs: $15, Widespread flooding of UMASS Boston Campus, Morrisey Blvd. and surrounding areas In addition to adaptations above, additional flood proofing and elevation of critical infrastructure. Evacuate during storm event and return. Capital Cost: $20 per square foot of building for wet flood proofing Widespread flooding of UMASS Boston Campus, Morrisey Blvd. and surrounding areas In addition to adaptations above, additional flood proofing and elevation of critical infrastructure. Evacuate during storm event and return. Capital Cost: $20 per square foot of building for wet flood proofing 16.0

32 What are coastal communities doing? Deer Island Treatment Plant Spaulding Rehabilitation Hospital Groton and Groton Point, CT Seattle, WA and Charleston, SC Central Artery, MA Cambridge, MA Thames River, England
33 What can coastal communities do? What should communities be doing? Determine regional and site-specific flooding risk through assessment of physical processes Identify elevations of flood-prone building and infrastructure Identify property specific vulnerabilities to flooding Develop cost-effective measures to increase resilience Pursue integrated strategy to maximize adaptations (co-benefit solutions) How? Vulnerability Assessments, Preparedness Plans, Adaptation Strategies Integrate with ongoing Hazard Mitigations Studies and Projects Community willingness, but lack of financial resources

34 Conclusions Climate change related coastal flooding is a reality, and predicted to increase Climate change preparedness plans involve multiple activities from building-specific through regional scales Preparing for increased coastal flooding involves implementing phased plans and integrated into maintenance plans to lower cost over time Preparing for the climate of the future will require coordinated efforts among all sectors of individual communities