Design for Naturally Completed and Stimulated Wells
|
|
|
- Andrew Harvey
- 5 years ago
- Views:
Transcription
1 MENAPS More than just Penetration: Perforation Design for Naturally Completed and Stimulated Wells John Hardesty, PE Principal Research Engineer, GEODynamics, Inc.
2 Outline Introduction Perforation Performance Evaluation Implications of Extrapolating from a Single Data Point Perforation Geometry DP Perforation Geometry and Implications BH Perforation Geometry and Implications Design and Field Applications Natural Completions: Berea Sandstone Overbalanced Sand Control: Castlegate Sandstone Acidizing: Austin Chalk Pre Frac: Mancos Shale Conclusion 2
3 API Section I: Unstressed Concrete The API Section I Test is conducted by firing a representative gun section from the center of a poured cement target. This test can be registered with the API The targets and charges are aged 28 days prior to performing the test for registered data. 3


4 API Section I Test The target must meet minimum specifications of construction, composition, and compressive strength. After the shot, the targets are split, and data collected on: Hole Size Penetration Depth Debris Burr Height of Casing 4
5 API Section I Test Considerations The test was originally designed to examine: Interference Charge Quality Hole Size It has evolved to be the prime measurement of charge penetration performance as well. It is difficult to predict the down hole performance of a charge from its performance in an API Section I test. Performance increases in this test may not translate to performance increase in certain rock. 5
6 Reversed Charge Performance Figure from SPE 27424, Ott, R.E. et al., Simple Method Predicts Downhole Shaped-Charge Gun Performance. Nov 1994
7 Other Implications -Examples Increased penetration in cement does not mean increased penetration in most other targets 2X performance in cement translates to 90% performance in rock in comparative study Single point data can not predict design dependent extrapolation Dual String, or Triple String, or even Heavy Wall Casing Secondary characteristics not captured Big Hole debris interaction with tapered cement tunnel Cement QC Performance vs Rock Performance Periodic test during manufacturing is primary control of product produced 7
8 Perforation Performance Evaluation 8
9 Perforation Performance Evaluation Single Shot Flow Cell Not Perfect Simulation Does not represent near wellbore damage Does not represent near wellbore stress state Does not show perforation interaction Improvement or reduction in performance does not necessarily mean same in field Still a very useful tool. 9
10 The Industry is Making Progress! API RP 19B Section 4 Revised and Approved Highlights sources of Experimental Error Adds new ways to analyze results Enables more uniform testing between companies API RP 19B Section 2: Under Revision Wide Involvement Draft Standard: New Performance Metric New Registered and Witnessed Test Still Concentrating on Penetration Only No Analysis Currently Evaluating necessary Equipment Specifications 10
11 Perforation Geometry DP Charges 11
12 Permeability Map, Conventional Tunnel 12
13 Permeability Map, Reactive Tunnel 13
14 Perforation Geometry DP Charges 15g HMX Conventional API RP 19B 35.1 Berea Sandstone md 19% porosity 7000 psi UCS Typical Penetration: 8-9 inches 14


15 Perforation Performance Evaluation 22.7 g Charge API Cement Borehole 10 Damage Radius Perforations Far Field Assumed Open 15

 Critical for")
16 Perforation and Well Geometry Perforations Near WB Interaction of perforation geometry with near wellbore geometry Improved perforation may not improve some wells (too much or too little damage) Critical for others 16
17 Perforation Geometry DP Charges Other Considerations Dual String Plugging in second string Gun plugging which alters dynamic surge Heterogeneous Formation: Plugging in the hard layers Where does the fluid enter (acid) or exit the formation? Other Lithology Carbonate: Shorter tunnels. Narrower Tunnels. More Opportunity for plugging. Shale: In some cases much shorter than expected. Open tunnel a primary function of charge design, and not of perforating balance. 17
18 Perforation Geometry BH Charges Back to the Section 1 Test Maximize Area Open to Flow (Square Inches/Foot) in Standard Casing Only Standard Casing is L-80 Grade, and thinner than most modern applications Extrapolation is used by software to predict down hole performance. 18
19 Perforation Geometry BH Charges Translation to Heavy Wall Casing is Design Dependent In one instance heavy wall performance exceeds that in thin wall casing Design For Heavy Wall Casing Publish performance in both standard casing and heavy wall casing Two data point design allows for better prediction Superior charges translate across all applications 19


20 Perforation Geometry BH Charges Affected area much larger in diameter than hole size Crushed sand can form an effective injection plug In lab, plug can be broken down, fluidized without fracture 20

21 Berea Sandstone Flow Performance 21
22 Laboratory Evaluation: Berea Sandstone Flow Performance is 55% to 76% superior to the conventional charge at every balance condition. Reactive Charge at 1000 psi overbalance performed equivalently to the conventional charge at 500 psi underbalance. With slight underbalance, the reactive perforation tunnel flow performance surpasses 1.0 Production Ratio. 22
23 Field Applications Shoot and Produce Wells in which no stimulation is required Success = increased productivity Bonus = reduced cost, complexity, risk Eliminate underbalance, release rig (TCP to W/L) Examples: Thailand +50% initial productivity based on performance of appraisal wells perforated with premium system Pakistan 3x productivity of previous best-in-field well North Sea Equivalent productivity with 1 run vs. 3 runs 23
24 Field Applications Re-Perforation Generally a tough task for perforators Effective stress increases as reservoir pressure drops Hard to apply underbalance with open perforations etc. Success = increased productivity Examples: UK 30x productivity after re-perforation (best in field) USA 10x productivity more than 2x the increase seen re-perforating offset wells with conventional systems USA 10x increase in gas well production after reperforation already shot twice with premium DP system 24
25 Castlegate Sandstone Flow Performance 25
26 Laboratory Evaluation: Castlegate Flow Performance is 6% to 59% superior to the conventional charge at every balance condition. Optimized Reactive Charge provided a PR of 0.92 at overbalance condition. Conventional charge produced deeper tunnels, however reactive design produces cleaner perforations, with better side wall condition. 26
27 Field Applications Low Strength Rock Success = reduce TSS at same/higher rate due to greater number of open tunnels and reduced flux rate Example: Oman Well produced 2x gross liquids of comparable offsets but only 10% of the field average sand rate North Sea Excellent Performance on High Perm Injection Wells 27
28 Matrix Acidizing Reactive Charges-23 gm Load Needs 1/6 of Acid to break through Conventional Reactive 28


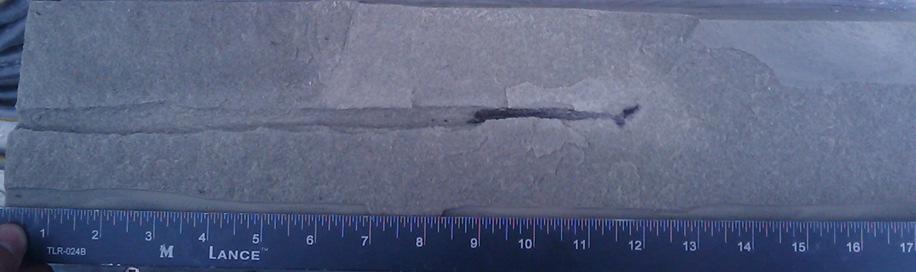
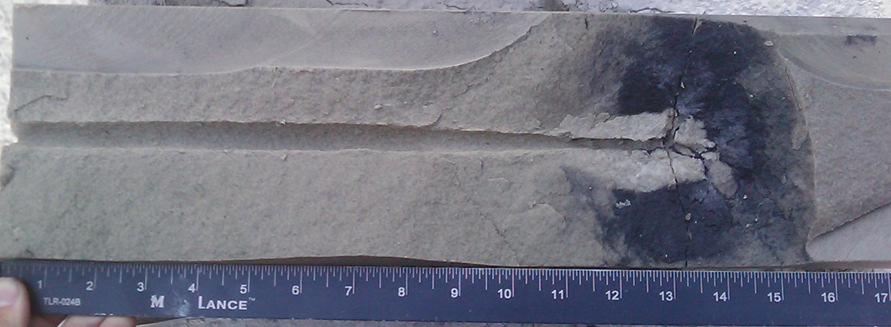
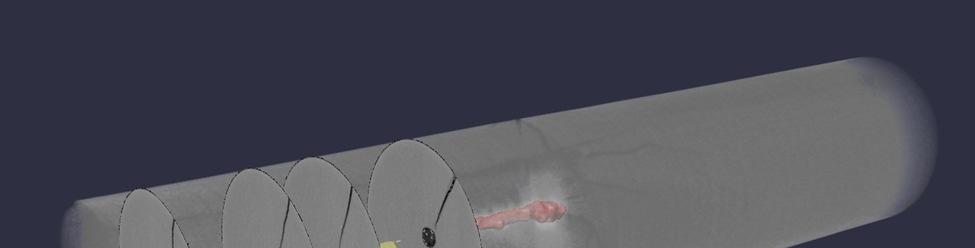
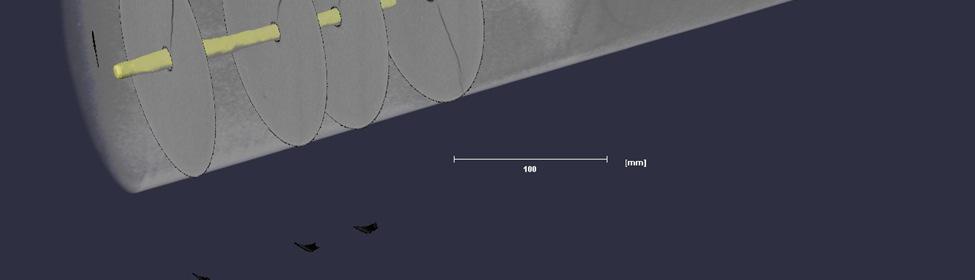
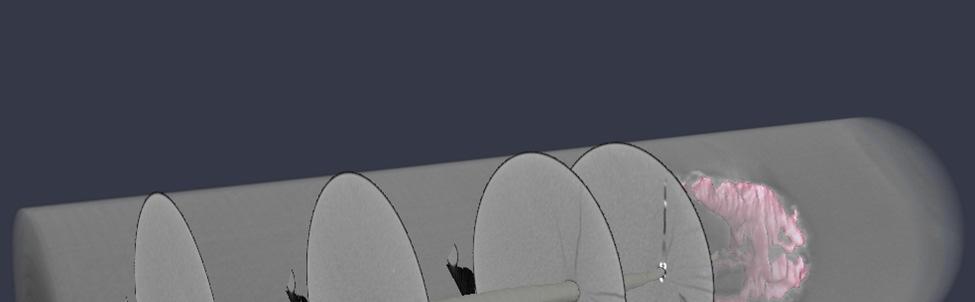
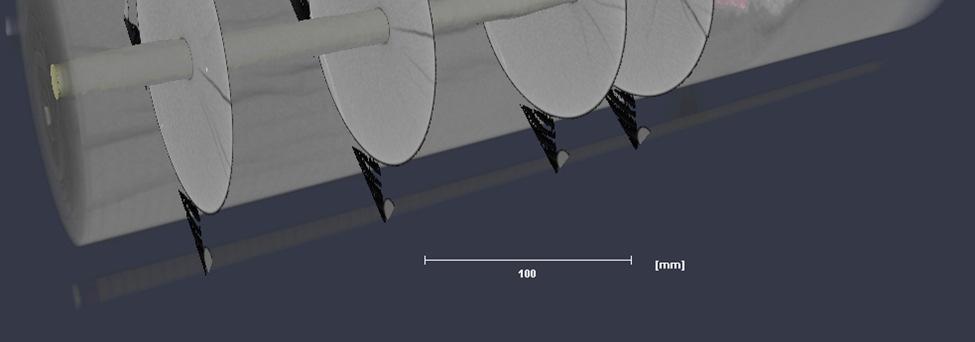
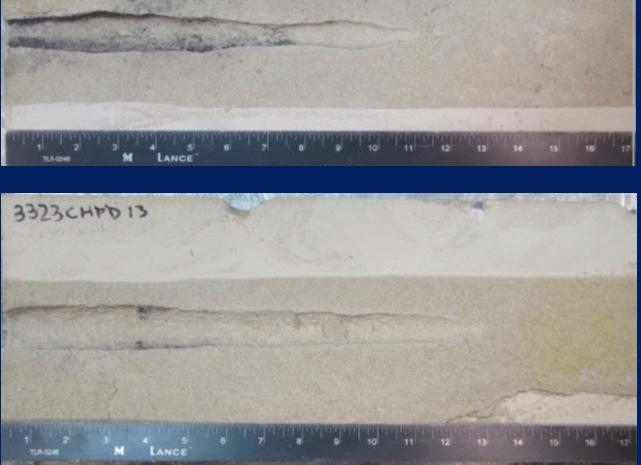
29 CT Scans, Mancos Shale, 23g XEH Charges 29


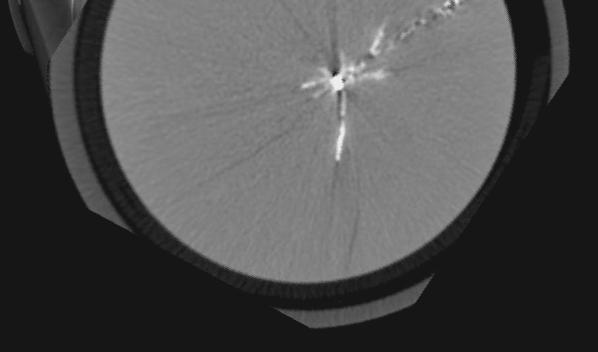
30 CT Scans, Mancos Shale, 23g XEH Charges 30
31 Field Results Breakdown Pressure Red 31
32 Field Results Treating Pressure Reduction 32
33 Field Results Productivity Improvements 33
34 Field Results Offset Comparison 4 Offset Groups 13% to 29% Reduction in Breakdown Pressure 6% to 15% Reduction in Treatment Pressure Improvement in Early Productivity Decline 34
35 Field Results: EaglefordShale 35
36 Thank you! For more: SPE144167, SPE , SPE , SPE John Hardesty Principal Research Engineer, GEODynamics, Inc.