Irrigation and Salinity Management In a Dry Year(s) Terry Prichard UC Davis Dept Land, Air, and Water Resources
|
|
|
- Vincent Gilbert
- 5 years ago
- Views:
Transcription
1 Irrigation and Salinity Management In a Dry Year(s) Terry Prichard UC Davis Dept Land, Air, and Water Resources
2

3 Stretching Water Supplies Application Efficiency System Design/ Uniformity Runoff Collection and Reuse Reduce Evaporation Targeted Application / micro irrigation / buried drip Proper Irrigation Scheduling Reduce Transpiration- water stress

4 Evaluate and upgrade irrigation systems improve distribution uniformity Pressure variation Nozzle size uniformity

5 Surface Irrigation Runoff All soils Deep percolation Sandy soils
6 Eliminate or minimize cover crops or weeds which can compete for water use
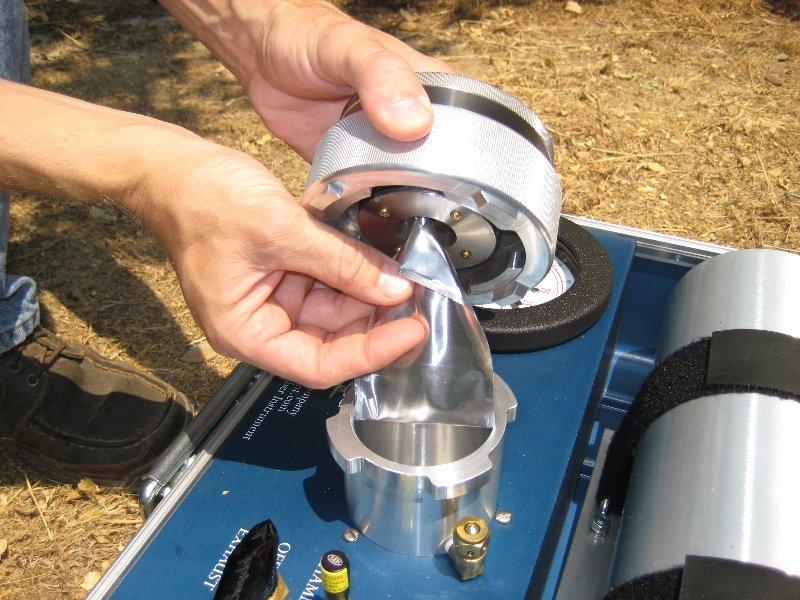
7 Reduce Water Use-- Transpiration Use ET estimates and reduce by a fraction of full water use Use Stem water potential measurements with thresholds for a particular stage of development Measure soil moisture and apply at a threshold value
 Time of season (canopy Expansion) Spacing Available")
8 Water Use Climate Evapotranspiration Reference (ETo) Sun Interception Size of Canopy Plant Controls Stomata (Kc) Time of season (canopy Expansion) Spacing Available Moisture

9 Calculate Full Potential Water Use ETo x Kc = Full Potential Water Use Use weekly summed data
10 Mature Almond Water Use Manteca Normal California, inches Historical Date ETo Kc ETc March April April May May June March 16 - June 15th 13.14
11 Mature Almond Water Use Manteca Normal, California, inches Historical Date ETo Kc ETc June July July August August September September October October November June 16 Nov
12 Moisture C-Probe 12in 24 in 36 in 48 in 60 in Irr = 1.4 in 6/13 6/20 6/27 7/4 7/11
13 C-Probe in 24 in 36 in 48 in 60 in Sum Irr = 1.4 in Moisture /13 6/20 6/27 7/4 7/11

14 Tree Water Stress Measured as midday stem water potential Using a pressure chamber aka pressure bomb

15 Lower scaffold limb Fully expanded leaf Bag for 15 minutes min
16

17 Measure it in a pressure chamber
18
19 Plant pressure chambers are available from: PMS Instruments in Albany, Oregon ( pmsinstrument.com/) Soil Moisture Equipment Corp.in Santa Barbara, California (
20 Almond Deficit Strategies Moderate 30% savings little effect on yield Severe 50% savings Reduced yield due to smaller kernel size current year Reduced yield in subsequent year due to reduced nut number and kernel size Staying alive --12 inches water No concern for yield current or subsequent year- tree survives
21 Moderate Deficit Strategy Full Irrigation Leafout to Mid June Deficit Irrigation 30% savings Mid June to harvest 50% of full irrigation Or -20 to -22 bar threshold before irrigation
22 Moderate Deficit Strategy 30% savings Deficit Irrigation Constant reduction of applied water in relation to ET 70% of full requirement Calculate full crop water use-- then apply irrigation at 70% This method can be influenced by the amount of stored soil moisture and should be accounted for in the applied water
23 More Severe Deficit Strategy Deficit Irrigation 50-60% Savings Leafout through mid June -12 to -14 bars mid-day day stem water potential Deficit Irrigation June 15 th to harvest -20 to -25 bars w/ 1 inch applied at hull split
24
25 Keeping the Trees Alive This method does not consider growth or yield just survival estimated 12 inches applied water depending on stored soil moisture Deficit Irrigation Leafout through May -16 bars mid-day day stem water potential before application Deficit Irrigation June to harvest -25 bars before application Until water supply is depleted
26 Almond Salinity All soils and waters contain some salts Soils with coast range parent material are higher as are waters from aquifers from same Salts accumulate in the soil rootzone as a result of applied water volumes and orchard transpiration
27
28 Salinity Management Sample water Total salts and constituents Soil Sample in depth increments Total salts and constituents Sodium, Chloride, Boron Tissue Samples Sodium, Chloride, Boron
29 Almond Salt Tolerance Water Salinity 1.0 ds/m or EC mmho/cm Soil Salinity 1.5 ds/m Relationship based on a 15% leaching fraction 6/40 = 15%
30 Relative Yield (%) Almond Grape Orange Pistachio Cotton Mean Rootzone ECe (ds/m)
31 Removing Salts Total salts and Chloride Leaching with good quality water Sodium Soluble Calcium or acid in calcareous soils Leaching with good quality water
32 Leaching Salts Planned leaching program Apply water in excess of water consumption or off season Leverage Rainfall Fill the profile after dormancy Allow rain to move salts out of rootzone

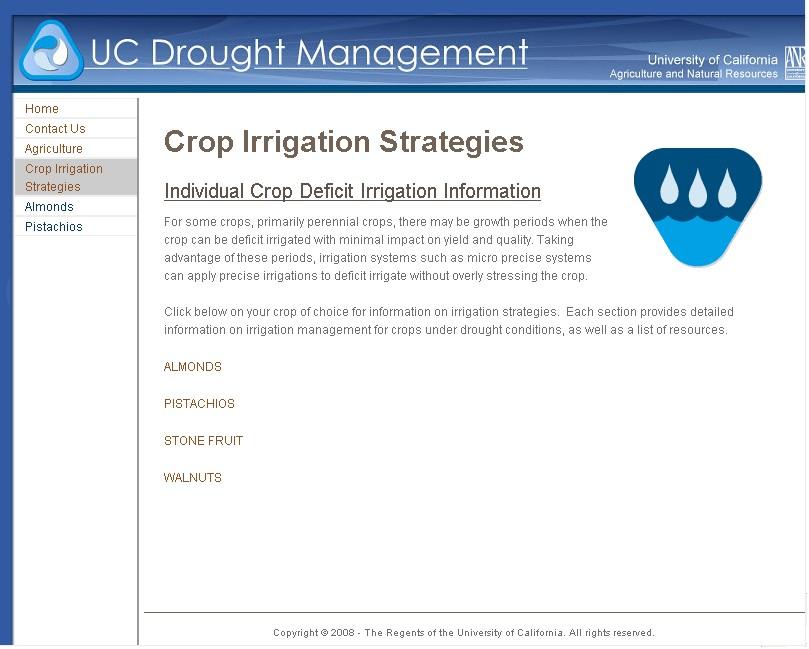
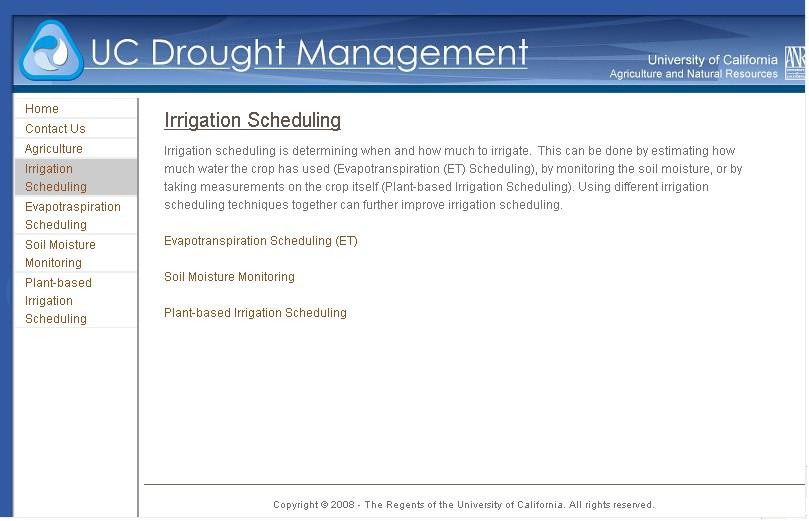
33 ucmanagedrought.ucdavis.edu Contact us: Lawrence Schwankl or Terry Prichard
34
35