CLIMATE CHANGE AND ITS IMPACT ON WATER RESOURCES
|
|
|
- Eugene Gilbert Parrish
- 5 years ago
- Views:
Transcription
1 CLIMATE CHANGE AND ITS IMPACT ON WATER RESOURCES 7 th Water Monitoring and Education Summit Rutgers Eco-Complex 18 November 2009 Marjorie Kaplan, Manager, Office of Climate & Energy (OCE), NJDEP
2 OCE Mission Facilitate DEP effort to address mitigation and adaptation policies related to climate change Coordinate w/state agencies to develop recommendations to achieve state s 2020 and 2050 GHG limits Lead implementation of GWRA and GWSF provisions
3 Climate Change Basics Enhanced GHG effect due increased CO 2 concentrations (pre-industrial 275 ppm; now 390 ppm; stabilization level 450 ppm) Increase in temperature accompanied by changes in climate (cloud cover, precipitation, wind patterns, seasonal durations) Extreme weather events very likely (will be difficult and disruptive)
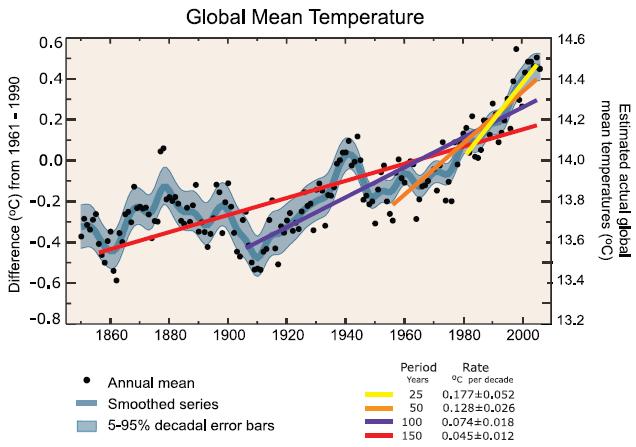
4 IPCC, AR4
5 IPCC 4 th Assessment Report, 2007 Most of the observed increase in globally averaged temperatures since the mid-20th century is very likely due to the observed increase in human-induced GHG concentrations Hotter temperatures and sea level rise would continue for centuries even if GHG levels are stabilized
6
7 Global Projections Warming: to 7 0 F by the 2090s Precipitation: Drier subtropics, wetter mid/high latitudes expected Sea level rise: 7 to 23 inches (excluding possibility of future rapid changes in ice flow) Extreme events: more droughts, coastal floods and intense precipitation events
8 Northeast Climate Projections (NECIA, 2007) More frequent days with temperatures above 90 0 F (NCAR projects record highs could outnumber record lows 20 to 1 by the end of the century) Longer growing season Increased heavy precipitation Winter ppt falling more as rain rather than snow; reduced snowpack; earlier breakup of ice on lakes and rivers; earlier spring snowmelt resulting in earlier peak river flows Rising sea surface temperatures and sea level
9 Some Relevant Impacts Water: Quantity and quality Human health: Changes in vector-borne diseases, heat/air quality-related mortality Ecosystems: Wildfire risk; loss of ecosystem services with decreases in biodiversity and populations of critical/endangered species Infrastructure and Energy: Changes in severe weather events, possibly including tropical storms Concomitant and Indirect Impacts: (e.g., economics, industry, agriculture, human health)

10 The Stern Review (2006)
11 Hydrology and Water Resources Increased runoff and stream flow Earlier stream flow (earlier spring discharge from snow melt and glacial melt) Warming lakes and rivers Projected increases in annual mean stream flow in high latitudes (IPCC, medium confidence)
 TAR")
12 Increased Streamflow Earlier Stream Flow Warming Lakes Hydrology and Water Resources Projected "increases in annual mean streamflow in high latitudes (medium confidence) TAR (NOAA, 2008)
13 Ecosystem Phenology and Range Shifts (Terrestrial and Marine) Poleward and elevational range shifts Earlier onset of spring events (e.g. flowering, migration) Lengthening of growing season Species composition and dominance will change Climate pressures will cause some species currently classified as critically endangered to become extinct and the majority of those labeled endangered or vulnerable to become rarer
 state endangered; globally rare, one population worldwide, found only in NJ; threatened by habitat")
14 Threatened Species Example (Flora) Hammond s yellow spring beauty (Claytonia virginica var. hammondiae) state endangered; globally rare, one population worldwide, found only in NJ; threatened by habitat alterations. Photograph by David Snyder
15 Bio-indicators and Climate Change Ecosystem health is an element of water quality standards CC additional stressor on ecosystem Affects both reference & non-reference sites Indicators may be confounded by climate change effects on ecosystems Difficult to establish bio-criteria program goals if baseline is changing or goals may be impossible to meet
16 Indicator Categories (adapted from USEPA presentation on research project on Climate Change, Aquatic Ecosystems and Biological Indicators, May 2008) Insensitive to CC Sensitive to CC Sensitive to CC & Other Stressors Indicator Warmwater fish Fish community composition Salmon egg to fry survival Response No change in majority of range Cold-and coolwater fish species decline, warmwater fish species increase Decreased survival due to increased turbidity due to increased ppt &/or land-use
17 Climate Sensitive Bio-indicators Phenology (timing of emergence, reproduction, flowering, etc.) Longer growing season (no. of reproductive periods) Life stage-specific Temperature sensitivity (e.g., shift from cool/coldwater species to warmwater species) Hydrologic sensitivity (e.g., decrease in salt intolerant wetland plants)
18 Sea Level Rise Impacts Infrastructure, residential and commercial assets are all at risk to SLR and more frequent coastal flooding Inland flooding from rainfall will be more destructive due to drainage problems Saltwater will intrude into estuaries and aquifers, and inundate polluted sites Coastal ecosystems will be compromised Northeast coasts face increases in the extent and frequency of storm surge, coastal flooding, erosion and wetland loss (along with their water filtration)
19
20 Climate Change Response: Mitigation, Sequestration, Adaptation Limiting Future Impacts Mitigation (reduced CO 2 emissions through energy efficiency, renewable energy, carbon capture and storage and reduced CH 4 emissions) and Sequestration (enhanced CO 2 uptake by natural systems through improved landuse management) Response to Existing Impacts Adaptation ( climate proofing, i.e., ensuring development of climate-resilient human and ecological communities)
21 U.S. and NJ Contribution to Global Warming/Climate Change U.S. emits 20% of the world s GHG emissions NJ emits approximately 137 MMTCO 2 annually (2007) which is 2% of U.S. emissions and 0.4% of global emissions U.S. needs to cut emissions 30% by 2030 and 80% by 2050 to meet stabilization goal of 450 ppm CO 2 in the atmosphere NJ goal is to stabilize its emissions to 1990 level (123 MMTCO 2 ) by 2020 & reduce emissions 80% below 2006 level by 2050 (i.e., 25.5 MMTCO 2 )
22 DRAFT 2007 Statewide GHG Emissions Inventory Millions of metric tons CO 2 equivalent 4% 1% 4% Transportation (35%) 4% Electric generation (24%) 7% 10% 11% 35% Industrial (11%) Residential (10%) Commercial (7%) Halogenated gases, natural gas leaks, & other (4%) Waste Management (4%) Land clearing (1%) 24% Sequestered by forests (4%)
23 NJ Response: Policies & Programs (Mitigation) Executive Order 54 (2/13/2007) and Global Warming Response Act (7/6/2007) set statewide GHG limits Draft Global Warming Response Act 2020 Recommendations Report (12/15/2008) Three Core actions in GWRA: 1) Regional Greenhouse Gas Initiative (RGGI), 2) Energy Master Plan (EMP) and 3) Low Emission Vehicle (LEV) program, all 3 designed to meet 2020 GHG limits Beyond core actions, there are a host of other recommendations & related actions in key sectors including terrestrial sequestration and water
24 NJ Response- (Mitigation: Waterrelated Measures in GWRA Report, Regional and Federal Efforts) Outdoor water consumption: mandatory statewide watering limits applied to all water users Green buildings: state guidelines/programs including measures to improve water conservation & decrease storm water run-off) Waste management: financial incentives to reduce carbon footprint of public water supply & POTWs Regional carbon partnership: support for geologic & terrestrial carbon sequestration including forested wetlands (water & C) U.S. EPA proposed rules: the EPA has proposed regulations for geologic sequestration of CO2 under the Safe Drinking Water Act. Federal climate legislation (House/Senate bills): several provisions are water-related; complement state efforts
25 NJ Response: Policies & Programs (Mitigation) Global Warming Solutions Fund Act (N.J.S.A. 26:2C- 45 et seq) allocates proceeds from the auction of NJ RGGI CO 2 allowances ($51 million to date) 60% to EDA for end-use energy efficiency and new state-of-the art electric generation in commercial, institutional, industrial sectors; 20% to BPU to reduce electricity demand & costs for residential low and moderate income electricity customers; and 20% to DEP (10% to support local government GHG efforts and 10% to enhance stewardship & restoration of State forests and tidal wetlands [CO 2 storage & co-benefits, e.g., water filtration])
26 NJ Response: Policies & Programs (Adaptation) Draft Global Warming Response Act 2020 Recommendations Report commits the State to developing Comprehensive Adaptation Plan; lays out framework for the impacts to be addressed State currently in early stages of plan formulation and expects a coordinated process integrating other on-going efforts (e.g., Wildlife Action Plan incorporating adaptation) Proposed Federal Climate Legislation includes Adaptation provisions supporting state efforts (in addition to comprehensive mitigation programs)
27 NJ Response: Policies & Programs (Mitigation and Adaptation: Work in Progress) A number of working groups set up to address adaptation research, planning & implementation concerns including collaboration with DEP programs, regional and federal initiatives (e.g., Climate Adaptation Temperature and Precipitation Workgroup). Basic research questions (e.g., scale issues) being considered with regard to use of climate models with implications on water supply planning, TMDL, aquatic ecosystem indicators, and other applications relevant not only to water but other key sectors as well Example is determining probabilities of changes in occurrence and seasonality of temperature, precipitation and solar radiation over different timescales (20, 25, 50, 75, 100 years)
28 What Can You Do (as monitors)? Be part of the monitoring & study effort of the state to obtain NJ-specific climate change data (conditions as well as impacts, e.g. phenology). Community-based programs offer this opportunity, e.g., Project BudBurst ( and NJ CoCoRaHs - Community Collaborative Rain, Hail & Snow network in addition to existing volunteer programs of DEP Monitoring of reference sites and collection of baseline data (biotic and abiotic variables like temperature and flow; species sensitivities) are critical tasks that help in developing policy responses
29 What Can You Do (as Citizens)? Help spread a science-based message about climate change, its impacts, and the needed actions Know your carbon profile/footprint and take action at the personal level (starting from the simplest ones) to reduce your carbon impact. Visit lculator.html
30 For More Information NJDEP Office of Climate and Energy