Catalyst Pluggage Reduction for Roxboro U3
|
|
|
- Elwin O’Connor’
- 5 years ago
- Views:
Transcription

1 Catalyst Pluggage Reduction for Roxboro U3 Matt Boone Progress Energy Rob Mudry Airflow Sciences November 17, 2009
 added in 2003 Two layers Cormetech honeycomb catalyst (6.")
2 Roxboro Steam Plant Four units built MW total Eastern bituminous coal Unit 3 Riley 745 MW twin furnace Rear wall firing w/atrita mills Two Foster Wheeler SCR reactors (A and B) added in 2003 Two layers Cormetech honeycomb catalyst (6.9 mm pitch) One empty layer Two-segment LPA screen installed 2004, updated in 2006
3 Roxboro 3 SCR Flow


4 Problem Description SCR Catalyst plugs with ash over time Large dunes (>4 high) over ~50% of both catalyst layers
 to December 2008 (5")
5 Problem Description SCR Reactor pressure drop increases over time NH3 usage increases as reactor pluggage advances NOx reduction limited when NH3 slip hits maximum Reactor B DP: May 2008 (3 IWC) to December 2008 (5 IWC)

6 Problem Description SCR Nox emissions over time NOx emissions: May 2008 to December 2008

7 Roxboro 3 LPA Screen Located at economizer hopper Woven wire mesh with 4 mm square openings Two-segment flat screen Upper section at 45 degree angle Lower section at 80 degree angle Floor on top of hopper grating Flow through economizer LPA Screen Hopper grating RH/SH dampers


8 Problem Description LPA Screen LPA screen at economizer hopper plugs with ash over time Screen erosion also evident; periodic patching required Lower screen Upper screen Erosion and patch
9 Solution Process Geometry, operational data, and observations from plant Detailed inspection and ash characterization (May 2009) Velocity and online video testing (June 2009) Computational Fluid Dynamics modeling (summer 2009) Correlate CFD model to actual plant observations Evaluate various design strategies Develop final design Fabricate and install modifications (Oct 2009) Observe performance over time
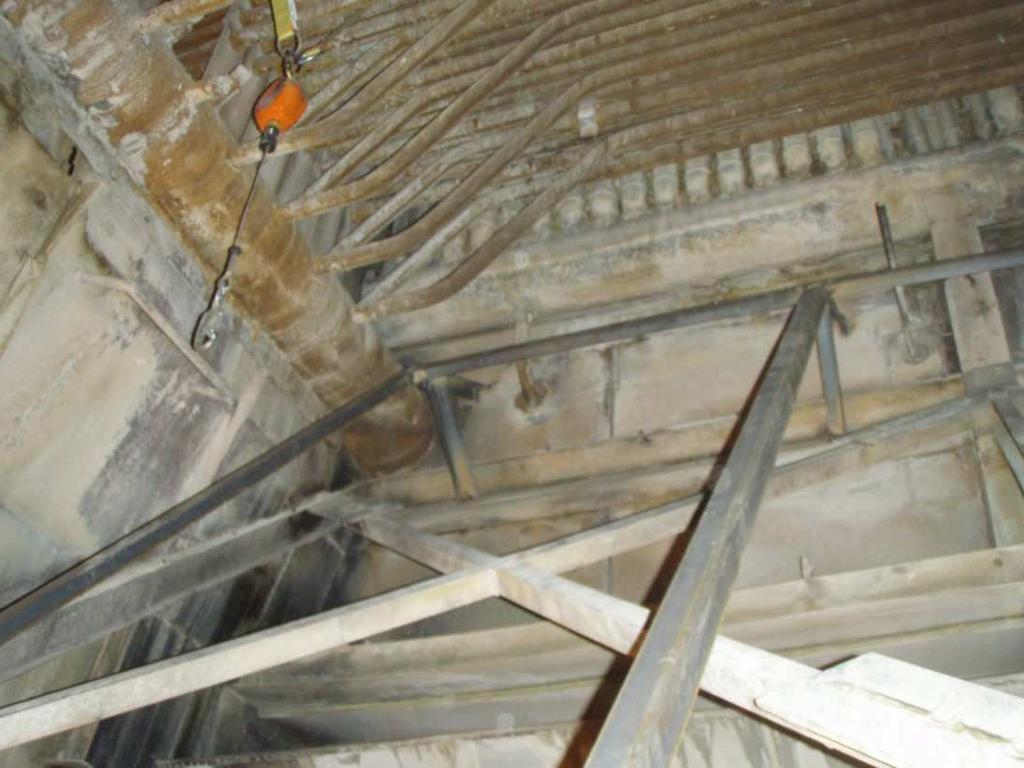
10 Geometry Economizer Hopper Region SH Pass B-Side of Unit RH Pass SH Pass Economizer tubes Flow to SCR Hoppers (4)
11 Inspection (May 8-15, 2009) LPA Screen Pluggage and erosion primarily in SH passes RH pass fairly clean and notably less erosion Pluggage of upper screen estimated at 60% blocked Combination of LPA and fine ash Some evidence of moist ash Lower screen slight pluggage near bottom, LPA wedged into screen openings Erosion of SH pass lower screen is most pronounced Erosion evident on floor section near hopper grating Observed that it is difficult to patch screen completely


12 Inspection (May 8-15, 2009) LPA Screen LPA Screen Upper/Lower Transition Hopper grating Lower Screen
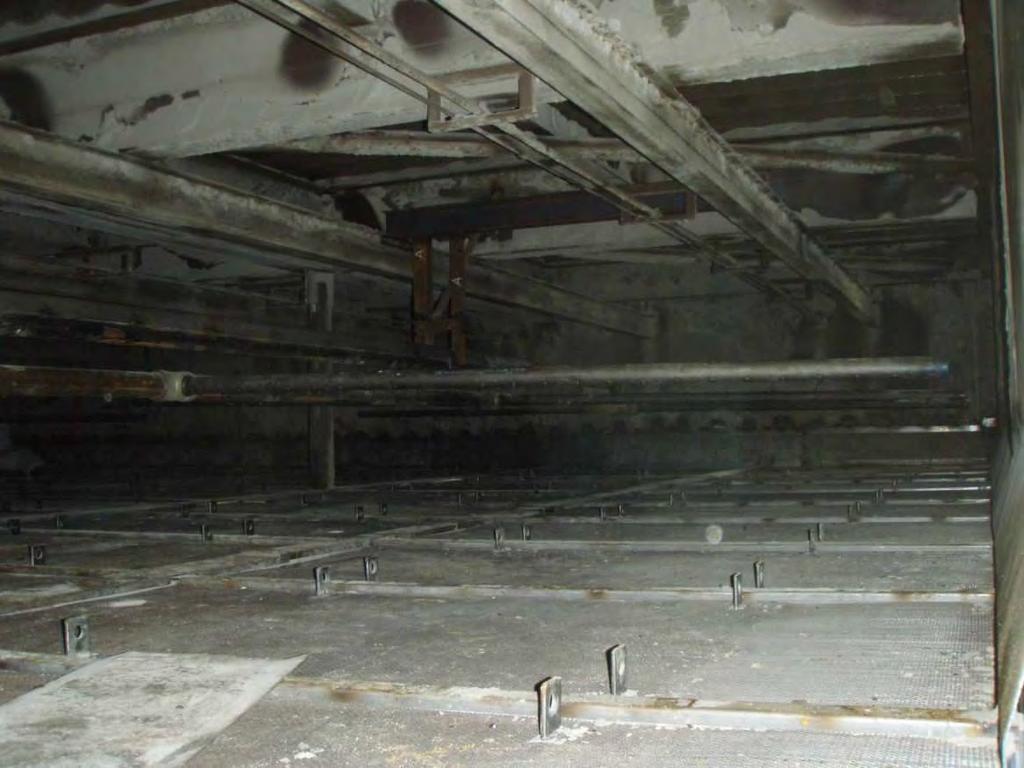
13 Inspection (May 8-15, 2009) SCR Reactors Catalyst layer 1 empty Large ash dunes on top of layers 2 and 3 starting from South wall (closest to boiler) After vacuuming dunes, LPA and fine ash still present in catalyst channels LPA present near North wall also Fine ash build up noted on all trusses above catalyst, including monorail beams, empty first layer trusses, and rectifier supports Fine ash build up on SCR inlet turning vanes (2-3 deep)


14 Inspection (May 8-15, 2009) SCR Reactors Before vacuuming North wall LPA After vacuuming
 Vanes,")


15 Inspection (May 8-15, 2009) Vanes, structure above catalyst Monorail beams and trusses Reactor inlet turning vanes


16 Particle Characterization Catalyst Layer 2 Pluggage Lower LPA Screen Pluggage Catalyst Layer 3 Pluggage
17 Field Testing Conducted ~3 weeks after outage Full load (June 8-9, 2009): Measure velocity profile at catalyst and LPA screen Video of ash pluggage situation at SCR and LPA screen Low load (June 9, 2009) Video of SCR pluggage situation
18 Field Test Results Velocities at LPA screen 2 ports on East walls (SH pass outboard) Probe could only be inserted 7, while duct is 50 wide 3D velocity probe, electronic data acquisition Upper port Lower port Average velocity (ft/sec) Peak velocity (ft/sec) Average flow direction (degrees CCW) Static pressure (inches of water) Average temperature (deg-f) Upper test port Lower test port
19 Field Test Results LPA Screen Video Full load video at LPA screen Insert camera 10 deep from East walls (SH pass outboard) Enertechnix Pyro-Remote camera Videos were shown at this time during the actual presentation


20 Field Test Results LPA Screen Video Upper screen blockage estimated at 80-90% Lower screen only minor blockage noted Upper LPA screen

21 Field Test Results LPA Screen Video Tracking an LPA particle to the upper screen
 15.0 12.7 Peak velocity (ft/sec) 20.3 17.1 Minimum velocity (ft/sec) 7.8 3.0 Flow balance (% of measured ports) 54.1 45.")
22 Field Test Results Velocity distribution in SCR Measure 10 deep from North & South walls (reactor width 35-9 ) 3D velocity probe, electronic data acquisition North wall ports South wall ports Average velocity (ft/sec) Peak velocity (ft/sec) Minimum velocity (ft/sec) Flow balance (% of measured ports)
 Allowed observation of first")

23 Field Test Results Full load video at SCR catalyst Insert camera 12 deep from South wall (closest to boiler) Allowed observation of first 3 catalyst modules from south wall Enertechnix Pyro-Remote camera Along south wall, ash extends 1-2 from wall Along south wall, LPA evident
24 Video at SCR Catalyst Videos were shown at this time during the actual presentation

25 Full Load Video at SCR Catalyst Along south wall, ~6 wide module seal at bottom, LPA evident Along N-S ~6 wide module seal Along N-S module seal, starting to bridge over catalyst


26 Full Load Video at SCR Catalyst Ash build up on reactor trusswork Randomly located pluggage regions, far from south wall. Ash avalanche event captured on video. No sonic horns in operation.

27 Low Load Video at SCR Catalyst Ash build up along south wall increased At some locations, ash extends over entire first module along seals More bridging initiated along seals
28 CFD Model Set Up Model 1: LPA Screen 3-D domain from economizer inlet to SCR damper Include econ tubes, LPA screen, trusses, headers, RH/SH dampers Full load flow rate Track 28,000 particles through system (3, 5, 7, & 9 mm) Examine LPA screen pluggage, erosion, pressure drop Model 2: Reactor inlet 2-D domain from SCR inlet duct to catalyst layer 2 Include reactor inlet vanes, rectifier, catalyst Full load flow rate Examine ash build up on reactor inlet vanes


29 Baseline LPA Screen Model Output Gas velocity distribution Full load, clean screen and partially plugged upper screen Clean screen 60% plugged upper screen

30 Baseline LPA Screen Model Output Total velocity at face of screen Upper Lower Clean screen Average Vel = 43 ft/s % area > 60 ft/s = 4% Peak velocity 70 ft/s Upper Lower 60% plugged upper screen Avg Vel Upper = 29 ft/s Avg Vel Lower = 67 ft/s % area > 60 ft/s = 35% Peak velocity 90 ft/s DP increase 0.8 in.h 2 O

31 Baseline LPA Screen Model Output Particle trajectories Impact locations on screen are similar for clean and plugged cases 5 mm particle trajectories 34% of particles impact screen
32 Design Changes Primary Main goals Steeper upper screen angle Minimize peak velocity at screen Reduce # of particles impacting screen Minimize erosion Minimize DP Install Fall design variations evaluated Baffle RH/SH dampers Upper Screen perf plate (35 from vertical) Lower Screen woven wire Flow through economizer Baffles Hopper grating

33 Final Design Gas Velocity Slight increase in peak velocities on screen No change in screen DP

34 Final Design Velocity at Screen Nearly identical to baseline clean screen Upper Lower Clean screen Avg Vel = 43 ft/s % area > 60 ft/s = 4% Peak velocity 70 ft/s Upper Lower Final design screen Avg Vel = 46 ft/s % area > 60 ft/s = 4% Peak velocity 73 ft/s DP increase 0 in. H 2 O
35 Reactor Inlet Vane Model Baseline velocity distribution through vanes Close-up at inner corner

36 Reactor Inlet Vane Model Ash buildup on vanes occurs in flow recirculation zones above horizontal and curved vane surface Goal: Reduce size of recirculation zone without degrading velocity pattern at face of catalyst


37 Reactor Inlet Vane Design Changes Revised Vane Geometry 2 inch slot at strategic location Close-up at inner corner

38 LPA screen installation


39 LPA screen installation


40 LPA screen installation


41 LPA Screen Installation


42 Hopper baffle installation


43 Hopper Baffle Installation
44 Turning vane slot modifications (first 7 vanes)


45 Turning vane mods

46 SCR sootblowers In order to prevent loose flyash from piling in the SCR at low loads, three sootblowers per layer were installed.


47 Sonic horn effectiveness Sonic horns have been effective in applications with little popcorn ash and sufficient flow conditions at low load. Ash loading in the Rox 3 SCR overwhelmed the sonic horns. Add pics

48 Ash lance effectiveness Plant-manufactured ash lances were installed in December The lances controlled the extent of the ash pile and shortened time needed to vacuum the SCR.
49 Sootblower design Plan View


50 Sootblower installation


51 Sootblower Installation


52 Sootblower Installation


53 Sootblower Installation

54 Sootblower Installation


55 Sootblower Installation
56 Installation Schedule and Cost All modifications installed during Fall 2009 outage (10/3 10/18) and included a catalyst layer change out. Costs totaled $806,000 Material: $288,000 Labor: $518,000 (includes installation mechanical labor, electrical labor, vacuuming, engineering, plant labor, insulation, C-B tech rep, ASC)

57 Field Results Post Installation Nox emissions
 Reactor DP holding steady after 5")
58 Field Results Post Installation Reactor pressure differential (inh2o) Reactor DP holding steady after 5 weeks operation

59 Field Results Post Installation Video at LPA screen (16 Nov 2009) ~50% load Unit had been operating for ~4 weeks since outage Less pluggage than with previous screen during May testing, but still occurring LPA appears to be pinned against screen by gas flow Upper screen most areas estimated at 40% blocked
60 Field Results Post Installation Video at first layer catalyst (16 Nov 2009) No ash dunes noted, even near South wall Compares very favorably to previous testing in May, when dunes extended 2-4 from wall Some LPA visible on top of catalyst, not sure how it traveled here Holes in screen? Had laid out in inlet ductwork prior to outage and was reentrained during start up?
61 Conclusions Combination of CFD modeling and field testing used to analyze root causes of catalyst pluggage CFD modeling used to develop new design for LPA screen and reactor inlet vanes New sootblowers installed at all layers Catalyst pluggage situation appears to be under control based on observations after 4 weeks operation No evidence of ash accumulation on catalyst Will continue to monitor performance over time LPA screen upper section still showing pluggage; less than previous Steeper angle or upper deflection baffles may be required to eliminate pluggage Will continue to monitor over time to determine if design revisions are necessary