Webcast August 9, R. Shane Trussell, Ph.D., P.E., BCEE Principal Investigator. Gordon J. Williams, Ph.D., P.E.
|
|
|
- Kenneth Palmer
- 5 years ago
- Views:
Transcription
1 Reclaimed Water Desalination Technologies: A Full-Scale Performance and Cost Comparison Between Electrodialysis Reversal and Microfiltration/ Reverse Osmosis Webcast August 9, 2012 R. Shane Trussell, Ph.D., P.E., BCEE Principal Investigator Gordon J. Williams, Ph.D., P.E. Project Engineer 1
2 Webcast Overview Background Previous Studies & Project Motivation Facility Comparison Cost Comparison Conclusions 2
3 3 Background
4 Why Desalt Recycled Water? Reduce total dissolved solids (TDS) to expand possible uses High salt rejection not necessarily needed Opportunity to blend membrane product water Membrane desalination Reverse osmosis (RO) with microfiltration (MF) pretreatment Electrodialysis reversal (EDR) 4
5 Two Desalting Membrane Types Pressure RO EDR Cathode (-) Concentrate Product Water Concentrate Product Water Saline Fresh Concentrate Anode (+) RO has significantly higher salt removal 2-Stage System: RO 90-98% vs. EDR 50-70% 5
6 RO Membranes Types of RO membranes Cellulose acetate Thin film composite 6 Image from: Baker, R. Membrane Technology and Applications. John Wiley & Sons: West Sussex, England (2004)

7 RO Vessel Architecture 7 Image from: Baker, R. Membrane Technology and Applications. John Wiley & Sons: West Sussex, England (2004)
8 Polarity Mode 1 EDR Process 8
")
9 EDR Process Polarity Mode 2 (charge reversed from above) 9

10 EDR Membranes and Spacers Two types of membranes: Anion Transfer Membrane Cation Transfer Membrane Spacers Typical numbers per stack: 1200 membranes 1201 spaces 10
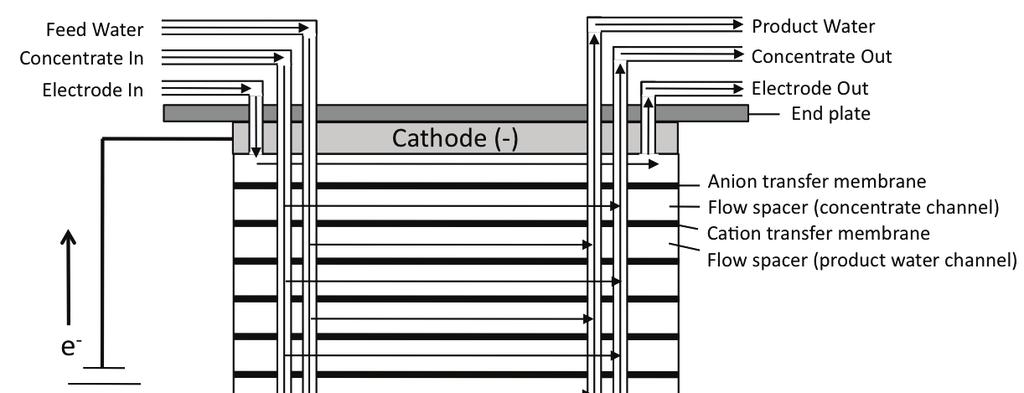
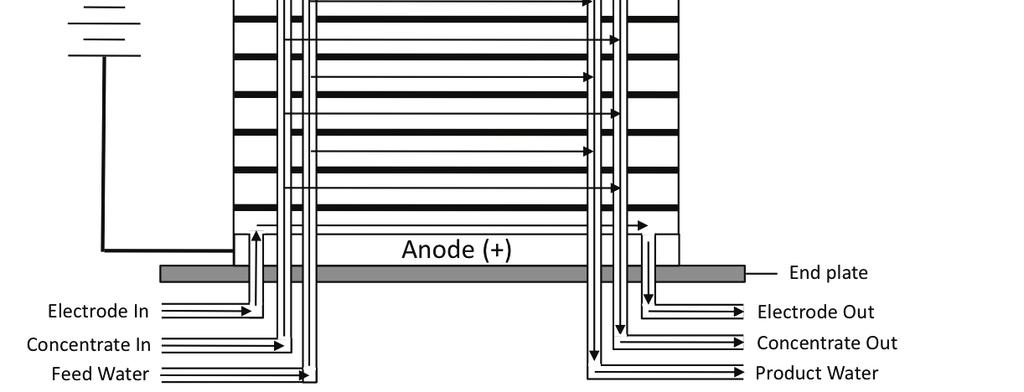
11 11 EDR Architecture
 Pretreatment for Reuse MF required MF not required Fouling Concerns O&M Inorganic Organic Biofouling Silica MF CIP MF maintenance cleans RO CIP")
12 Comparison Between Membranes Consideration RO EDR Use in U.S. Recycled Water Widely applied 1 Facility (San Diego) Pretreatment for Reuse MF required MF not required Fouling Concerns O&M Inorganic Organic Biofouling Silica MF CIP MF maintenance cleans RO CIP Conductivity profiling Interconnector repair Inorganic Organic EDR CIP Cartridge filter replacement Manual membrane cleans Probing for hot spots Torque adjustment 12


13 Assuming Two-Stage Systems RO: Two-stages Influent Effluent RO: Two passes Influent Effluent EDR: Two stages Influent Effluent 13
14 Previous Studies and Project Motivation 14
15 Limitations of Previous Studies Studies based on modeling, piloting or greenfield startup None examined longer-term operation Costs will differ between brackish water and reclaimed water Most missing some of life cycle costs e.g., membrane replacement, longer-term maintenance activities 15
16 Previous Studies: Costs per Mass of Salt Removed Cost per Mass Salt Removed ($/ton of TDS) O&M Total Study Water MF/RO EDR MF/RO EDR Port Hueneme Demo (Leitz, 2001) San Diego Startup (MWH, 2002) San Jose Pilot (Adham et al., 2004) San Diego Pasqual (MWH, 2008) Brackish $120 $124 $276 $319 Recycled $56 $ Recycled $213 $218 $494 $303 Brackish $275 $248 $430 $437 *See WRF report for full references 16
17 Overview of This Study Motivation: Most existing systems are RO, but EDR may provide cost savings Objective: Document actual full-scale costs of EDR and MF/RO Equipment and capital, energy, membrane replacement, labor, and chemicals Approach: Compare two similar facilities Size, established operations, feedwater, location 17
18 18 Facility Comparison
19 Comparison of Study Facilities MF/RO: Leo J. Vander Lans AWT Facility (LVL) EDR: North City Water Reclamation Plant (NCWRP) Parameter MF/RO EDR Location (California) Long Beach San Diego Online Date Membrane Design Capacity (mgd) Upstream secondary process Nitrified activated sludge Upstream tertiary process Granular Media Filtration Feed Turbidity (NTU) Daily Production (mgd)
20 LVL MF/RO Process Train Tertiary influent MF Antiscalant RO (1 st Stage) RO (2 nd Stage) Effluent to UV and Barrier Backwash Flow Brine 20

21 LVL Microfiltration (MF) Pall Corp Microza Module: USV-6203 Hollow-fiber Nominal pore size: 0.1 µm 200 modules 4.2 mgd capacity 92% design recovery 21

22 LVL Reverse Osmosis (RO) Hydranautics ESPA-2 Spiral wound Two stage system 72:36 pressure vessels 3.0 mgd capacity Overall RO recovery: 85% 22
23 MF Performance Data represent 3 years of daily grab samples 23
24 RO Performance 24 LVL RO performance from April to June 2009
25 25 RO Performance
26 26 MF/RO Recovery
27 27 NCWRP EDR Process Train


28 NCWRP EDR Membranes GE/Ionics EDR 2020 Two stage system 15 EDR lines 30 EDR stacks 1,200 membranes per stack 36,000 membranes total 3.3 mgd capacity 28
29 Pretreatment Performance: GMF Turbidity data from 2005 through April
30 EDR Performance 30 EDR operation on April 24, 2009
31 31 EDR Performance
32 32 EDR Performance
33 Membrane Performance Summary Parameter Units MF/RO EDR Water recovery % 80% 85% Salt Removal % 94% 60% Avg. feedwater TDS mg/l Avg. product water TDS mg/l
34 34 Cost Comparison
35 Costs Included in Comparison Capital Membrane replacement Energy Labor (maintenance) Chemicals for operation Chemicals for cleaning 35 Note: All costs presented are in 2009 dollars
36 Costs Excluded from Comparison Footprint costs Land acquisitions, site improvements, structure General construction costs Management, engineering & design Concentrate disposal Facility operations Labor beyond maintenance/cleaning 36
37 Cost Comparison Assumptions Everything but membrane type is the same Influent TDS, production, salt reduction goals Operated at design capacity, year round 20 year facility life span; no salvage value Electricity: $0.105 per kwh Labor: $65/h Present worth calculations 3% inflation, 6% discount 37
38 Costs (normalized by flow) Dollars per acre-foot of membrane product Cost MF/RO EDR Initial equipment and construction $249 $114 Membrane replacement $20 $26 Energy costs $62 $51 Chemical costs (process) $22 $1.3 Chemical costs (CIP) $3.0 $3.2 Labor cost (maintenance only) $16 $32 Total $371 $228 38
39 Costs (normalized by flow) Dollars per acre-foot of membrane product Cost MF/RO EDR Initial equipment and construction $249 $114 Membrane replacement $20 $26 Salt removals not equal Energy costs $62 $51 Chemical costs (process) $22 $1.3 Chemical costs (CIP) $3.0 $3.2 Labor cost (maintenance only) $16 $32 Total $371 $228 Normalize costs based on salt removed 39
40 Normalized by Salt Removal: A Blending Example Assume a system is needed to produce 10 mgd recycled water Current TDS is 1000 mg/l, but users need 800 mg/l 40
41 Normalized by Salt Removal: A Blending Example Assume a system is needed to produce 10 mgd recycled water Current TDS is 1000 mg/l, but users need 800 mg/l 20% salt reduction 41

42 Normalized by Salt Removal: A Blending Example Assume a system is needed to produce 10 mgd recycled water Current TDS is 1000 mg/l, but users need 800 mg/l 20% salt reduction What size membrane system is needed? 42
43 Membrane System Size Related to Salt Removal Efficiency Membrane capcity (mgd) = overall salt removal from blend membrane salt removal blended flow (mgd) Parameter Units MF/RO EDR Salt Removal %
44 Membrane System Size Related to Salt Removal Efficiency Membrane capcity (mgd) = overall salt removal from blend membrane salt removal blended flow (mgd) MF/RO capcity (mgd) = 20% 10 mgd = 2.1 mgd 94% 44
45 Membrane System Size Related to Salt Removal Efficiency Membrane capcity (mgd) = overall salt removal from blend membrane salt removal blended flow (mgd) MF/RO capcity (mgd) = 20% 10 mgd = 2.1 mgd 94% EDR capcity (mgd) = 20% 10 mgd = 3.3 mgd 60% 45
46 Membrane System Size Related to Salt Removal Efficiency Membrane capcity (mgd) = overall salt removal from blend membrane salt removal blended flow (mgd) MF/RO capcity (mgd) = 20% 10 mgd = 2.1 mgd 94% EDR capcity (mgd) = 20% 10 mgd = 3.3 mgd 60% EDR is ~60% larger than the MF/RO 46
 EDR ($76/ac-ft*) Capital $53 Energy")


47 Costs (normalized for 20% salt reduction) MF/RO ($79/ac-ft*) EDR ($76/ac-ft*) Capital $53 Energy $13 Other $13 Capital $38 Maintenance $3.3 Replace Chemicals - $5.3 Chemicals - $1.5 membranes $4.2 Energy $17 Maintenance $10.5 Replace membranes $8.6 *In dollars per acre-foot of blended water 47

48 Footprint and Brine Flow from Example Membrane system footprint: Waste flow produced: 48
49 Additional Factors to Consider Need to Remove Other Constituents Presence of Certain Foulants (silica) Occupational Hazards Usage: Seasonal vs. Year-Round Footprint Constraints Brine Disposal Method 49
50 A Need to Remove Other Constituents When removal of other constituents is needed Comparison based on salt removal only RO provides an effective barrier to pathogens and TOC EDR does not provide this type of barrier MF/RO is well-suited for groundwater recharge Effectively Removed by MF/RO TOC particles pathogens uncharged molecules 50
. The role of dissolved aluminum in silica chemistry for membrane processes.")
51 Presence of Certain Foulants: When high levels of silica are present Silica fouling a problem for RO Silica does not concentrate in an EDR EDR is well-suited for high silica applications 51 Image from: Gabelich, C. J..; Chen, W. R.; Yun, T. I.; Coffey, B. M.; Suffet, I. H. (2005). The role of dissolved aluminum in silica chemistry for membrane processes. Desalination 2005, 180,
52 Occupational Hazards: High Voltages and High Pressures Voltage: EDR membranes stack often exposed (e.g., checking for hot spots ) and improper handling could result in shock Measures can be taken to minimize risk Pressure: both systems under high pressure RO (~200 psi) and EDR (~50 psi) Risk low due to overdesign for safety 52
53 Usage: Seasonal vs. Year-Round: When the system is only used seasonally Many reuse applications are seasonal e.g., agriculture, landscape irrigation Seasonal flow favors EDR, with the lower capital cost and higher O&M Chemical and energy costs reduced proportional to flow Labor and membrane replacements costs reduced but not directly proportional 53
54 Footprint Constraints: When the size of footprint is important Cost of acquiring and developing land not considered in comparison: Footprints similar on flow normalized basis MF/RO will be smaller for same salt removal Assuming 10 mgd blended flow with 20% TDS reduction 54
55 Footprint Constraints: When the size of footprint is important Impact of Footprint on Blend Cost Comparison (10 mgd with 20% salt reduction) Footprint Cost ($/ft 2 ) MF-RO ($/ac-ft blend) EDR ($/ac-ft blend) MF-RO:EDR $0 $78.9 $ $10 $79.3 $ $100 $82.6 $ $1000 $116 $
56 Brine Disposal Method: When disposal of concentrate is difficult Significant consideration for inland utilities RO system will have: Less brine flow More concentrated brine Anti-scalants in the brine Brine disposal cost will vary based on variety of factors including location, method, quality 56
57 Brine Disposal Method: When disposal of concentrate is difficult Examples of brine disposal methods: Brine line/ocean outfall Zero-liquid discharge (e.g., ponds, crystallizer) Deep-well injection Trucking 57
58 Brine Disposal Method: When disposal of concentrate is difficult Impact of Brine Disposal Cost on Blend Cost Comparison (10 mgd with 20% salt reduction) Disposal Cost ($/ac-ft brine) MF-RO ($/ac-ft blend) EDR ($/ac-ft blend) MF-RO:EDR $0 $79 $ $100 $83 $ $1,000 $116 $ $10,000 $446 $
59 Other Factors Size of treatment facilities Chemical price volatility Tax implications of capital investment Deviations from cost analysis assumptions Discount rate of 6% Facility lifespan of 20 years Electricity costs Labor rate (average cost of $65/h) 59
60 60 Conclusions
61 Conclusions Study first to provide full-scale cost comparison Both technologies feasible for desalting recycled water EDR less expensive (~4%) than MF/RO on salt removal basis MF/RO has higher capital costs, but less maintenance labor required Cost comparison close enough that site specific impacts on cost must be considered Seasonal usage will favor EDR (lower capital cost) High brine disposal and/or land use cost will favor RO 61


62 Acknowledgements City of San Diego 62