National Renewable Energy Laboratory
|
|
|
- Silvester Campbell
- 5 years ago
- Views:
Transcription

1 National Renewable Energy Laboratory National Renewable Energy Laboratory David Warner Lee Boughey National Renewable Energy Laboratory Presented to UFTO May 8, 2002 Operated for the U.S. Department of Energy by Midwest Research Institute Battelle Bechtel

2 Earth Lights! 2
3 World Population Growth Billions Developing Countries Industrial Countries Source: Population Reference Bureau 3
4 Energy and Economic Development GDP Per Capita ($000/person) Poverty Ethiopia El Salvador Bangladesh Japan France United Kingdom Mexico China Affluence South Korea Poland Russia United States Energy Consumption Per Capita (BTU/person) Source: Energy Information Administration, International Energy Annual 1998 Tables E1, B1, B2; Mike Grillot, 5/17/00 Gross Domestic Product per capita is for 1997 in 1990 dollars. Energy Consumption per capita is
5 U.S. Energy Consumption by Source Non-hydro Renewables Quadrillion BTUs Hydro Nuclear Natural Gas 20 Wood Crude Oil 0 Coal Source: , Energy Perspectives: A Presentation of Major Energy and Energy-Related Data, U.S. Department of the Interior, 1975; , Annual Energy Review 1996, Table 1.3. Note: Between 1950 and 1990, there was no reporting of non-utility use of renewables , Annual Energy Review 1999, Table F1b. 5

6 Domestic Production with Transportation Use Million Barrels per Day Source: EIA Annual Energy Review 1997 Tbls 2.1, 5.1 and Annual Energy Outlook 1999 Tbl 11 6

7 U.S. Dependence on Foreign Oil Have Oil Saudi Arabia 25% Iraq 10% UAE 9% Kuwait 9% Iran 9% Venezuela 6% Russia 5% Mexico 5% Libya 3% China 3% Nigeria 2% U.S. 2% Source: International Energy Annual 1998 (EIA), Tables 1.2 and 8.1. Use Oil U.S. 26% Japan 8% China 6% Germany 4% Russia 3% Italy 3% France 3% S. Korea 3% Canada 3% England 3% Brazil 3% India 3% The U.S. uses more than the next 5 highest consuming nations combined. 7
8 National Security Events Related to Major Disruptions in Fuel Supply Source: Barrels of oil per day removed from world markets as a result of conflicts. 8

9 Atmospheric Concentration of CO 2 Atmospheric CO 2 Concentration (PPMV) Year Source: Adapted from W.M. Post, T.H. Peng, W.R. Emanuel, A.W. King, V.H. Dale, and D. DeAngelis. American Scientist, The Global Carbon Cycle. 9
10 Shell Sustained Growth Scenario 1500 Surprise Geothermal joules Exa Solar Biomass Wind Nuclear Hydro Gas Oil &NGL Sources: 1995; Shell, The Evolution of the World s Energy Systems, 1995 Coal Trad. Bio. 10
11 U.S. Renewable Energy Resources Solar Wind Megajoules/m 12 < > m/s mph m/s mph >7.0 m/s mph Biomass Geothermal Agricultural resources residues Wood resources and residues Agricultural and wood residues Low inventory o Temperature <90C o Temperature >90C Geopressured resources 11
12 National Renewable Energy Laboratory Operated for the U.S. Department of Energy by Midwest Research Institute Battelle Bechtel 12
13 Major DOE National Laboratories h Pacific Northwest INEEL National Renewable Lawrence Berkeley Energy Laboratory h Lawrence Livermore h Argonne Oak Ridge h NETL h Brookhaven Los Alamos Sandia Defense Program Labs n Office of Science Labs Energy Efficiency and Renewable Energy Lab Environmental Management Lab Fossil Energy Lab 13
14 Formation of SERI/NREL 1974 Solar Energy Research Development and Demonstration Act; Section 10, Public Law National Research Council: Establishment of a Solar Energy Research Institute Committee" Report; Colorado site selected MRI 1977 SERI opened doors 1991 President Bush renamed the Solar Energy Research Institute to the National Renewable Energy Laboratory and elevated its status in the laboratory system 14

15 National Renewable Energy Laboratory ionly national laboratory dedicated to renewable energy and energy efficiency R&D iresearch spans fundamental science to technology solutions icollaboration with industry and university partners is a hallmark iresearch programs linked to market opportunities 15


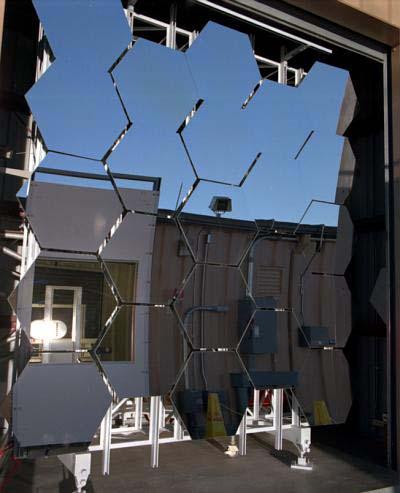
16 Major NREL Technology Thrusts Supply Side Wind Energy Solar Photovoltaics Concentrating Solar Power Solar Buildings Biomass Power Biofuels Geothermal Energy Hydrogen Superconductivity Distributed Power Demand Side Hybrid Vehicles Fuels Utilization Buildings Energy Technology Federal Energy Management Advanced Industrial Technologies Cross Cutting Basic Energy Science Analytical Studies International Programs 16


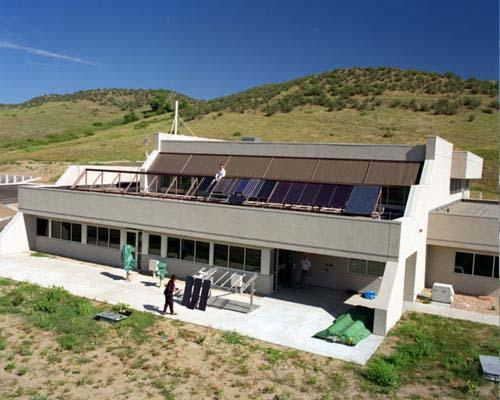
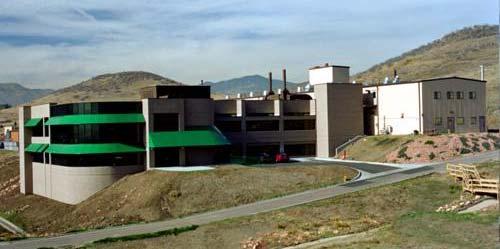
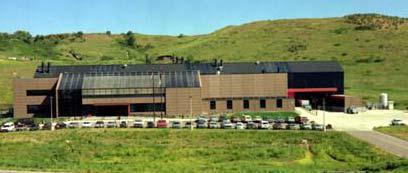
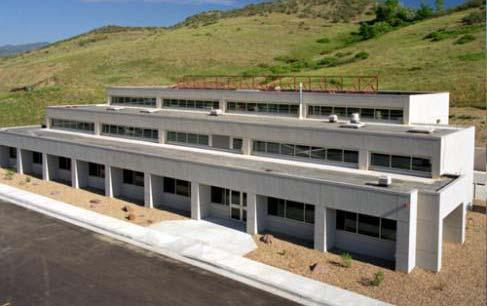
17 South Table Mountain Site 17


18 National Wind Technology Center Industrial User Facility 18
19 Renewable Energy Cost Trends Cost of Electricity ( /KWH) PV Wind Geothermal Source: Billman, Advances in Solar Energy submission, 1/8/
20 Agenda 9:00 am 9.50 am Solar Programs Overview 10:00 am 10:50 am Distributed Energy Resources and Hydrogen 11:00 am 11:30 am Superconductivity Program 11:45 am 12:50 pm Energy Analysis Overview / Lunch 1:00 pm 1:50 pm Biofuels Overview 2:00 pm 2:50 pm Bioenergy Overview 3:30 pm 5:00 pm Wind Power / Hybrid Test Facility Overview 20