Pore-Scale micro-ct imaging: Non-Wetting Phase Cluster Size Distribution as a Function of Interfacial Tension
|
|
|
- Jerome McGee
- 5 years ago
- Views:
Transcription
1 TCCS , Trondheim, Norway Pore-Scale micro-ct imaging: Non-Wetting Phase Cluster Size Distribution as a Function of Interfacial Tension Apostolos Georgiadis 1,2, Steffen Berg 1, Geoffrey Maitland 2 and Holger Ott 1 1.Shell International Global Solutions BV, The Netherlands Holger.Ott@shell.com 2.Department of Chemical Engineering, Imperial College London, United Kingdom A.Georgiadis07@ic.ac.uk 1
2 Introduction Motivation: Energy Demand and Greenhouse Gas Emission Shell Imperial Collaboration on Clean Fossil Fuels Partially Miscible Phases of (aqueous + hydrocarbon + gas) systems Phase Behaviour and other Thermophysical Properties Interfacial Properties / Fluid Displacements in Porous Media Rock / Fluid Reactive Interactions (CO 2 / H 2 S) Reservoir Conditions Experiments - Molecular Based (SAFT) Modelling Achieving More Realistic Reservoir Simulation Enhanced Oil recovery Carbon Storage / Capillary Trapping 2


.")


 3. Courtesy of S.")
3 Capillary Trapping Enhanced Oil Recovery / CCS Trapped Oil Oil Surrounding Water μm 1. Dawe, R.A., Ala, M. & Royal School of Mines (Great Britain). (1990) Reservoir physics at the pore scale. Seventy-five years of progress in oil field science and technology, p IPCC, Carbon Dioxide Capture and Storage, 2005 ( 3. Courtesy of S. Iglauer and C. Pentland, Imperial College Lodnon,

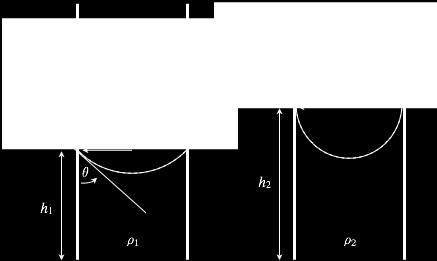


4 Interfacial Tension Young equation Laplace equation Capillary Pressure 4


5 Interfacial Tension Capillary de-saturation Larry Lake de-saturation curve Measured Interfacial Tensions 4 Surf1 Surf2 4. Lake, L. W. Enhanced Oil Recovery. Prentice Hall, Upper Saddle River, NJ (1980) 5

6 Secondment at Shell, Rijswijk, NL Rock and Fluid Physics Group Experimentally determined Flow diagram of flooding apparatus Shell IEP, Rijswijk, NL 6


7 Results: μ-ct core flooding Filtering and Thresholding Resolution 11.3 μm/pixel Filtered and segmented using ImageJ visualization in Aviso. Shell GSI, Rijswijk, NL 7


8 Results: μ-ct core flooding Filtering and Segmenting 0 PV 5 PV 1 PV 200 PV Filtered and segmented using ImageJ visualization in Aviso. Shell GSI, Rijswijk, NL 8
9 Results: μ-ct core flooding [H 2 O + DTAB] + n-decane Direct Imbibition and Post-Saturation Imbibition Experiments 9
10 Results: μ-ct core flooding [H 2 O + DTAB] + n-decane 10
11 Results: μ-ct core flooding [H 2 O + DTAB] + n-decane 11
12 porosity, saturation REV N(l) REV Shell-Imperial Grand Challenge Results: μ-ct core flooding Cluster Size Distribution porosity N-decane sat. N(l)~l pore radius distribution drainage 1 PV 5 PV 200 PV sat imbibition 5 PV 30 PV 30 PV, 2 th 30 PV, 3 th 30 PV, 4 th 30 PV, 5 th 30 PV, 6 th averaging window (mm) pore length distr cluster length l ( m) 10-3 Representative Elementary Volume Invasion percolation theory: 12
13 volume largest cl./total volume cluster length ( m) Shell-Imperial Grand Challenge Results: μ-ct core flooding Largest Cluster Size st 2 nd 4 th 6 th 1 th, drain+imbib, pos. 1 5 th, imbib, pos. 1 1 st, drain+imbib, pos rd 5 th largest cluster 1 st, drainage + imbibition, pos. 1 1 st, drainage + imbibition, pos. 2 5 th, imbibition, pos. 1 1 st -6 th, imbibition 30 PV, pos decane saturation (PV) largest cluster 2 nd 3 rd 4 th 5 th 6 th decane saturation (PV) Increase of largest cluster with saturation Decrease of next smaller ones 13
14 Summary and Conclusions Interfacial tension representative reservoir fluids range Flooding experiments at ambient conditions with micron resolution Interfacial tension influence on saturation small dependence Trends follow capillary de-saturation curve Cluster size distribution power law (percolation theory) Largest cluster size increase with saturation Single cluster dominates the saturation (65 95 %) Next steps: different Ca HPHT flooding with brine/co 2 sintered glass and sandstone 14

15 Acknowledgments Shell Global Solutions International BV Rock & Fluid Physics Team John Coenen, Fons Marcelis, Kees De Kloe, Axel Makurat Imperial College London Department of Chemical Engineering Martin Trusler Thermophysics Group Alexander Bismarck PaCE Group George Jackson MSE Group 15
16 TCCS , Trondheim, Norway Pore-Scale micro-ct imaging: Non-Wetting Phase Cluster Size Distribution as a Function of Interfacial Tension Apostolos Georgiadis 1,2, Steffen Berg 1, Geoffrey Maitland 2 and Holger Ott 1 1.Shell International Global Solutions BV, The Netherlands Holger.Ott@shell.com 2.Department of Chemical Engineering, Imperial College London, United Kingdom A.Georgiadis07@ic.ac.uk 16