Irrigation modeling in Prairie Ronde Township, Kalamazoo County. SW Michigan Water Resources Council meeting May 15, 2012
|
|
|
- Miles Terry
- 5 years ago
- Views:
Transcription
1 Irrigation modeling in Prairie Ronde Township, Kalamazoo County SW Michigan Water Resources Council meeting May 15, 2012

2 Development of a Groundwater Flow Model

3 INFLOWS Areal recharge from precipitation that percolates through the unsaturated zone to the water table Recharge from losing streams, lakes, and wetlands OUTFLOWS Discharge to streams, lakes, wetlands, and springs Evapotranspiration Ground-water pumpage
4 Develop Conceptual Model A conceptual model is a representation of the system upon which the computer model is based Consists of the definition of the aquifers and confining units, the directions of groundwater flow, and the boundaries of the system
5 Develop Numerical Model Model grid and boundaries Layer geometry Hydraulic conductivities/leakances Recharge Lake and stream locations and conductances Well locations and withdrawal rates Initial estimate of water levels
6 Development of Kalamazoo Model Multiple competing uses (municipal, manufacturing, and private wells) Some reductions in lake and stream levels Natural and human-induced stresses on the groundwater system led to concerns about the long-term availability of groundwater for people to use and for replenishment of lakes and streams
7 Kalamazoo Model Scenarios Evaluate changes in water levels with reductions in recharge Climate variation Urban areas Evaluate changes in water levels with changes in withdrawals Irrigated areas Projected 2010 pumping rates Evaluate transient changes in water levels under seasonal and monthly time scales
8 Possible Effects of Changes in Recharge Simulated steady-state state ground-water levels in the upper aquifer generally were higher in some areas during the average recharge conditions than during reduced recharge conditions. Simulated steady-state state streamflows generally are lower for the reduced recharge conditions than for average recharge conditions.
9
10 Selection of Prairie Ronde Township for additional investigation Area within Kalamazoo model area with measured streamflows and few lakes Area with groundwater withdrawals for irrigation
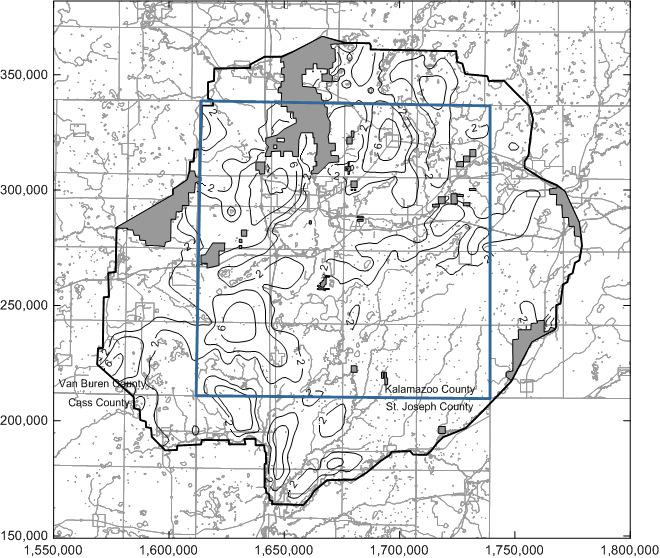
11 Kalamazoo Model Area Prairie Ronde Township 350, ,000 NORTHING, IN FEET 250,000 Kalamazoo County 200, ,000 1,550,000 1,600,000 1,650,000 1,700,000 1,750,000 1,800,000 EASTING, IN FEET
12 Location of irrigation withdrawals 250, ,000 Layer 1 to 12 Layer 2 to Layer 3 to 34 SW 4 to diversion , ,000 NORTHING, IN FEET 230, , , , , ,000 1,605,000 1,610,000 1,615,000 1,620,000 1,625,000 1,630,000 1,635,000 1,640,000 1,645,000 1,650,000 1,655,000 EASTING, IN FEET

13 Prairie Ronde Township
14 Approach Regrid model in Prairie Ronde Township area (cell size in township reduced to 100 x 100 ft) Convert river cells within township representing Flowerfield Creek to stream cells Develop transient model (initial steady-state state stress period followed by monthly stress periods representing 5 years / 30 years) Incorporate irrigation withdrawals
15 Groundwater Withdrawals Estimated Pumping Irrigation pumping, mgd Pumping from other wells, mgd 0 ss Jan Feb Mar Apr May Jun Jul Aug Sep Oct Nov Dec Time 0 partial irrigation all irrigation wells pumping most irrigation wells pumping other wells
16 Variation in Recharge Recharge, in/yr Jan Feb Mar Apr May Jun Jul Aug Sep Oct Nov Dec Month average recharge reduced recharge
17 Flow from Flowerfield Creek Flow, cfs Year no irr for 5 yrs partial irr for 5 yrs with 3 yrs low rch most irr wells pumping for 5 yrs with 3 yrs low rch all irr wells pumping for 5 yrs with 3 yrs low rch partial irr for 5 yrs most irr wells pumping for 5 yrs all irr wells pumping for 5 yrs
18 Change in flow at end of August Scenario Flow, cfs Percent reduction no irrigation 5 yrs average recharge 25.0 Partial Irrigation 5 yrs average recharge Partial Irrigation 2 yrs ave rch, 3 yrs low rch Most Irrigation 5 yrs average recharge Most Irrigation 2 yrs ave rch, 3 yrs low rch All Irrigation wells pumping 5 yrs average recharge All Irrigation wells pumping 2 yrs ave rch, 3 yrs low rch
19 Irrigation Pumping and Flow Reductions Jan Feb Mar Apr May Jun Jul Aug Sep Oct Nov Dec Reductio n in flow, cfs (all irrigation wells pumping, average recharge fo r 5 years) Reductio n in flow, cfs (all irrigation wells pumping, average recharge fo r 2 years, reduced recharge for 3 years) M onthly irrigatio n pumpage, cfs
20 30-year Model Scenarios No irrigation wells pumping Irrigation wells pumping at average rates Irrigation pumping increased by 20 % for years 3-53 Average recharge rates for 30 years Recharge rates representative of rates observed from
21 Flow in Flowerfield Creek with varying pumping and recharge rates Flow, cfs Year no irr for 30 yrs all irr w ells pumping for 30 yrs all irr w ells pumping for 30 yrs w ith 3 yrs low (90%) rch all irr w ells pumping for 30 yrs w ith 3 yrs low (75%) rch all irr w ells pumping for 30 yrs w ith 3 yrs low (75%) rch and 3 yrs increased pumping
22 Change in flow during 30-year run Scenario Flow, cfs (end of August yr 5) Flow, cfs (end of yr 30) no irrigation average recharge All Irrigation, average rates average recharge All Irrigation, average rates 90% recharge, yrs All Irrigation, average rates 75% recharge, yrs All Irrigation, incr yrs % recharge, yrs
23 Comparison with Screening Tool Screening tool depletion (sum for 42 irrigation wells): ~6 cfs Groundwater model (reduction in flow at end of August with average recharge conditions): ~4 cfs
24 Variation in precipitation with overall, pre-1970 and post-1970 averages Inches per year Annual Average 10 pre1970 post1970 Linear (Annual) Year
25 Estimated recharge rates for 30 year scenario
26 Flow in Flowerfield Creek with varying pumping and recharge rates