Assessing Water Use and Availability Trends in New Hampshire
|
|
|
- Felicia Ellis
- 5 years ago
- Views:
Transcription
1 Assessing Water Use and Availability Trends in New Hampshire Brandon Kernen, PG NH Department of Environmental Services (603)
2 Existing Groundwater Use and Availability Initiatives in NH 1) Groundwater Level Trend Analysis 2) Water Use Estimation Tools 3) Water Availability Tools
3 Groundwater Level Trend Project Objectives 1) Assess groundwater level trends in bedrock in NH (statewide and regionally) 2) Assess if trends are significant and reason for trends Water use Climatic Well construction practices Local effects (geology, topography, density of development etc.) 3) Make recommendations regarding groundwater level monitoring
4 Why?? Frequent statements from drillers and the public about running out of water Documented changes in New England Hydrology (growing season increase, stream flow, ice out/spring run-off, increased water use, land development) 2005 Groundwater model of the seacoast bedrock aquifers predicted impacts to water levels due to: 1) Climate change 2) Water use 3) Impervious surfaces 4) Sewering USGS SIR Known trouble spots for private and public wells
5 Background Information 50% of NH residents obtains their drinking water from bedrock wells 40% Private wells 10% Public water supply Approximately 210,000 bedrock wells in NH Well construction reports have been submitted to the state since 1984 Population of NH has almost doubled since 1984
6 Number of Bedrock Water Supply Wells Constructed By Year in NH Year Number of Wells

7 NH Monitoring Well Network Prior to 2007 Only one well in bedrock!
8 Existing SWL Data Sets Reviewed Contamination Sites (pump and treat effects, shallow bedrock, well integrity) Canada Quebec Province established and quickly unfunded water level monitoring sites Nova Scotia Good data but different geology Maine s Monitoring Network Massachusetts 3 bedrock monitoring wells Water levels at large groundwater withdrawals sites in NH (30-40 wells) Well construction records in NH

9 Majority of bedrock well monitoring sites initiated within the last 7-10 years
10 Figure 1b: Water Level Elevation in Pelham, MA [MA-PDW (740 ft Deep)] Elevation (ft below ground surfacel) R 2 = /25/ /14/1984 5/7/ /28/1995 4/19/ /10/2006
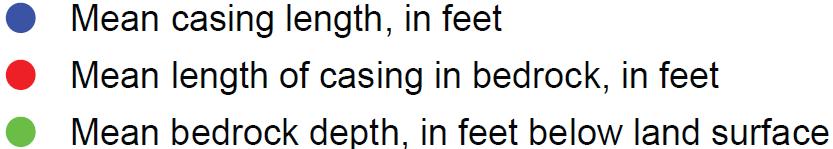
11 Information Contained on New Well Construction Records Well driller info. Address/tax map Location coordinates (varies/sometimes) Well owner name Date of well installation Purpose of well Reason for well Type of well Depth of well Depth to bedrock Casing length Yield test info Static water level Static water level date Overburden material description Hydrofracture info Casing/grout information Accuracy and completeness of information varies and has improved over time due to enforcement efforts.
12 What We Did Analyzed 60,000 reported values of water levels over the period of reported on well construction logs 50% wells geolocated (gps, E-911, digital tax maps) Also analyzed other well characteristics Total well depth Length of well casing Well yield Depth to bedrock Elevation Proximity to topographic relief Hillside orientation Geology Deepened and replacement well trends Population density

13 Location of Wells Constructed Since 1984 with Reported Water Levels Records provide a high quantity of relatively low quality data for statistical analyses (64% of water levels measured end in a 0 or 5 )
14 Summary of Findings Apparent deepening of static water levels of about 14 feet in newly constructed wells from (the rate is double in some areas) Depth of wells, length of casing, length of casing into bedrock also increased in this time period Wells on hill slopes or at higher elevations generally have deeper water levels, lower yields and tend to fail more often Water levels in wells located on high areas on south facing slopes are generally deeper than north facing slopes Deepening of SWL in some towns is twice the rate of deepening in other towns Not able to statistically determine if increases in water use is a cause for lower static water levels (too many changing variables with similar trends).
15 Probable Primary Cause of Lower SWL in Newly Constructed Wells Lower heads in deeper wells coupled with increase casing length in bedrock diminish contribution of water from the overburden/shallow fractures result in deeper bedrock water levels
16
17
18

19 Mean Static Water Level (feel below land surface) SWL are Generally Deeper on South Facing Hillsides Potential Reasons Slopes in the southerly direction are commonly steeper in NH Increased evaporation and transpiration Slight differences in rainfall/temperature
20 How this Information Can Be Used Determine if we have adequate water level monitoring data Assess if our well construction regulations are impacting the viability of new wells Determine if well yields reported by well drillers are reliable Develop guidance/model regulations to ensure adequate well yield based on: Local conditions (geology, topography, hillside orientation) Site specific well construction and testing recommendations Density of Development
21 Existing Groundwater Use and Availability Initiatives in NH 1) Groundwater Level Trend Analysis 2) Water Use Estimation Tools 3) Water Availability Tools
22 What Data is Available to Estimate Water Use in New Hampshire?
23 Measured Water Use Data Available in New Hampshire Water use for all withdrawals, transfers and discharges that average over 20,000 gallons per day NPDES permitted discharges Public water supplies
24 Water Use that Needs to Be Estimated (not directly measured in NH) Domestic private wells Non domestic private wells extracting <20,000 gallons per day Wastewater discharges without a NPDES permit & <20,000 gallons per day
25 Tools to Estimate Water Use in New Hampshire - Methodology Methods for and estimates of 2003 Projected Water Use in the Seacoast Region, Southeastern NH (USGS OFR ) Methods for Estimating Withdrawal and Return Flow by Census Block for 2005 and 2020 for New Hampshire (USGS OFR )
26 Tools to Estimate Water Use in New Hampshire Data Tools Census Block Data (people, households, demographics) Water & sewer system distribution system coverage is GIS Population Projections Dun and Bradstreet Data (type, location and number of employees for businesses information must be purchased) Hydrography data and topographic maps to delineate watershed boundaries
27 Calculation of Consumptive Water Use Water Withdrawals Domestic Self Supplied Domestic Water System Withdrawals Non Domestic Water System Withdrawals Non Domestic Withdrawals Registered Withdrawals Water Returns Domestic On-site Non Domestic On-site - Registered = Discharges/Returns Non Registered Sewer System Returns Consumptive Use Data in red needs to be estimated
28 USGS OFR
29 Estimating Water Use (non registered non domestic water use) Use Dun and Bradstreet Data to Identify Water Users Multiply water use by 0.90 to estimate return flow Determine if return flow goes to onsite or sewer discharges USGS OFR
30 Estimating Water Use (non registered domestic water use) 1) Estimate number of people that obtain water from private wells and non registered public water systems and multiply by 75 gallons/person 2) Estimate that 84% of the water use is returned onsite or a sewer system Water use figures based on metered data as documented in USGS OFR
31 Estimating Future Water Use (options) Broad Brush Approach - Multiply increased water use by population projections/assume more water is extracted in the vicinity of existing sources Refined Approaches Utilize Regional Traffic Demand Models Utilize town Build Out Analysis which has been completed by regional planning commissions in some regions of the state. Analyze master plan and zoning and make development estimates
32 Existing Groundwater Use and Availability Initiatives in NH 1) Groundwater Level Trend Analysis 2) Water Use Estimation Tools 3) Water Availability Tools
33 What Data is Available to Estimate Water Availability?
34 Available Data for Estimating Regional Availability Well construction reports dating back to 1984 (well yield trends, replaced wells, deepened wells) Watershed recharge and streamflow frequency estimation tool (USGS -des.nh.gov/organization/commissioner/pip/factsheets/geo/ documents/geo- 9.pdf Stratified Drift Aquifer Studies (USGS) Surficial Geology Mapping (USGS & NHGS) Seacoast Geologic Data Viewer (recharge, depth to bedrock, water use, well yield trend) - App/
35 Water Availability Concepts Aquifer Capacity Ensure withdrawals do not exceed the rate of recharge to aquifers on average and that adequate seasonal aquifer storage exists for high water use/low recharge periods (prevent long-term aquifer dewatering) Well Interference Ensure multiple pumping wells do not superimpose drawdowns unreasonably over one another. Watershed Capacity Ensure consumptive water uses do not adversely impact surface water baseflow (usually the limiting factor)
36 Question: How Much Water Do We Have? Answer: In most cases it depends on how much streamflow degradation is acceptable.
37 Methods to Estimate Streamflow Needs 1) Hydrological 2) Hydraulic Rating 3) Habitat Rating 4) Holistic
38 Hydrological Methods Used in the Northeast Amount of Water that Can Be Consumed: NHDES 4% of the Seasonal Q60 (flow that is exceeded 60% of the time) NJDEP 25% of the difference between median September flow and 7Q10 flow State of Rhode Island 50% of 7Q10 MADEP 7Q10 or 50% of August median flow


39 What do we need to do? Evaluate on a regional basis the amount of water that may be consumed Low-Flow Statistics Existing and projected withdrawals and returns Identify watershed capacity Withdrawals Returns Watershed Capacity
40
41
42