Results of Morris Bridge Sink Pumping Test Hillsborough County, Florida Final Report
|
|
|
- Ronald Farmer
- 5 years ago
- Views:
Transcription


1 Results of Morris Bridge Sink Pumping Test Hillsborough County, Florida Final Report Hydrologic Evaluation Section Southwest Florida Water Management District January 2010
2
3 Results of Morris Bridge Sink Pumping Test. Hillsborough County. Florida January 2010 The geological evaluation and interpretation contained in the report entitled Results of Morris Bridge Sink Pumping Test, Hillsborough County, Florida has been prepared by or approved by a Certified Professional Geologist in the State of Florida, in accordance with Chapter 492, Florida Statutes. Ro aid J. Basso, Jr. Professional Geologist License No. PG
4
5 ContentsContents 1.0 INTRODUCTION Acknowledgements SITE INFORMATION Background Previous Long-term Pumping Tests Pumping Test Emergency Pumping Test HYDROGEOLOGY PUMPING TEST SETUP AND MONITORING PROGRAM Morris Bridge Sink Pumping Test Monitored Water Levels Morris Bridge Sink and Nursery Sink Wetlands Wells Background Data Wells Rainfall Data Water Quality Testing Morris Bridge Sink and Wells Analytes Collected Groundwater Sampling Site Selection Surface Water Sampling Site Selection PUMPING TEST RESULTS Rainfall Discharge Rates Background Levels Pumping Test Drawdown Sink Drawdown Wetland Drawdown Surifical Aquifer Drawdown Upper Floridan Aquifer Drawdown Domestic Well Water Level Change Upper Floridan Aquifer - Estimation of Hydraulic Parameters Distance Drawdown Method Cooper-Jacob Straight Line Method Hantush-Jacob Leaky Aquifer Method Well Survey BLUE SINK WATER QUALITY RESULTS Groundwater Quality Sampling Results Surface Water Quality Sampling Results Sonde Deployment - Results Water Quality Issues SUMMARY AND CONCLUSIONS REFERENCES... 48
6 Figures Figure 1 Location of Morris Bridge Sink... 2 Figure 2 Location of the pipeline used to discharge water from Morris Bridge Sink to the TBC Upper Pool... 6 Figure 3 Location of pipeline to move water between the TBC Upper Pool to Middle Pool... 7 Figure 4 Location of Monitor Wells and Surface Water Stage Recorders used in the Morris Bridge Sink Pumping Test... 9 Figure 5 Location of Upper Floridan aquifer background monitor wells Figure 6 Linear regression of background water level trends at the LHFDA22 and Romp 68 UFA wells Figure 7 Location of surficial aquifer background monitor wells Figure 8 Linear regression of background water level trend at Romp DV-1, Blackwater Creek Elapp, and Debuel Road surficial aquifer wells Figure 9 Location of the S-155 and S-163 rainfall stations Figure 10 Groundwater quality sampling sites for the Morris Bridge Sink pumping test Figure 11 Surface water quality sampling sites during the Morris Bridge Sink pumping test Figure 12 Rainfall history at the S-155 station from April 1 to June 1, Figure 13 Rainfall history at the S-163 station from April 1 to June 1, Figure 14 Morris Bridge Sink withdrawals during the SWFWMD 30-Day Test and TBW s emergency order period Figure 15 Drawdown in Morris Bridge Sink stage during the duration of the 30-day test Figure 16 Drawdown in the Upper Floridan aquifer from the Morris Bridge Sink pumping test Figure 17 Distance-drawdown plot of all UFA monitor wells and Nursery Sink at 7 days Figure 18 Drawdown versus time analysis using the Cooper-Jacob method for the Idlewood well Figure 19 Drawdown versus time analysis using the Cooper-Jacob method for the TBW 516 well Figure 20 Drawdown versus time analysis using the Cooper-Jacob method for the FL-MB-550 well Figure 21 Drawdown versus time analysis using the Cooper-Jacob method for the FL-MB-750 well Figure 22 Drawdown versus time analysis using the Cooper-Jacob method for Nursery Sink Figure 23 Drawdown versus time analysis using the Cooper-Jacob method for the FL-MB-2200 well Figure 24 Drawdown versus time analysis using the Hantush-Jacob method for the Idlewood well Figure 25 Drawdown versus time analysis using the Hantush-Jacob method for the TBW 516 well Figure 26 Drawdown versus time analysis using the Hantush-Jacob method for the FL-MB-550 well Figure 27 Drawdown versus time analysis using the Hantush-Jacob method for the FL-MB-750 well... 37
7 Figure 28 Drawdown versus time analysis using the Hantush-Jacob method for Nursery Sink Figure 29 Drawdown versus time analysis using the Hantush-Jacob method for the FL-MB-2200 well Figure 30 Hantush-Jacob leaky aquifer method type curves Figure 31 Select water quality parameters collected from Morris Bridge domestic wells, ROMP Morris Bridge Idlewood UFA, and Morris Bridge Sink, during the baseline and final sampling events Figure 32 Select water quality parameters collected from Morris Bridge Sink pumping test during the baseline and final sampling events Figure 33 Morris Bridge Sink data-sonde results Tables Table 1 Monitor site distance from Morris Bridge Sink and construction details of monitor wells Table 2 Water quality parameters analyzed for the Morris Bridge Sink test Table 3 Well construction information for the domestic wells sampled as part of the Morris Bridge Sink test Table 4 Daily rainfall measured at the S-155 and S-163 stations from April1 to June 1, Table 5 Morris Bridge Sink withdrawals during the SWFWMD and TBW pumping periods (April 13 through May 22, 2009) Table 6 Drawdown due to pumping Morris Bridge Sink at four mgd for 30 days Table 7 Drawdown at nearby domestic wells during the Morris Bridge Sink pumping test Table 8 Hydraulic parameters for the Upper Floridan aquifer determined from the Morris Bridge Sink Pumping Test Table 9 Iron Values from domestic wells near the Morris Bridge Sink Table 10 Groundwater quality value ranges from wells sampled during the Morris Bridge Sink pumping test Table 11 Surface water quality value ranges for the Morris Bridge Sink test Appendices Appendix A - Morris Bridge Idlewood well construction summary. Appendix B - Water quality results of samples collected for the Morris Bridge Sink Pumping Test. Appendix C - Water level elevation history during the Morris Bridge Sink Pumping Test. Appendix D - Measured water level drawdown during the Morris Bridge Sink Pumping Test. Appendix E - Measured water levels from nearby domestic wells during the Morris Bridge Sink Pumping Test. Appendix F - Well inventory in the vicinity of Morris Bridge Sink. Appendix G - Domestic well water quality trends observed during the Morris Bridge Sink Pumping Test. Appendix H - Sink and TBC water quality trends observed during the Morris Bridge Sink Pumping Test.
8
9 Results of the Morris Bridge Sink Pumping Test, Hillsborough County, Florida By Ron Basso, P.G. and Carol Kraft 1.0 INTRODUCTION Morris Bridge Sink was evaluated as a potential Hillsborough River augmentation source by the Southwest Florida Water Management District (District) in April 2009 by pumping approximately six cubic feet per second (cfs) or four million gallons per day (mgd) for 30 days. The pumping test was conducted to determine if four mgd could be sustainably developed from Morris Bridge Sink during the spring dry season to assist the City of Tampa in meeting the minimum low flow of 24 cfs established for the lower Hillsborough River. The Morris Bridge Sink project, along with water from Sulphur Spring, the Tampa Bypass Canal, and Blue Sink, are all sources being evaluated by the City of Tampa and the District to help meet the lower Hillsborough River minimum flow criteria. An extensive monitoring program was developed for the Morris Bridge Sink pumping test to evaluate potential impacts to nearby wetlands and Upper Floridan aquifer wells. Monitoring equipment was installed by the District during the fall of This report documents the physical characteristics of the site, the pumping test set-up, and results of the 30-day test. 1.1 Acknowledgements The authors would like to express their gratitude for the contributions of District staff that include Mike Holtkamp, P.E., Director of the Operations Department for the selection of the pump contractor, coordination of District staff, and managing the 30- day pumping test. Special thanks to District employees Jim GaNun for pumping discharge measurements, Ken Romie for data retrieval, Roberta Starks for water quality sampling, David Carr for environmental assessments, Jason Patterson for the domestic well information, and Tiffany Horstman for the summary of the Idlewood well installation. 2.0 SITE INFORMATION 2.1 Background Morris Bridge Sink (Sink) is located about 0.6 miles south of the Hillsborough River in a rural area northeast of Tampa (Figure 1). The Sink is positioned just east of Interstate 75 and near the Tampa Bypass Canal (TBC). It is approximately 135 feet (ft) in diameter and 200 ft deep. Another sink, called Nursery Sink, is located about 750 ft east of Morris Bridge Sink. Nursery Sink is 80 ft in diameter and is 245 ft deep (Stewart, 1977). 1

10 Figure 1. Location of Morris Bridge Sink. 2
11 Using water pumped from the Sink is proposed as a potential water source option that could provide up to six cfs (four mgd) during the dry season to assist the City of Tampa in meeting the minimum low flow for the Hillsborough River. The estimated quantities of water available from the Sink are based on data collected during the Tampa Bay Water s emergency pumping in Previous Long-term Pumping Tests Two previous long-term pumping tests have been performed at Morris Bridge Sink (Stewart, 1977 and LBG 2001). One test was performed by the City of Tampa in 1972 to evaluate the Sink as a future water supply source. The second test was performed in 2000 as an emergency project to pump water from the Sink to the Hillsborough River Reservoir for additional water supply during extreme drought conditions Pumping Test In June and July 1972, the City of Tampa (City) initiated a pumping test to evaluate the Sink as a future water source for public supply. During the test, the Sink was pumped at 4,200 gallons per minute (gpm) or 6.05 mgd for 17 days from June 9 to June 26 and at 4,000 gpm or 5.76 mgd for eight days from June 28 to July 6 (Stewart, 1977). Water was discharged to a lined ditch into a swampy area near Cow House Creek. Water levels were measured in Morris Bridge Sink, Nursery Sink, an east well, a north well, a nearby irrigation well, and the Hillsborough River. The United States Geological Survey (USGS) analyzed the pumping test and the results were published in the report entitled Hydrologic Effects of Pumping a Deep Limestone Sink near Tampa, Florida, U.S.A. by J. Stewart in The reported transmissivity from the pumping test varied from 130,000 to 200,000 feet squared per day (ft 2 /day) Emergency Pumping Test In response to extreme drought conditions in May 2000, municipal water supplier Tampa Bay Water (TBW) installed pumps at the Sink to augment flow to the City of Tampa's Hillsborough River Reservoir. Pumping began on May 30, 2000 and was sustained at an average rate of about 6.7 million gallons per day (mgd) until August 14, TBW's consultant Legette, Brashears, and Graham, Inc. (LBG) analyzed water-level data from a number of wells, the Sink, and nearby Nursery Sink during the 2000 pumping test (LBG, 2001). They concluded that maximum drawdown in Morris Bridge Sink was 7 ft at a discharge rate of 6.7 mgd. Maximum drawdown in Nursery Sink, located about 750 ft east of Morris Bridge Sink was 2.6 ft. Maximum drawdown in nearby Upper Floridan aquifer wells was 4 ft at 500 ft, 2 ft at a distance of 870 ft, and 1.4 ft at a distance of 2,500 ft away from the Sink. Hydraulic parameters calculated from the 2000 pumping test indicated a transmissivity of 146,000 ft 2 /d and storage of 0.22 (LBG, 2001). 3
12 Domestic well complaints from a one-mile radius around the Sink were received with 15 out of 23 complaints attributed to a lack of water, low water pressure, or air entrainment. TBW replaced 13 of these wells. Drawdown data from the test indicated that Upper Floridan aquifer levels were lowered from 1.4 to 2.7 ft at these wells (LBG, 2001). Water samples were collected on a weekly basis from the Sink during the 2000 pumping test. Chloride concentrations were stable and averaged 10 milligrams per liter (mg/l). Sulfate concentrations increased from 36 to 139 mg/l. The highest rate of increase occurred within the first month of pumping the Sink. 3.0 HYDROGEOLOGY The groundwater flow system of the Sink area is comprised of three principal hydrogeologic units: 1) the surficial aquifer; 2) semi-confining beds of the intermediate confining unit; and 3) the Upper Floridan aquifer. The surficial aquifer consists of unconsolidated sands and sandy clays of Miocene, Pleistocene, and recent origin which generally range in thickness from a few feet to as much as 20 feet in thickness (LBG, 2001). The intermediate confining unit separates the surficial aquifer from the underlying Upper Floridan aquifer. The semi-confining unit is composed of silt, sandy clay, and clay of the Hawthorn Group that restricts the movement of water (LBG, 2001). The downward movement of water into the Upper Floridan aquifer is limited by these lower permeability units; however, the collapse of surficial sediments into voids in the underlying limestone has produced numerous breaches in the clays that act as vertical conduits for the movement of water from the surficial aquifer to the Upper Floridan aquifer (SWFWMD, 2001). The Upper Floridan aquifer (UFA) is the primary artesian aquifer throughout Florida and much of the southeastern United States. The UFA is composed of limestone and dolomite beds of Eocene to Miocene age which have an average thickness of approximately 1,000 ft in the Sink area (Miller, 1986). The lower part of the Avon Park Formation contains evaporites consisting of gypsum and anhydrite that reduce permeability of the rock and defines the base of the Upper Floridan aquifer (SWFWMD, 2001). 4.0 PUMPING TEST SETUP AND MONITORING PROGRAM To assess the feasibility of using the Sink as a source of water to augment low flow conditions in the Lower Hillsborough River, the District proposed conducting a pumping test during the spring dry season of The pumping test was necessary to determine the quantity of water that can reasonably be developed from the Sink without adversely impacting water resources in the area, as well as to supplement existing information and data collected from previous tests. 4
13 4.1 Morris Bridge Sink Pumping Test A pumping test was conducted by the District from 8 a.m. on April 13, 2009 to 8 a.m. on May 13, Prior to the pumping test, two pumps were installed within the Sink. Each pump was capable of discharging approximately 4 mgd for the 30-day period. Two pumps were set-up so that continuous pumping could occur during the test while one motor was shut down for maintenance. Only one pump discharged water at any given time. Discharge water from the Sink was routed approximately 4,450 feet through a 14-inch diameter discharge pipe to the TBC Upper Pool (Figure 2). Water from the Upper Pool was then routed to the Middle TBC Pool around the S-159 structure (Figure 3). The pumping rate was measured on the discharge line by an inline flow meter and recorded by District staff on a daily basis. The discharge pipe was contained entirely on District-owned land and located to avoid any wetlands on the property. The pumping rate was maintained at a near constant rate of 4 mgd since this discharge is the expected yield to help meet the minimum low flow criteria for the lower Hillsborough River. Refueling and maintenance were performed by the fuel and pump contractor, respectively. TBW continued pumping the Sink at a higher discharge rate at the end of the District s 30-day pumping test as part of an emergency order due to recent drought conditions. TBW pumped the Sink between 4 and 6 mgd for nine days after the District s 30-day test until pumping was discontinued around 3 PM on May 22, Heavy rain fell for 10 days (7.36 to 8.70 inches from nearby rainfall stations) beginning May 13 that increased the available water storage in the Hillsborough River Reservoir and ended the necessity for augmentation. To evaluate the potential impacts to the surrounding surface and groundwater features in the area, water-level measurements and water quality data were collected prior to, during, and after the pump test. Analysis of monitoring data from TBW s pumping rate was not included in this report due to the relatively short duration of pumping, variable discharge rates, and complications arising from repeated heavy rainfall events from May 13 through May 22,

14 Figure 2. Location of the pipeline used to discharge water from Morris Bridge Sink to the TBC Upper Pool. 6

15 Figure 3. Location of pipeline to move water between the TBC Upper Pool to Middle Pool. 7
16 4.2 Monitored Water Levels Continuous water-level data has been collected at Morris Bridge Sink, Nursery Sink, Powerline Sink Marsh, Morris Bridge Nursery Cypress Wetland, Morris Bridge Nursery Marsh, seven (7) surficial aquifer monitor wells, and five (5) Upper Floridan aquifer monitor wells since mid-to-late During the pumping test, water-level data was collected at all sites at 15-minute intervals. The location of each monitor site is shown in Figure 4. The distance each monitoring site is from the Sink and well construction details are included in Table Morris Bridge Sink and Nursery Sink A real time remote sensor with a water-level rise alarm was installed at Morris Bridge Sink so that the stage of the sink could be monitored for any rapid water level rise associated with a pump shutdown. Continuous water-level monitoring equipment was also installed by District staff at Nursery Sink (Figure 4). Stage data was collected at 15-minute intervals Wetlands Continuous water-level data was collected from stage recorders located at three (3) wetlands in the Sink area including Powerline Sink Marsh, Morris Bridge Nursery Marsh, and Morris Bridge Nursery Cypress Wetland (Figure 4). All of the wetlands are clustered within one-half mile of the Sink. The closest wetland to the Sink is the Morris Bridge Nursery Marsh with its stage recorder located approximately 690 ft to the east of the Sink. The farthest wetland from the Sink is Morris Bridge Nursery Cypress Wetland with its stage recorder located approximately 2,140 ft to the southeast of the Sink. Stage data was collected at 15-minute intervals. However, due to the prolonged drought conditions experienced over the last three years, all three wetland locations were dry during the 30-day pumping test Wells Continuous water-level data was collected at 15-minute intervals by the District at seven (7) surficial aquifer monitor wells: Powerline Sink Upland, Nursery Sink Marsh Upland, Nursery Sink Marsh Wetland, Nursery Sink Cypress Upland, Nursery Sink Cypress Wetland, Idlewood, and TBW 516-S. Continuous water-level data was also collected at 15-minute intervals by the District at five Upper Floridan aquifer monitor wells: Idlewood, TBW 516-D, FL-MB-550, FL-MB-750, and FL-MB-2200 (Figure 4). 8

17 Figure 4. Location of Monitor Wells and Surface Water Stage Recorders used in the Morris Bridge Sink Pumping Test. 9
18 Table 1. Monitor site distance from Morris Bridge Sink and construction details of monitor wells. Site Name Type Distance from Morris Bridge Sink (ft) Morris Bridge Sink Surface Water 0 Morris Bridge Nursery Marsh Surface Water 690 Powerline Sink Marsh Surface Water 750 Nursery Sink Surface Water 780 Casing Depth (ft) Total Depth (ft) Morris Bridge Nursery Cypress Surface Water 2, Idlewood Surficial Aquifer Well TBW 516 Shallow Surficial Aquifer Well 516 Unk 18 Nursery Sink Marsh Wetland Surficial Aquifer Well Nursery Sink Marsh Upland Surficial Aquifer Well Powerline Sink Upland Surficial Aquifer Well Nursery Sink Cypress Upland Surficial Aquifer Well 1, Nursery Sink Cypress Wetland Surficial Aquifer Well 2, Idlewood Upper Floridan Aquifer Well TBW 516 Deep Upper Floridan Aquifer Well FL-MB-550 Upper Floridan Aquifer Well FL-MB-750 Upper Floridan Aquifer Well FL-MB-2200 Upper Floridan Aquifer Well 2, Note: UNK = unknown 10
19 Prior to the 30-day test, the District collected geologic samples from land surface to the top of limestone and installed a nested well pair (surficial and Upper Floridan aquifer) at the Idlewood site (Appendix A). The closest monitor wells to the Sink are the Idlewood nested wells, located approximately 160 ft to the southwest. The farthest monitor well from the Sink is FL-MB-2200, located approximately 2,200 ft to the northeast. 4.3 Background Data Background data was collected at monitor wells outside of the zone-of-influence for the pumping test for both the surficial and Upper Floridan aquifers. This information was collected to compare and contrast water levels of nearby monitor wells to determine the level of drawdown caused by pumping from Morris Bridge Sink. In addition, hourly rainfall data was collected at both the S-155 and S-163 rainfall stations Wells Several wells were examined to obtain background water levels to compare with monitor well data collected within the zone-of-influence of the pumping test. The LHFDA 22 Upper Floridan aquifer monitor well, located approximately 2.5 miles east of the Sink, was utilized to establish the background trend in the aquifer (Figure 5). For comparison purposes, water level data was also reviewed from the ROMP 68 Tampa-Suwannee well, located about 5.5 miles east of the Sink. Linear regression of water levels at both wells for the 30-day pumping period from April 13 to May 13, 2009 indicated a slope or regional trend of ft/day for LHFDA 22 UFA well and ft/day at the Romp 68 Tampa-Suwannee well (Figure 6). While both wells showed similar trends, water levels from the LHFDA 22 well were used as background conditions to calculate drawdown in the UFA based on a slightly better r- squared value and closer proximity to the Sink. In the surficial aquifer, water levels were analyzed for the background trend from three wells: Romp DV-1, Blackwater Creek Elapp, and Debuel Road. All three wells are located from eight to ten miles from the Sink (Figure 7). Linear regression of water levels at all three wells for the 30-day pumping period from April 13 to May 13, 2009 indicated a regional trend of ft/day for Romp DV-1 well, ft/day for the Blackwater Creek Elapp well, and ft/day at the Debuel Road well (Figure 8). The background trend selected for the surficial aquifer was ft/day based on the average from all three wells since their trends were all very similar. 11

20 Figure 5. Location of Upper Floridan aquifer background monitor wells. 12
.")
21 Figure 6. Linear regression of background water level trends at the LHFDA22 and Romp 68 UFA wells Rainfall Data Two continuous rainfall gages maintained by the District already exist at the S-155 and S-163 sites, located just to the west of the Sink (Figure 9). The S-155 rainfall site is located 7,000 ft northwest of Morris Bridge Sink. The S-163 rainfall site is located 4,300 ft southwest of Morris Bridge Sink. Data was collected from both stations to evaluate the effect of rainfall in the area of Morris Bridge Sink during the pumping period. 4.4 Water Quality Testing Morris Bridge Sink and Wells In an effort to evaluate potential impacts to the surrounding surface and groundwater resources in the Morris Bridge Sink area, water quality data were collected from sites along the upper portions of the Tampa Bypass Canal, in Morris Bridge Sink, in domestic wells within the Morris Bridge Sink area, and the newly installed Upper Floridan aquifer Idlewood well located 160 ft from Morris Bridge Sink. A schedule was implemented for collecting both field-measured parameters and water samples for laboratory analysis. Sampling was conducted by the District s Water Quality Monitoring Program (WQMP) prior to, during, and at the conclusion of the pumping test. 13

22 Figure 7. Location of surficial aquifer background monitor wells. 14


23 Figure 8. Linear regression of background water level trend at Romp DV-1, Blackwater Creek Elapp, and Debuel Road surficial aquifer wells. Figure 9. Location of the S-155 and S-163 rainfall stations. 15
24 Domestic well water quality sampling sites were selected based upon their proximity to Morris Bridge Sink and well owner participation. A public meeting was held in February 2009, to present the Morris Bridge Sink Pumping Test Project Plan and request well owner participation for water quality sampling. The owners whose domestic wells met the water quality sampling plan criteria were then contacted to set up subsequent sampling. The domestic wells selected for sampling were assumed to be open to the Upper Floridan aquifer based on well specifications on record at, or provided to, the District. The District provided the domestic well owners with the water quality sampling results immediately following their availability after each water quality sampling. The locations of the domestic wells monitored as part of the pumping test are depicted in Figure 10. The initial set of ground and surface water quality samples were collected prior to the start of the pumping test on Feb 19, 2009 and Feb 25, Due to a delay in the start of the test, the WQMP collected additional field parameters only, from each domestic well site on March 23, 2009, and each surface water site on April 2, 2009, to determine water chemistry variations from the initial sampling. The second set of ground and surface-water samples were collected on April 28, 2009 and April 29, 2009, which occurred approximately two weeks after the start of the pumping test on April 13, The final set of water quality samples were collected on May 11, 2009 and May 12, 2009 near the conclusion of the test. Both field parameters and samples for laboratory analytes were collected during each of those two sampling events. However, after the conclusion of the District s 30-day pumping test, on May 18, 20, and 22, 2009, the WQMP collected field parameters only from the nine domestic wells. This additional monitoring was conducted to detect water chemistry variations due to the increased withdrawal rates from the sink by Tampa Bay Water as part of the emergency order issued. The WQMP also responded to and processed complaints for water quality during and after the pumping test Analytes Collected Water quality samples were collected and analyzed for trace elements, inorganic, and physical parameters from each of the domestic well sites, Morris Bridge Sink, and the surface water sites within the Tampa Bypass Canal. The parameters sampled are listed in Table 2. Following concerns from area residents, arsenic was added to the parameter list. Water quality samples were analyzed by Columbia Analytical Services Inc., a contract private laboratory, located in Jacksonville, Florida. Field measured parameters were collected with a YSI 600XLM Multiprobe, a YSI 9100 Photometer, and an electronic water level meter. All water quality data collected for the Morris Bridge Sink pumping test are provided in Appendix B. 16
 Depth to Water Dissolved Oxygen Fecal coliform Iron Nitrate ph Salinity (collected at surface water sites only)")
25 Figure 10. Groundwater quality sampling sites for the Morris Bridge Sink pumping test. Table 2. Water quality parameters analyzed for the Morris Bridge Sink test. Parameters Arsenic Chloride Color Depth (collected at surface water sites only) Depth to Water Dissolved Oxygen Fecal coliform Iron Nitrate ph Salinity (collected at surface water sites only) Specific Conductance Sulfate Sulfate Sulfide Temperature Total Dissolved Solids Turbidity Turbidity Analyzed by: Columbia Analytical Services Columbia Analytical Services Columbia Analytical Services Field Measured Value Field Measured Value Field Measured Value Columbia Analytical Services Columbia Analytical Services Columbia Analytical Services Field Measured Value Field Measured Value Field Measured Value Field Measured Value Columbia Analytical Services Columbia Analytical Services Field Measured Value Columbia Analytical Services Columbia Analytical Services Field Measured Value 17
26 4.4.2 Groundwater Sampling Site Selection Groundwater quality samples were collected from nine domestic wells located within one mile of Morris Bridge Sink. A baseline water quality sample was also collected at the ROMP Morris Bridge Idlewood Upper Floridan aquifer well prior to the start of the test to assess the Upper Floridan aquifer water quality immediately adjacent to Morris Bridge Sink. Table 3 lists the domestic well sites by their Site Identification Number, along with their respective well specification information where available. Table 3. Well construction information for the domestic wells sampled as part of the Morris Bridge Sink test. Note: Site Identification Number (SID) Casing Depth (feet bls) Total Depth (feet bls) Casing Diameter (inches) Unk Unk Unk Unk Unk Unk feet bls = feet below land surface Unk = Unknown Surface Water Sampling Site Selection Surface water quality samples were obtained from three sites along the upper portion of the Tampa Bypass Canal to monitor any potential water chemistry changes that may have resulted from the pumping discharge (Figure 11). The pumping discharge occurred upstream of the convergence of Cow House Creek and the Tampa Bypass Canal. As a result, a surface water sampling site was located immediately downstream of the discharge, but upstream of the convergence of Cow House Creek and the Tampa Bypass Canal and Structure 163. The other two stations are located adjacent to Structure 159; one is located upstream and the other downstream. 18

27 Figure 11. Surface water quality sampling sites during the Morris Bridge Sink pumping test. 19
28 5.0 PUMPING TEST RESULTS 5.1 Rainfall No significant rainfall was recorded from April 1 through the early morning of April 14. However, a heavy rainfall event occurred during the day of April 14 just after initiation of pumping from the Sink on April 13 with 1.2 inches recorded at S-155 and 1.35 inches at S-163. From that point on, only 0.14 inches at S-155 and 0.19 inches at S- 163 was recorded for the remainder of the 30-day pumping test period. On the afternoon of May 13, just after concluding the 30-day test, 3.85 inches of rain was recorded as an average from the two stations (Table 4 and Figures 12 and 13). Numerous rainfall events occurred thereafter through the end of May. From May 13 to May 31, 9.33 inches of rain fell as an average from the two stations. 5.2 Discharge Rates Flow was measured using an inline flow meter at daily intervals during the pumping test (Table 5 and Figure 14). The average pumping rate from the Sink was 2,733 gpm or approximately 3.94 mgd for the District s 30-day pumping test (Table 5). Total discharge from Morris Bridge Sink was million gallons during the 30-day test. TBW s average pumping rate from May 13 to May 22, 2009 was 3,644 gpm or approximately 5.25 mgd (Table 5). Total discharge from Morris Bridge Sink for the TBW pumping period was approximately 47.2 million gallons during the nine-day period. 5.3 Background Levels Background aquifer levels were decreasing during the pumping test period. The background water level trend for the Upper Floridan aquifer was determined from the LHFDA 22 well located approximately 2.5 miles east of the Sink. From April 13 to May 13, 2009, water levels decreased by 1.58 ft in the LHFDA 22 well based on a linear regression of the data. The background water level trend for the surficial aquifer was determined from averaging the DV-1, Blackwater Elapp, and Debuel Road wells which are located eight to ten miles from the Sink outside the cone-of-influence of the pumping test. From April 13 to May 13, 2009, water levels decreased by 0.76 ft in the surficial aquifer based on the average linear regression from the three wells. 5.4 Pumping Test Drawdown Drawdown in Morris Bridge Sink, Nursery Sink, and Upper Floridan aquifer monitor wells was calculated by adjusting recorded stage or aquifer levels due to the background water level decline from April 13 through May 13, 2009 and taking the mean water level decline from April 16 to May 13, 2009 (27 days). The first 3 days of water level data at the monitoring sites was excluded due to non-equilibrium pumping conditions. For the surficial aquifer, drawdown was calculated by adjusting aquifer 20
29 Table 4. Daily rainfall measured at the S-155 and S-163 stations from April1 to June 1, S-155 S-163 S-155 S-163 Date Rainfall (in) Rainfall (in) Date Rainfall (in) Rainfall (in) 4/1/ /1/ /2/ /2/ /3/ /3/ /4/ /4/ /5/ /5/ /6/ /6/ /7/ /7/ /8/ /8/ /9/ /9/ /10/ /10/ /11/ /11/ /12/ /12/ /13/ /13/ /14/ /14/ /15/ /15/ /16/ /16/ /17/ /17/ /18/ /18/ /19/ /19/ /20/ /20/ /21/ /21/ /22/ /22/ /23/ /23/ /24/ /24/ /25/ /25/ /26/ /26/ /27/ /27/ /28/ /28/ /29/ /29/ /30/ /30/ /31/ /1/


30 Figure 12. Rainfall history at the S-155 station from April 1 to June 1, Figure 13. Rainfall history at the S-163 station from April 1 to June 1,
31 Table 5. Morris Bridge Sink withdrawals during the SWFWMD and TBW pumping periods (April 13 through May 22, 2009). Withdrawals Withdrawals Withdrawals Withdrawals Date (cfs) (mgd) Date (cfs) (mgd) 4/13/ /4/ /14/ /5/ /15/ /6/ /16/ /7/ /17/ /8/ /18/ /9/ /19/ /10/ /20/ /11/ /21/ /12/ /22/ /13/ /23/ /14/ /24/ /15/ /25/ /16/ /26/ /17/ /27/ /18/ /28/ /19/ /29/ /20/ /30/ /21/ /1/ /22/ /2/ /23/ /3/ Note: Bolded TBW emergency order withdrawals. levels due to the background water level decline from April 13 through May 13, 2009 and taking the last water level recorded after 30 days of withdrawals. The reason drawdown was calculated differently between the surficial and Upper Floridan aquifers is because the UFA came to a quasi steady-state condition relatively quickly compared to the surficial aquifer. Monitoring site drawdown is presented in Table 6. Hydrographs showing all surface water and groundwater levels during the test are shown in Appendix C. Drawdown plots for all surface water and groundwater monitoring sites are shown in Appendix D. 23
. In Nursery Sink, located approximately 780 ft northeast of Morris Bridge Sink, calculated drawdown was 0.3 ft.")
32 Figure 14. Morris Bridge Sink withdrawals during the SWFWMD 30-Day Test and TBW s emergency order period Sink Drawdown Over the 27-day period, drawdown in Morris Bridge Sink was approximately 2.16 ft (Table 6). In Nursery Sink, located approximately 780 ft northeast of Morris Bridge Sink, calculated drawdown was 0.3 ft. Morris Bridge Sink drawdown approached a quasi steady-state condition after about three days of withdrawals as it remained relatively steady around 2.2 ft (Figure 15). This condition was also reflected in Nursery Sink stage and UFA monitor wells surrounding the sink (Appendix E). The minor oscillations in drawdown depicted after three days of pumping were mainly due to small alterations in the withdrawal rate Wetland Drawdown Continuous water-level data was collected from stage recorders located at three wetlands in the Morris Bridge Sink area including Powerline Sink Marsh, Morris Bridge Nursery Marsh, and Morris Bridge Nursery Cypress Wetland (Figure 4). All of the wetlands are clustered within one-half mile of the Sink. Stage data was collected at 15-minute intervals. However, due to the prolonged drought conditions experienced over the last three years, all three wetland locations were dry during the 30-day pumping test. 24
33 Table 6. Drawdown due to pumping Morris Bridge Sink at four mgd for 30 days. Monitor Site Drawdown (ft) Wetlands Powerline Sink Marsh Morris Bridge Nursery Marsh Morris Bridge Nursery Cypress dry dry dry Sinks Morris Bridge Sink 2.16 Nursery Sink 0.30 Surficial Aquifer Wells Idlewood dry TBW 516 Shallow 0.78 Nursery Sink Marsh Wetland* 0.09 Nursery Sink Marsh Upland Powerline Sink Upland Nursery Sink Cypress Upland Nursery Sink Cypress Wetland dry dry dry DA Upper Floridan Aquifer Wells Idlewood 1.72 TBW 516 Deep 0.83 FL-MB FL-MB FL-MB Note: * = drawdown based on 13 days of pumping (well went dry 316 hours into the test) DA = water level data anomalous (possible recorder problem) 25
34 Drawdown (ft) Steady-State Drawdown reached at 3 days Days since Pumping Started Figure 15. Drawdown in Morris Bridge Sink stage during the duration of the 30-day test Surficial Aquifer Drawdown Continuous water-level data was collected by the District at seven (7) surficial aquifer monitor wells: Powerline Sink Upland, Nursery Sink Marsh Upland, Nursery Sink Marsh Wetland, Nursery Sink Cypress Upland, Nursery Sink Cypress Wetland, Idlewood, and TBW 516-S. All surficial aquifer wells were dry at the start of the 30- day test except at the TBW 516-S, Nursery Sink Marsh Wetland, and the Nursery Sink Cypress Wetland sites. Drawdown at the TBW 516 well was 0.78 ft at the end of 30 days of pumping. Drawdown was 0.09 ft at the Nursery Sink Marsh Wetland well after 13 days of withdrawals. Unfortunately, surficial aquifer water levels dropped below the bottom of this well after 316 hours of pumping. Water levels from the Nursery Sink Cypress Wetland well increased nearly a foot and then declined during the duration of the pumping test rendering this data highly suspect Upper Floridan Aquifer Drawdown Continuous water-level data was also collected at five Upper Floridan aquifer monitor wells: Idlewood, TBW 516-D, FL-MB-550, FL-MB-750, and FL-MB Upper Floridan aquifer drawdown to the southwest of the sink ranged from 1.7 ft at 160 ft to 1.4 ft at 550 ft (Figure 16). To the east and northeast of the sink, drawdown was less with 0.8 ft recorded at 516 ft, 0.4 ft at 750 ft, and 0.3 ft at 2,200 ft. The drawdown results indicate anisotropic flow conditions in the UFA with permeability much greater to the east and northeast of Morris Bridge Sink. 26

35 Figure 16. Drawdown in the Upper Floridan aquifer from the Morris Bridge Sink pumping test. 27
36 The distance to one foot of drawdown ranges from about 400 ft toward the east and northeast of the sink to more than 600 ft to the southwest. A contour map of Upper Floridan aquifer drawdown is presented in Figure Domestic Well Water Level Change Depth to water measurements were also obtained from the domestic wells sampled for water quality. However, due to access constraints, depth to water measurements were not able to be collected on all wells. Depth to water measurements were taken in reference from the top of the well casing to the top of the water column with an electronic water level tape. These measurements were used to track relative changes within the wells as the pumping test progressed. Over the period of the District s pumping test, drawdown at the measured domestic wells varied from 0.3 to 0.45 ft (Table 7). This was derived by subtracting out the background water level change from the measured change at wells from March 23 to May 11, The background water level change was ft at monitor well LHFDA 22 from March 23 to May 11, The May 11 date represents water level change after 28 days of withdrawals from Morris Bridge Sink. The decrease in background water levels prior to and during the duration of the pumping test was due to the lack of rainfall and drought conditions experienced during this period. Appendix F includes the depth to water measurements from February 19 to May 27, 2009 for a selected group of domestic wells near Morris Bridge Sink. Table 7. Drawdown at nearby domestic wells during the Morris Bridge Sink pumping test. Well ID* March 23 Depth to Water Level (ft btoc) May 11 Depth to Water Level (ft btoc) Water Level Decline (ft) Drawdown (ft) ND ND ND ND ND ND ND ND ND ND ND ND ND ND ND ND ND ND ND ND ND ND Note: * Well location is shown in Figure 10. ND = No data obtained. 28
37 5.6 Upper Floridan Aquifer - Estimation of Hydraulic Parameters The pumping test was designed primarily to: 1) determine the sustainable yield of Morris Bridge Sink; and 2) establish if any adverse impacts to nearby wetlands or aquifer levels would occur due to withdrawals. However, an estimate of transmissivity and storage coefficient within the UFA can be determined based on the drawdown from wells at different radial distances from Morris Bridge Sink over the same period of time. This type of analysis, termed the distance-drawdown method, is based upon the Theis equation (Fetter, 1980). Additionally, transmissivity and storage coefficient can also be determined based on straight-line plots of drawdown versus time. This analysis is called the Cooper-Jacob straight line method (Fetter, 2001). A third method, termed the Hantush-Jacob leaky aquifer analysis, which relies upon type curve matching, can also be utilized to estimate transmissivity, storage coefficient, and a leakance coefficient. The aforementioned methods of estimating hydraulic parameters were used to characterize flow within the UFA in the Morris Bridge Sink area (Table 8). For each method, all five UFA wells along with Nursery Sink were selected for analysis due to their close proximity to the Sink Distance Drawdown Method Drawdown after seven days of pumping from all five UFA observation wells and Nursery Sink was plotted on an arithmetic scale as a function of the distance from Morris Bridge Sink on a logarithmic scale. A linear regression plot (straight line) of the points was drawn and extended until it intercepted the zero-drawdown line (x-axis). The amount of drawdown per log cycle was determined and the following equations were used to calculate transmissivity and storage: T = (528*Q/(h o -h))/7.48 S = T*7.48*t/4790*r 0 2 Where: T is the transmissivity (ft squared per day) Q is the pumping rate (gallons per minute) (h o -h) is the drawdown per log cycle of distance (ft) t is the time since pumping began (minutes) r 0 is the intercept of the straight line with the zerodrawdown axis (ft) S is the storage coefficient (dimensionless) 29
38 Table 8. Hydraulic parameters for the Upper Floridan aquifer determined from the Morris Bridge Sink Pumping Test. Well Name Transmissivity (ft 2 /d) Storage Coefficient (dimensionless) Leakance Coefficient (ft/d/ft) Distance-Drawdown Method All UFA Wells and Nursery Sink 142, Hantush-Jacob Method Idlewood 97, TBW 516-D 105, FL-MB , FL-MB , Nursery Sink 322, FL-MB , Jacob-Cooper Method Idlewood 182, TBW 516-D 172, FL-MB , FL-MB , Nursery Sink 247, FL-MB , average: 205, median: 172, The drawdown per log cycle based on the aforementioned distance drawdown method was 1.36 ft (Figure 17). The intercept of the zero-drawdown axis was 2,700 ft. The average pumping rate from the Sink was 2,733 gpm. The time since pumping began was seven days. Based on the distance-drawdown analysis above: Transmissivity = 142,000 ft 2 /d Storage Coefficient = 0.31 The transmissivity of 142,000 ft 2 /d is consistent with transmissivity results of 130,000 to 200,000 ft 2 /d determined from aquifer tests performed at the site in 1972 (Stewart, 1977). This transmissivity value is very close to 146,000 ft 2 /d determined in the year 2000 test of Morris Bridge Sink (LBG, 2001). 30
39 Drawdown (ft) Drawdown per Log Cycle = 1.36 ft Zero Drawdown Intercept = 2,700 ft Distance from Morris Bridge Sink (ft) Figure 17. Distance-drawdown plot of all UFA monitor wells and Nursery Sink at 7 days Cooper-Jacob Straight Line Method Drawdown from each of the five UFA observation wells and Nursery Sink was plotted on an arithmetic scale as a function of the time on a logarithmic scale (Figures 18-23). A straight line is drawn through the field data points and extended backward to the zero drawdown axis. The value of the drawdown per log cycle is obtained from the slope of the graph. The amount of drawdown per log cycle is then determined and the following equations are used to calculate transmissivity and storage: Where: T = (2.3*Q/12.57*(h o -h)) S = 2.25*T*t 0/r 2 T is the transmissivity (ft squared per day) Q is the pumping rate (ft cubed per day) (h o -h) is the drawdown per log cycle of time (ft) t 0 is the time, where the straight line intersects the zero drawdown axis (days) r is the radial distance of the well (ft) S is the storage coefficient (dimensionless) 31
40 Drawdown (ft) Drawdown (ft) 2.5 Drawdown per log cycle = 0.53 ft Zero Drawdown intercept = 1.4 min Time (min) Figure 18. Drawdown versus time analysis using the Cooper-Jacob method for the Idlewood well. 1.5 Drawdown per log cycle = 0.56 ft Zero Drawdown intercept = 56 min Time (min) Figure 19. Drawdown versus time analysis using the Cooper-Jacob method for the TBW 516 well. 32
41 Drawdown (ft) Drawdown (ft) 2.0 Drawdown per log cycle = 0.75 ft Zero Drawdown intercept = 26 min Time (min) Figure 20. Drawdown versus time analysis using the Cooper-Jacob method for the FL-MB-550 well Drawdown per log cycle = 0.44 ft Zero Drawdown intercept = 260 min Time (min) Figure 21. Drawdown versus time analysis using the Cooper-Jacob method for the FL-MB-750 well. 33
42 Drawdown (ft) Drawdown (ft) Drawdown per log cycle = 0.39 ft Zero Drawdown intercept = 170 min Time (min) Figure 22. Drawdown versus time analysis using the Cooper-Jacob method for Nursery Sink Drawdown per log cycle = 0.2 ft Zero Drawdown intercept = 160 min Time (min) Figure 23. Drawdown versus time analysis using the Cooper-Jacob method for the FL-MB-2200 well. 34
43 Based on the Cooper-Jacob straight line method, the median transmissivity and storage coefficient is: Transmissivity = 201,000 ft 2 /d Storage Coefficient = 0.08 The transmissivity of 201,000 ft 2 /d is slightly higher than transmissivity results of 130,000 to 200,000 ft 2 /d determined from aquifer tests performed at the site in 1972 and 2000 (Stewart, 1977 and LBG 2001). Transmissivity was higher in the monitor wells located 750 and 2,200 ft to the northeast of the sink compared to the wells southwest of the sink. The median storage coefficient value was This value is characteristic of an unconfined UFA which is consistent with the karst geology surrounding Morris Bridge Sink Hantush-Jacob Leaky Aquifer Method Drawdown versus time (divided by the radial distance) from each of the five UFA observation wells and Nursery Sink was plotted on a logarithmic scale (Figures 24-29). The drawdown plots were superimposed over type curves of W(u,r/B) on the y- axis and 1/u on the x-axis (Figure 30). The type curves were derived from values contained in Appendix 3 of Fetter (2001). A match point where values of W(u,r/B) and 1/u equal one is identified on the type curves which simplifies the transmissivity and storage coefficient equations. The log-log plot of drawdown versus time is superimposed over the type curves to find the best match of the drawdown data and type curve. A second match point is located on the drawdown versus time graph that corresponds to the match point of 1 from the W(u,r/B) versus 1/u graph. This second match point determines the drawdown and time used in the transmissivity and storage coefficient equations. Another value, termed r/b, is obtained with the type curve match of the later drawdown data to calculate a leakance coefficient. The following equations are used in the Hantush-Jacob Analysis: T = (Q* W(u,r/B))/(12.57*(h o -h)) S = 4*T*t/r 2 Where: L = T/B 2 T is the transmissivity (ft squared per day) W(u,r/B) is the leaky artesian well function Q is the pumping rate (ft cubed per day) (h o -h) is the drawdown (ft) t time since pumping started (days) r is the radial distance of the well (ft) S is the storage coefficient (dimensionless) r/b is the radial distance divided by the leakage factor L is the leakance coefficient (ft/d/ft) 35
44 Drawdown (ft) Drawdown (ft) E E E E E-03 t/r2 Matchpoint values: Drawdown = 0.43 ft t/r 2 = 4.8E-07 r/b = 0.2 Figure 24. Drawdown versus time analysis using the Hantush-Jacob method for the Idlewood well E E E E E-03 t/r2 Matchpoint Values: Drawdown = 0.4 ft t/r 2 = 2.7E-07 r/b = 0.45 Figure 25. Drawdown versus time analysis using the Hantush-Jacob method for the TBW 516 well. 36
45 Drawdown (ft) Drawdown (ft) E E E E E-04 t/r2 Matchpoint values: Drawdown = 0.55 ft t/r 2 = 9.6E-08 r/b = 0.4 Figure 26. Drawdown versus time analysis using the Hantush-Jacob method for the FL-MB-550 well E E E E E-04 t/r2 Matchpoint values: Drawdown = 0.28 ft t/r 2 = 3.7E-07 r/b = 0.6 Figure 27. Drawdown versus time analysis using the Hantush-Jacob method for the FL-MB-750 well. 37
46 Drawdown (ft) Drawdown (ft) E E E E E-04 t/r2 Matchpoint values: Drawdown = 0.13 ft t/r 2 = 4E-08 r/b = 0.3 Figure 28. Drawdown versus time analysis using the Hantush-Jacob method for Nursery Sink E E E E E-05 t/r2 Matchpoint values: Drawdown = 0.12 ft t/r 2 = 2.1E-08 r/b = 0.3 Figure 29. Drawdown versus time analysis using the Hantush-Jacob method for the FL-MB-2200 well. 38
47 W(u,r/B) r/b curves /u Figure 30. Hantush-Jacob leaky aquifer method type curves. Based on the Hantush-Jacob method, the median transmissivity, storage coefficient, and leakance coefficient is: Transmissivity = 127,000 ft 2 /d Storage Coefficient = 0.08 Leakance Coefficient = ft/d/ft The transmissivity of 127,000 ft 2 /d is slightly lower than transmissivity results of 130,000 to 200,000 ft 2 /d determined from aquifer tests performed at the site in 1972 and 2000 (Stewart, 1977 and LBG 2001). Transmissivity was higher at Nursery sink and the monitor wells located 750 and 2,200 ft to the northeast of the sink compared to the wells southwest of the sink. The storage coefficient value was This value is again characteristic of an unconfined UFA which is consistent with the karst geology surrounding Morris Bridge Sink. The leakance coefficient was ft/d/ft which is indicative of a very leaky Floridan aquifer system in the vicinity of Morris Bridge Sink. 5.7 Well Survey The District obtained information from its well construction database and the Hillsborough County Health Department within one mile of Morris Bridge Sink (Appendix G). According to county records and the SWFWMD well construction database, there are five public water supply wells and one limited use well located within 0.5 mile from the sink. Additionally, there are seven public water supply wells
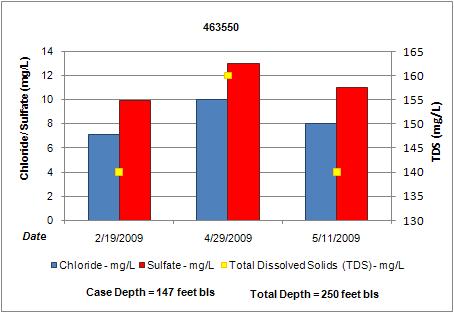
48 and one limited use well located between 0.5 mile and one mile of the sink. There are 39 domestic self supply wells located within one-half mile from the sink and 69 domestic self supply wells between 0.5 mile and one mile from the sink. There are also approximately five irrigation/livestock wells and 37 observation/monitor wells located within one mile of the sink. 6.0 MORRIS BRIDGE SINK WATER QUALITY RESULTS 6.1 Groundwater Quality Sampling Results Results from groundwater quality samples collected at the nine domestic wells throughout the pumping test remained relatively stable, without any significant increases or decreases in parameter concentrations. There were no exceedances of primary drinking water standards; however, four wells did have a secondary drinking water standard exceedance for iron. Iron was detected in the baseline sample collected prior to the start of the pumping test in wells , , , and at levels above the secondary drinking water standard of 0.3 mg/l (Table 9) (FDEP, 2009). Iron was also detected in two subsequent sampling events in the same wells at levels above the secondary drinking water standard. Well owners were notified by letter of these exceedances. Table 9. Iron Values from domestic wells near the Morris Bridge Sink. Site Identification Number (SID) Sample Date 2/19/2009 3/23/2009 4/29/2009 5/11/2009 NS = No Water Quality Sample Collected Values Listed are in mg/l NS NS NS NS NS NS NS NS NS Chloride, sulfate, total dissolved solids (TDS), and specific conductance were collected at each well as part of the water quality sampling plan. The baseline and final sampling results for these parameters are displayed in Figure
49 Concentrations for these parameters remained relatively stable throughout the duration of the pumping. Well had chloride values approximately four to six times greater than the other wells sampled. The nitrate values reported for this well range from approximately 5 to 6 mg/l, which are also higher when compared to the other wells. The total depth and casing depth for this well are unknown. Sulfate, TDS, and specific conductance were recorded at higher levels within Morris Bridge Sink than in the domestic wells. This may suggest that Morris Bridge Sink is utilizing a deeper source of water within the Upper Floridan aquifer than the domestic wells. Further investigation is required, however, to more fully substantiate this hypothesis. The range of values collected throughout the water quality sampling period at each of the groundwater quality monitoring sites are shown in Table 10. This table combines values from both the domestic well sites and ROMP Morris Bridge Idlewood Upper Floridan aquifer well, and includes all values collected prior to, during, and post pumping test events. Graphs of select water quality parameters for the groundwater sites sampled are presented in Appendix H. Table 10. Groundwater quality value ranges from wells sampled during the Morris Bridge Sink pumping test. Parameter Dissolved Oxygen, Field ph, Field Turbidity, Field Specific Conductance, Field Sulfate, Field Sulfate Chloride Total Dissolved Solids Arsenic (Total) Iron (Total) Nitrate (as N) Fecal Coliform Sulfide Value Ranges (all groundwater sites) (mg/l) (SU) (NTU) (us/cm) 0-9 (mg/l) < (mg/l) (mg/l) (mg/l) < (ug/l) (mg/l) < (mg/l) below the detection limit of 1 CFU/100mL, but exceeded holding times < (mg/l) 41

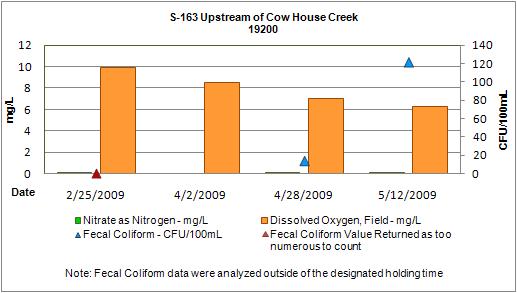
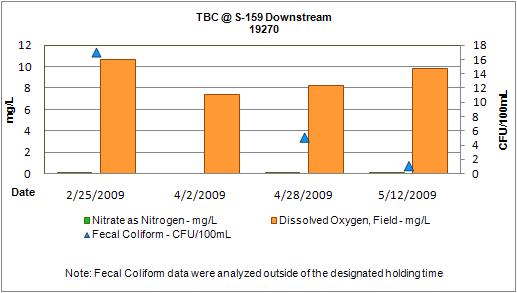
50 Figure 31. Select water quality parameters collected from Morris Bridge domestic wells, ROMP Morris Bridge Idlewood UFA, and Morris Bridge Sink, during the baseline and final sampling events. 6.2 Surface Water Quality Sampling Results Water quality samples were collected from Morris Bridge Sink and three sites along the upper Tampa Bypass Canal, near the pumping test water discharge point. Surface water samples were also collected prior to the start of the test, approximately two weeks after testing began, and a final sample was collected the day before the conclusion of the test. The baseline water quality samples were collected on February 25, 2009; however, due to the delay in the start of the pumping test specific conductance, temperature, ph, dissolved oxygen, and salinity were collected again about two weeks prior to the actual test start date of April 13, This was to determine that no significant variation from the baseline sampling had occurred for these water quality parameters. Sample site TBC@S-159 Upstream was sampled for field parameters only on April 28, On this date, water from the upstream side of S-159 was actively being pumped over the structure; therefore, it was only necessary to collect a full suite of water quality analytes from the downstream site. Dissolved oxygen (DO), nitrate, and fecal coliform were collected and analyzed for each of the surface water sampling sites. The baseline and final sample results for 42
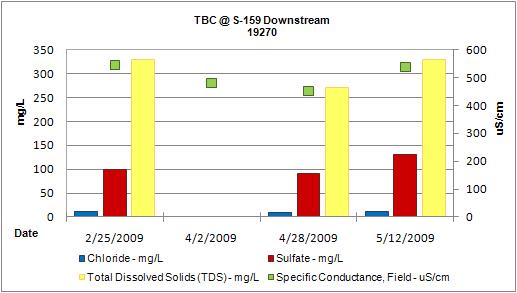
51 these parameters are depicted in Figure 32. Dissolved oxygen values in Morris Bridge Sink were below the State criteria of 5.0 mg/l for three of the sampling events which can be expected in non-flowing surface water systems. The remaining sites had expected ranges for DO. Nitrate values all fell below the State drinking water criteria of 10.0 mg/l, and fecal coliform values were within ranges expected for surface waters that have bird and fish populations. The TDS, chloride, sulfate, and specific conductance values observed in the Tampa Bypass Canal sites, throughout the pumping test, reflect the values seen at the Morris Bridge Sink site. This is to be expected, since the water from the sink was being discharged into the Tampa Bypass Canal. These values are elevated above what is typically seen in a surface water system and can be attributed to the influence of more mineralized groundwater being pumped from the sink into the Tampa Bypass Canal. Baseline sample values for TDS, chloride, sulfate and specific conductance from Morris Bridge Sink collected prior to the pumping test are relatively consistent with those results obtained throughout the duration of the test. The baseline and final sample results for these parameters are displayed in Figure 32. Graphs of select water quality parameters for the surface water sites sampled are also presented in Appendix I. A listing of ranges for surface water values observed at the surface water monitoring locations can be found in Table 11, and includes all values collected prior to, during, and post-pumping test events. All values from the Tampa Bypass Canal sampling sites throughout the test were within the Class III surface water quality criteria (Chapter , F.A.C). 6.3 Sonde Deployment Results A continuous logging multi-probe sonde was deployed in Morris Bridge Sink during the pumping test to measure specific conductance in 15 minute intervals. The sonde was periodically removed for routine maintenance and data downloads, then returned for logging. The data collected by this sonde are depicted in Figure 33 and show that a 10 percent increase in specific conductance occurred throughout the pumping test. Water level elevation data collected in Morris Bridge Sink are also included on this data plot. 6.4 Water Quality Issues During the pumping test, three domestic well owners located within one mile of Morris Bridge Sink filed complaints through the District in regards to their water quality. The water quality complaints regarded an increase in iron and/or sulfate. District water quality technicians responded to each initial complaint and collected field parameters from the complainants well. Each of these complaints, along with the sampling results obtained from these wells, were then forwarded to Tampa Bay Water for further investigation and possible mitigation. 43

52 Figure 32. Select water quality parameters collected from Morris Bridge Sink pumping test during the baseline and final sampling events. 44
53 Table 11. Surface water quality value ranges for the Morris Bridge Sink test. Parameter Value Ranges (all surface water sites) Dissolved Oxygen, Field (mg/l) ph, Field (SU) Turbidity, Field value taken at Sink = 1.83 Specific Conductance, Field (us/cm) (mg/l) Sulfate, Field (values from Sink only) Sulfate (mg/l) Chloride (mg/l) Total Dissolved Solids (mg/l) Arsenic (Total) < (ug/l) Iron (Total) (mg/l) Nitrate (as N) < (mg/l) (CFU/100mL) one sample was too numerous to count, all exceeded Fecal Coliform holding times Sulfide < (mg/l) Figure 33. Morris Bridge Sink data-sonde results. 45
54 7.0 SUMMARY AND CONCLUSIONS A pumping test was conducted by the District from 8 a.m. on April 13, 2009 to 8 a.m. on May 13, The pumping rate was maintained at a near constant rate of four mgd since this discharge is the expected yield to help meet the minimum low flow criteria for the lower Hillsborough River. TBW continued pumping the Sink at a higher discharge rate at the end of the District s 30-day pumping test as part of an emergency order due to recent drought conditions. TBW pumped the Sink between four and six mgd for nine days after the District s 30-day test until pumping was discontinued around 3 PM on May 22, Beginning on May 13, extremely heavy rains (7.36 to 8.70 inches from nearby rainfall stations) fell over the next 10 days, which increased available water storage in the Hillsborough River Reservoir so that augmentation from the Sink was no longer necessary. Drawdown within Morris Bridge Sink was 2.16 ft. Drawdown within nearby Nursery Sink was 0.30 ft during the pumping event. No significant rainfall was recorded from April 1 through the early morning of April 14. However, a heavy rainfall event occurred during the day on April 14, just after initiation of pumping from the Sink on April 13 with 1.2 inches recorded at S-155 and 1.35 inches at S-163. From that point on, only 0.14 inches (0.011 ft) and 0.19 inches (0.016 ft) of rain fell at S-155 and at S-163, respectively, during the remainder of the 30-day pumping test period. Water levels were collected at several groundwater locations within and outside of the pumping zone. Background water levels decreased in the Upper Floridan aquifer by 1.58 ft during the pumping period. Background water levels decreased in the surficial aquifer by 0.76 ft during the pumping period. Calculated drawdown ranged from 1.72 ft at a distance of 160 ft southwest of the Sink to 1.41 ft at a distance of 550 ft southwest of the Sink. To the east and northeast of the Sink, drawdown was noticeably less with 0.82 ft observed at 516 ft, 0.44 ft at 750 ft, and 0.30 ft at 2,200 ft. The pumping test results of the UFA indicate median transmissivity and storage coefficient values of 172,000 ft 2 /d and 0.11, respectively. The UFA exhibited anisotrophic conditions with less drawdown observed to the east and northeast of the Sink compared to the southwest. The aquifer performance test data indicates higher permeability in the UFA toward the east and northeast of the Morris Bridge Sink which is most likely due to the presence of buried karst features. The fact that Nursery Sink lies to the east of Morris Bridge Sink and transmissivity values calculated from the pumping test were higher from wells in this direction provides some corroborating evidence of this condition. The projected distance from Morris Bridge Sink out to one foot of drawdown within the Upper Floridan aquifer (UFA) is about 500 ft, except toward the southwest where it is closer to 1,000 ft. The distance to two feet of drawdown in the UFA was less than 100 ft from Morris Bridge Sink. 46
55 The results of District testing of Morris Bridge Sink indicate that it can likely provide up to six cfs (four mgd) of water to assist in meeting the minimum low flow of the Hillsborough River during the typical spring dry season. Drawdown within the UFA mostly varied from 0.3 to 2 ft within one-half mile of Morris Bridge Sink. Drawdown within adjacent wetlands and the surficial aquifer was less than one foot based on limited data from this test. However, all of the on-site wetlands were dry and only one surficial aquifer monitoring well (TBW-516S) had reliable data to calculate drawdown from the pumping test. Aquifer performance test analysis indicates that the UFA is in good hydraulic connection with the surficial aquifer with a median leakance coefficient of ft/d/ft calculated by the Hantush-Jacob method. Most of the UFA drawdown is likely to be reflected within the surficial aquifer due to the leaky nature of the geology in the area. It is suggested that numerical modeling of the proposed withdrawal be undertaken prior to implementation of this project to better predict wetland and surficial aquifer response due to withdrawals. Morris Bridge Sink water quality slightly deteriorated with small increases in specific conductance and sulfate concentrations throughout the duration of the pumping event. Water quality sampling of nearby domestic wells, however, indicated no significant water chemistry changes occurred as a result of pumping the Sink at four mgd for 30 days. A well inventory is recommended to determine well construction details and the types of pumping equipment within this zone prior to implementation of this project. Domestic wells that are using submersible pumps should not be adversely impacted by this magnitude of drawdown. However, any homeowner using an above-ground centrifugal pump within 0.25 miles of Morris Bridge Sink may be subject to well interference issues given this level of drawdown. 47
56 REFERENCES Chapter , Florida Administrative Code (F.A.C). Florida Department of Environmental Protection, Secondary Drinking Water Standards. Website: Fetter, C.W., 2001, Applied Hydrogeology, Charles E. Merrill Publishing Co., Columbus, Ohio. Legette, Brashears, and Graham, Inc., 2001, Preliminary evaluation of the Hydrologic Effects of Pumping from Morris Bridge Sink, Spring and Summer, 2000, Prepared for Tampa Bay Water, 14 p. Miller, J. A., 1986, Hydrogeologic Framework of the Upper Floridan Aquifer system in Florida, and parts of Georgia, Alabama, and South Carolina; U.S. Geological Survey Professional Paper 1403-B, 91 p. Stewart, J.W., 1977, Hydrologic effects of pumping a deep limestone sink near Tampa, Florida, U.S.A.: Twelfth International Congress on Karst Hydrogeology, Huntsville, AL, 1977, Proceedings, p SWFWMD, Southwest Florida Water Management District. "Hillsborough River Watershed Management Plan," SWFWMD, Southwest Florida Water Management District, Water Quality Monitoring Program. "The Hydrology and Water Quality of Select Springs in the Southwest Florida Water Management District," May
57 APPENDIX A

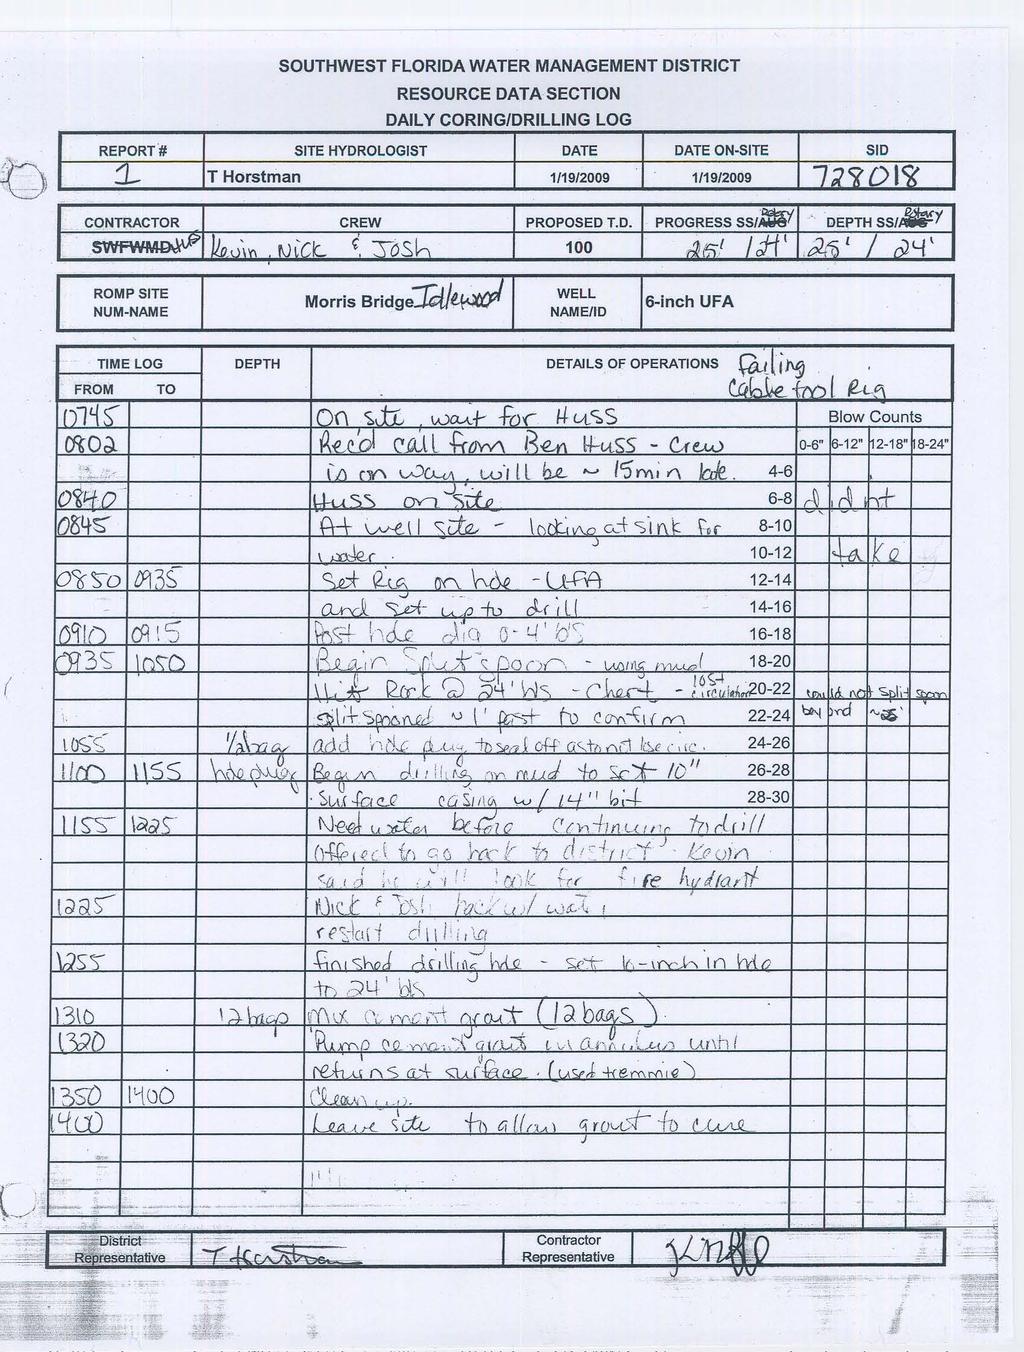
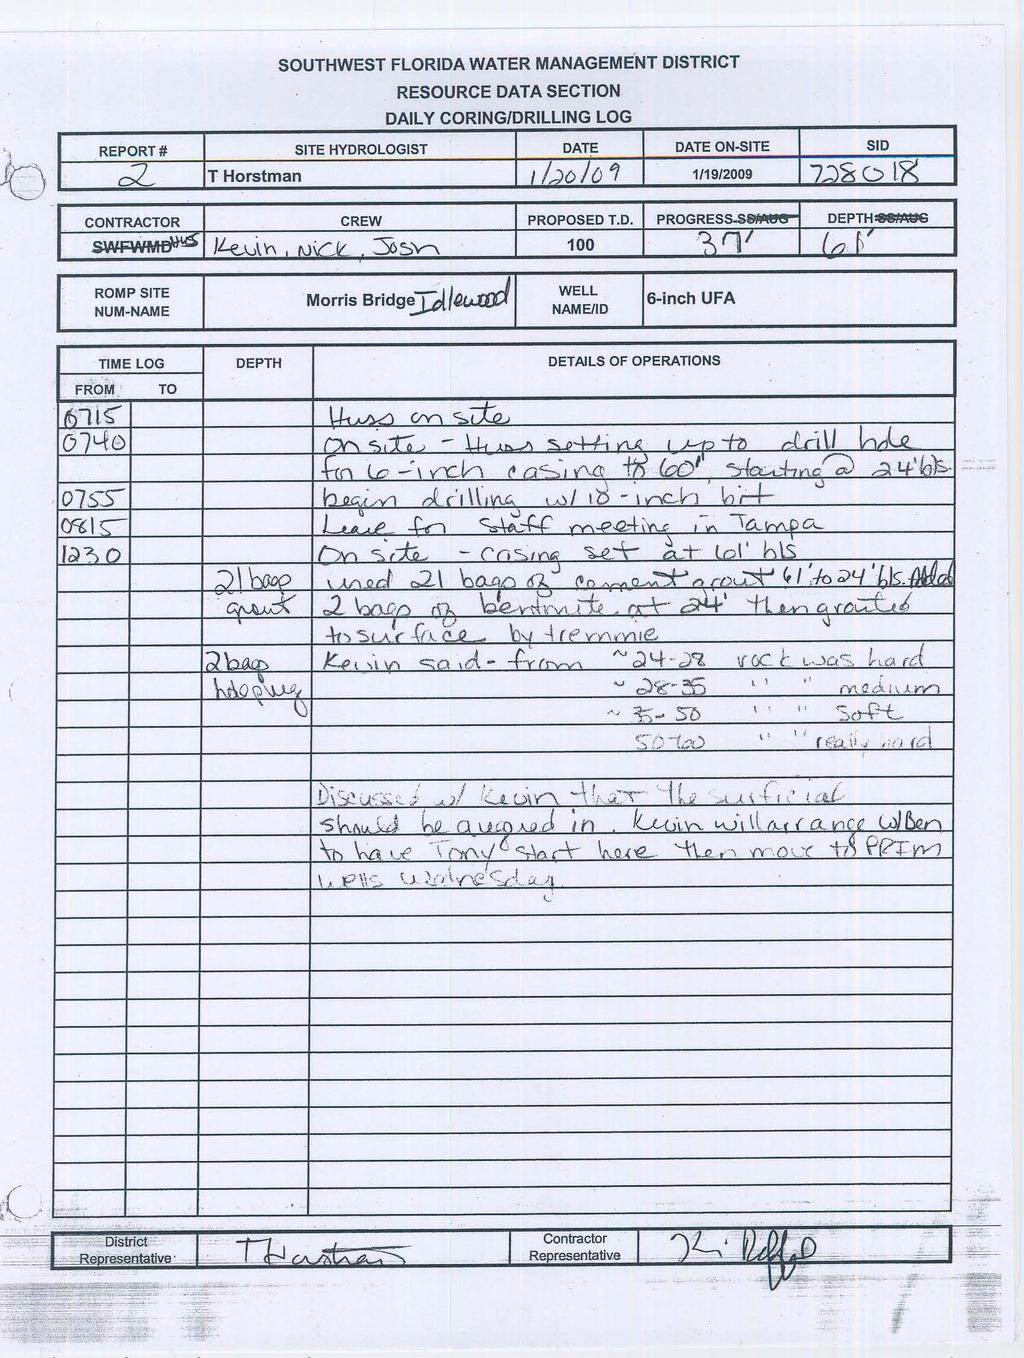
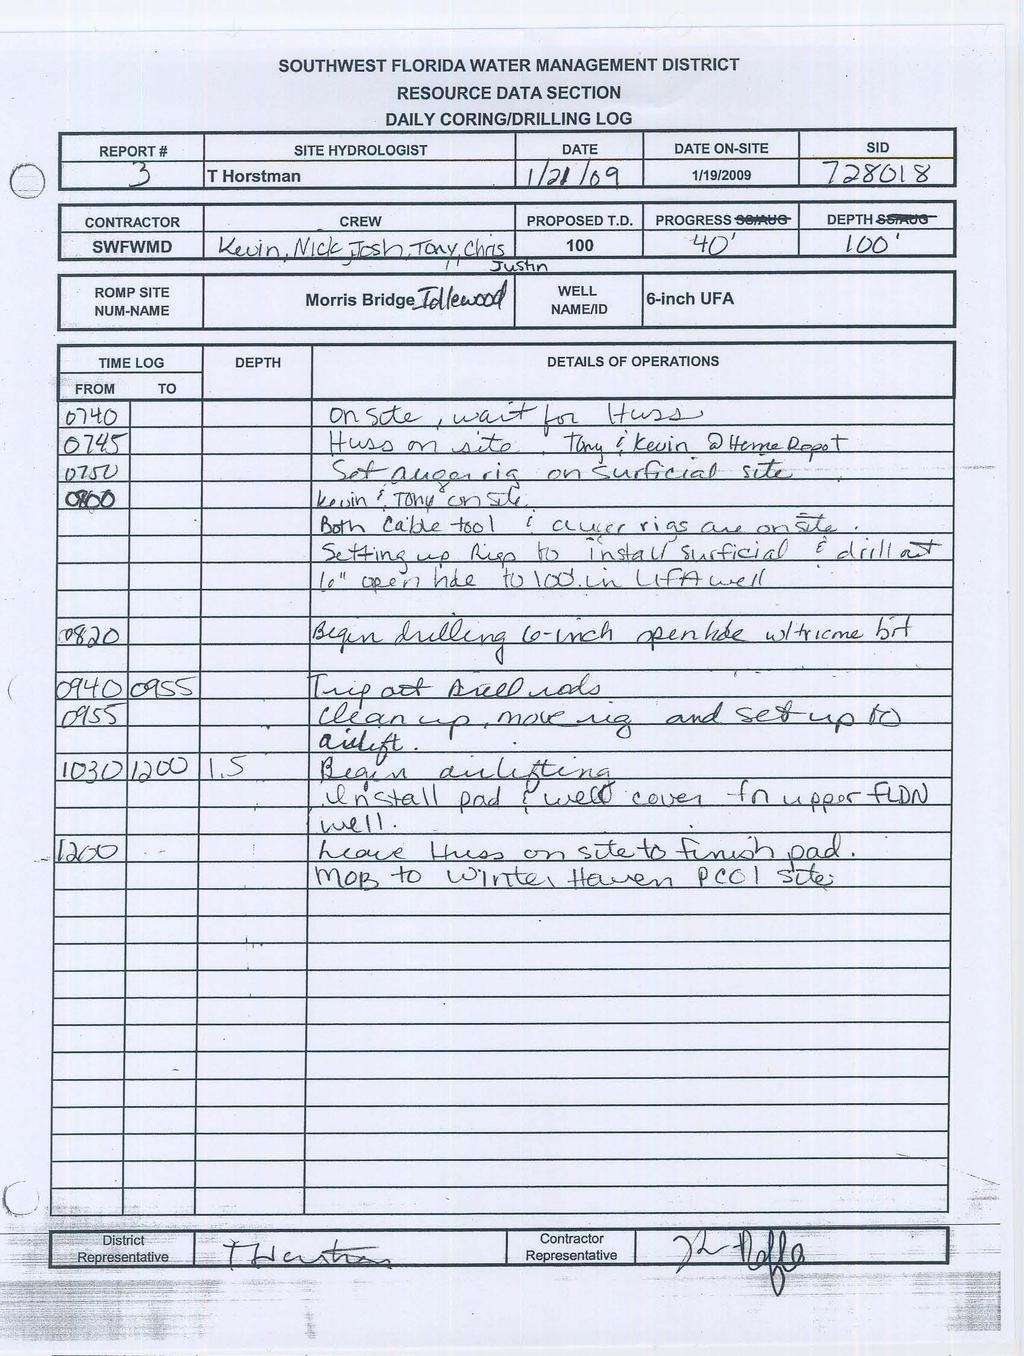
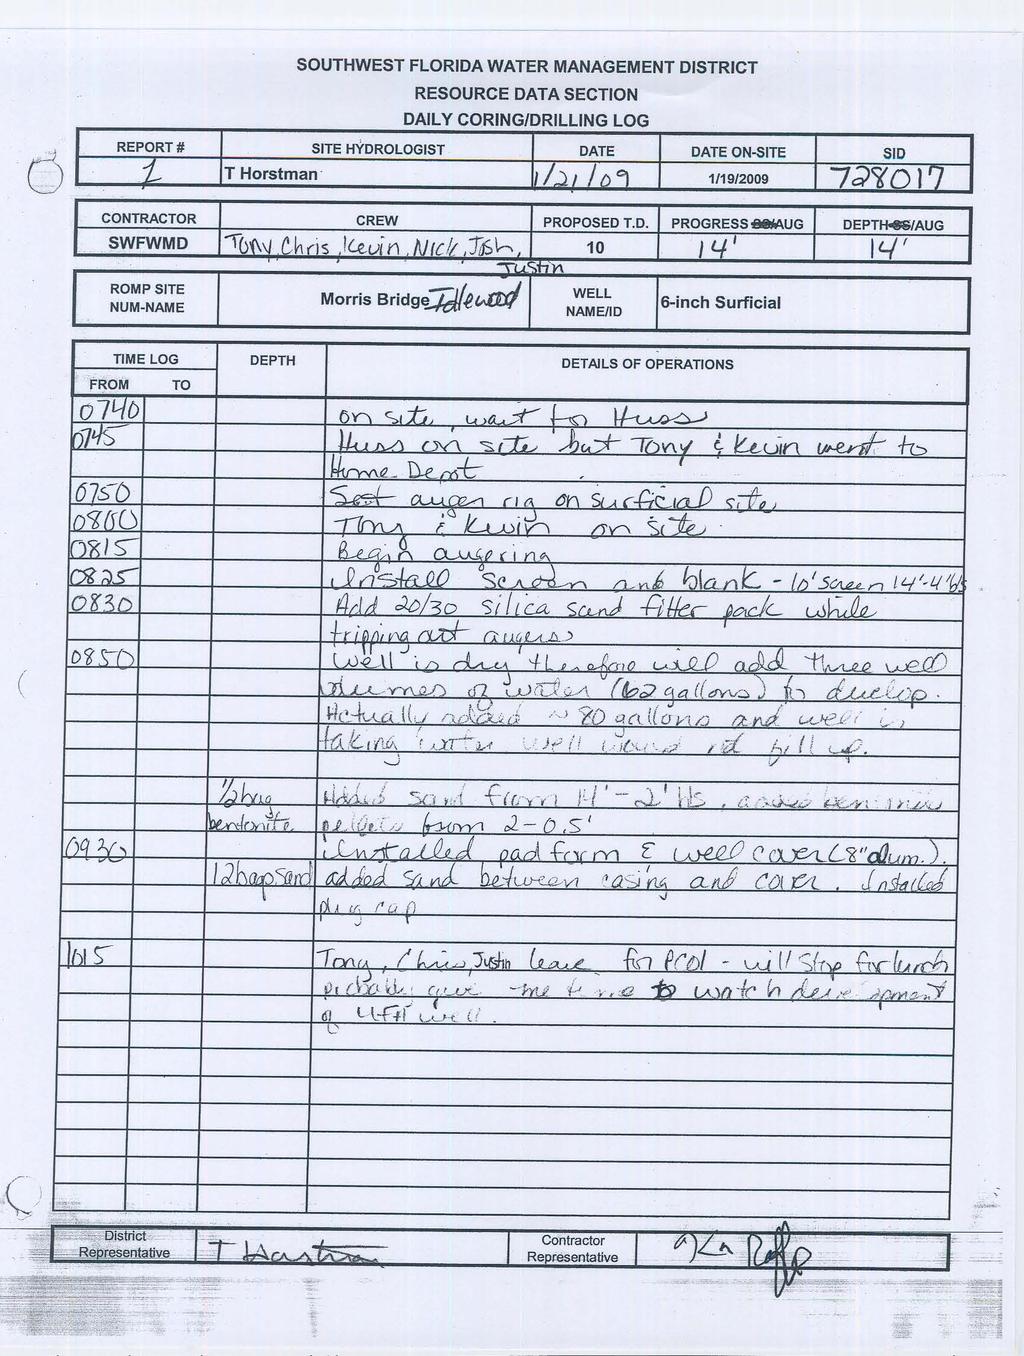
58 February 3, 2009 MEMORANDUM TO: FROM: SUBJECT: Ron Basso, Senior Professional Geologist, Hydrologic Evaluation Section Marty Kelly, Minimum Flows & Levels Program Director, Ecologic Evaluation Mike Holtkamp, Operations Director, Operations Department Roberta Starks, WQMP Manager, WQMP Section David Carr, Staff Environmental Scientist, Ecologic Evaluation Section Jerry Mallams, Geohydrologic Data Manager, Geohydrologic Data Section Tiffany Horstman, Staff Hydrologist, Geohydrologic Data Section Morris Bridge Idlewood Well Construction The Regional Observation and Monitor-well Program (ROMP) of the Geohydrologic Data Section was tasked to install two monitor-wells for the Morris Bridge Sink pump test. An Upper Floridan aquifer well and a surficial aquifer well were constructed approximately 160 feet southwest of the sink Huss Drilling Co. installed the Upper Floridan aquifer well from January 19, 2009 to January 21, 2009, using a Failing rotary rig and installed the surficial aquifer well using a CME 75 drilling rig and hollow-stem augers on January 21, Split-spoon samples were collected from land surface to the top of rock at 24 feet below land surface (bls). Cuttings were looked at periodically but were not collected during installation. Clay was encountered at 14 feet bls and continued to 24 feet bls. The split-spoon hole was converted to the Upper Floridan aquifer well. The surficial aquifer well was installed about 10 feet east of the Upper Floridan aquifer well. The Upper Floridan aquifer well was air-lift developed for 1.5 hours, until the discharge was clear. The surficial aquifer did not contain any water; therefore, 80 gallons of water was added to the well for development (more than 3 well volumes). The surficial aquifer well took the water that was introduced. Attached are the well as-built diagrams, lithology log, and field notes for the two wells. TMH Attachments
59 Well As built Diagrams
60 As-Built for Morris Bridge Idlewood surficial aquifer well Lockable Well Cap 20/30 Silica Sand Lockable Metal Protective Wellhead Feet bls 6-inch Sch 40 PVC Casing (3 ft als - 4 ft bls) ft X 3 ft X 4-inch thick concrete pad Bentonite Seal (0.5 ft bls 2 ft bls) 11-inch Nominal Hollow-stem Auger Hole (LS 14 ft bls) LS 4 6-inch Sch 40 PVC (0.010-inch slot) Well Screen (4 ft bls - 14 ft bls) tiated sand & clay undifferent icial aquifer surfi 20/30 Silica Sand Filter Pack (2 ft bls - 14 ft bls) WCP: SID: S/T/R: 5/28S/20E Latitude: Longitude: Well ID: surficial i aquifer well Rept.Cat.: LWMD Const. Began: 01/21/09 Const. Complete: 01/21/09 12 water table in January 2009 (~12 ft bls) 14 6-inch PVC cap Note: Not to scale Total Depth is 14 feet bls
61 As-Built for Morris Bridge Idlewood Upper Floridan Well Lockable Well Cap Feet 8-inch Lockable Metal Protective Wellhead bls undifferentiated sand & clay surficial aq uifer co onfining unit 3 ft X 3 ft X 4-inch thick concrete pad LS Cement Grout with 2% Bentonite (LS 24 ft bls) 14-inch Nominal Hole (LS 24 ft bls) 10-inch Sch 40 PVC Casing (1 ft als 24 feet bls) 25 Bentonite Seal (24 ft bls 25 ft bls) inch Nominal Hole (24 ft bls 61 ft bls) inch Sch 40 PVC Casing (3 ft als - 61 ft bls) Chert and Lime estone* aquifer llected Upper Floridan No samples co 6-inch Nominal Hole (61 ft bls 100 ft bls) Note: Not to scale * Not enough sample collected to determine Formation. Total Depth is 100 feet bls WCP: SID: S/T/R: 5/28S/20E Latitude: Longitude: Well ID: Upper FLDN aquifer well Rept.Cat.: LWMD Const. Began: 01/19/09 Const. Complete: 01/21/09
62 Lithology
63 perm. not permeable confining unit undifferentiated sand & clay permeable surficial aquifer Box No. Geology Hydrology Hydrostrat. Depth (ft bls) Site Name: Morris Bridge Idlewood Upper FLDN Hydrogeologist: Tiffany Horstman HYDROGEOLOGY FIELD LOG Date Lithology Description Notes 1/19/ /19/ Sand, quartz; Very pale brown; Fine to very fine grained; Few organics and roots. Post hole sample land surface to 4 feet bls 4 ft Sand, quartz; Yellow (10YR 7/6); Very fine to fine grained; Very little organic material. At ~7.5 feet bls there are yellow (10YR 7/8) streaks that may be iron staining. 1/19/ Sand, quartz; White but turns light gray near bottom; Fine to medium grained. Sediments are moist at 10 feet bls. Sediments seem to be saturated at 12 feet bls. 1/19/ Clay, very sandy; Some clayey sand. Light brownish gray (2.5Y 6/2) to moderate brown. At ~ 19 feet bls there is some orange mottling. 1/19/ Clay, slightly sandy; Yellowish gray and light olive gray mottling. From about 21.7 feet to 24 feet bls there is some orange mottling/streaking. 1/19/ Clay, sandy; Yellowish gray. Some siliceous concretions. 1/19/2009 3? UFA Chert with hard white siliceous concretions and clay. Lost circulation at 24 feet bls. May be Tampa Member. Not enough sample to confirm Formation. Limestone cuttings observed during installation.
64 Daily Logs
65
66
67
68
69 APPENDIX B

70 TNTC = Too Numerous to Count
71
72
73 APPENDIX C
74 Water Level (Ft NGVD) Water Level (Ft NGVD) Water Level (Ft NGVD) Water Level (Ft NGVD) 20 Morris Bridge Sink 22 Powerline Sink Marsh* Hours since pumping started Hours since Pumping Started * Probably Dry - Recorded data suspect - requires further investigation 23 Morris Bridge Nursery Marsh* 22 Nursery Sink Hours since Pumping Started Hours since Pumping Started *Appears to have gone dry after 264 hrs
75 Water Level (Ft NGVD) Morris Bridge Nursery Sink Cypress Upland Hours since Pumping Started
76 Water Level (Ft NGVD) Water Level (Ft NGVD) Water Level (Ft NGVD) Water Level (Ft NGVD) 26 Idlewood MB-150 Surf 23 TBW 516 Surficial Hours since Pumping Started Hours since Pumping Started 22 Morris Bridge Nursery Sink Marsh Wetland 28 Morris Bridge Nursery Sink Marsh Upland Hours since Pumping Started Hours since Pumping Started
77 Water Level (Ft NGVD) Water Level (Ft NGVD) Water Level (Ft NGVD) Water Level (Ft NGVD) 28 Morris Bridge Powerline Sink Upland 32 Morris Bridge Nursery Sink Cypress Upland Hours since Pumping Started Hours since Pumping Started 28.0 Morris Bridge Nursery Cypress* 20 Idlewood MB-150 UFA Hours since Pumping Started Hours since Pumping Started * Recorded data suspect - requires further investigation
78 Water Level (Ft NGVD) Water Level (Ft NGVD) Water Level (Ft NGVD) Water Level (Ft NGVD) 21 TBW 516 UFA 22 MB Hours since Pumping Started Hours since Pumping Started 20 MB MB Hours since Pumping Started Hours since Pumping Started
79 APPENDIX D
80 Drawdown (ft) Drawdown (ft) Drawdown (ft) Drawdown (ft) 3.0 Morris Bridge Sink 3.0 Nursery Sink Hours since Pumping Started Hours since Pumping Started 3.0 TBW 516 Shallow 3.0 Nursery Sink Marsh Wetland * Hours since Pumping Started Hours since Pumping Started * Drawdown based on 13 days of pumping, well went dry 316 hours into the test.
81 Drawdown (ft) Drawdown (ft) Drawdown (ft) Drawdown (ft) 3.0 Nursery Sink Cypress Wetland* 3.0 Idlewood MB Hours since Pumping Started *Water level data anomalous (possible recorder problem) Hours since Pumping Started 3.0 TBW MB Hours since Pumping Started Hours since Pumping Started
82 Drawdown (ft) Drawdown (ft) 3.0 MB MB Hours since Pumping Started Hours since Pumping Started
83 APPENDIX E
84 Date Site Identification Number (SID) 2/19/2009 3/23/2009 4/29/2009 5/11/2009 5/18/2009 5/20/2009 5/22/2009 5/27/2009 SID SID SID SID SID SID SID SID SID No DTW No DTW No DTW No DTW No DTW No DTW No DTW No DTW No DTW No DTW No DTW No DTW No DTW No DTW No DTW No DTW No DTW No DTW No DTW No DTW No DTW No DTW No DTW No DTW No DTW No DTW No DTW No DTW No DTW No DTW NS No DTW No DTW No DTW No DTW No DTW No DTW - No depth to water value was able to be obtained
85 APPENDIX F
86 Richdale Dr Hillsborough River Hawk Hill Dr Richdale Dr Trout Creek Park Rd Riverhills Dr ^ Idlewood Dr Rockridge Cir Eloian Dr Verges Rd Ara Dr Charlie B Way Greenfield Rd High Meadow Ave Ramshorn St Sixmile Creek Cow House Creek Williams Rd Ohio Ave « ,000 2,000 Feet August 2009 Legend ^ Morris Bridge Sink Limited Use Wells PWS Distance 0.5-Mile Buffer 1-Mile Buffer Data provided by SWFWMD and HCHD


87 Richdale Dr Hillsborough River Richdale Dr Trout Creek Park Rd A! ^ Riverhills Dr Idlewood Dr Rockridge Cir Eloian Dr A! A! Verges Rd Ara Dr Charlie B Way Hawk Hill Dr Greenfield Rd High Meadow Ave Ramshorn St Sixmile Creek Cow House Creek Williams Rd Ohio Ave « ,000 2,000 Feet August 2009 Legend ^ Morris Bridge Sink Private wells Distance 0.5-Mile Buffer 1-Mile Buffer Data provided by SWFWMD and HCHD
 Ramshorn St «0 250 500 1,000 Feet August 2009 Legend ^ Morris Bridge Sink Private")
88 Idlewood Dr 15 Private Wells (Domestic Self Supply) Cliffside Pl Killington Pl High Meadow Ave Riverhills Dr ^ Rockridge Cir Ara Dr Eloian Dr A! Ara Dr Verges Rd Charlie B Way Citrus Knoll Cir Greenfield Rd Hawk Hill Dr 25 Private Wells (Domestic Self Supply) Ramshorn St « ,000 Feet August 2009 Legend ^ Morris Bridge Sink Private Wells Distance 0.5-Mile Buffer 1-Mile Buffer Data provided by SWFWMD and HCHD

89 Trout Creek Park Rd Hillsborough River 5 Observation/Monitor Wells Hawk Hill Dr 5 Observation/Monitor Wells 2 Irrigation/Livestock Wells Richdale Dr A!!(!( ^ A!(!(! Trout Creek Park Rd Riverhills Dr Idlewood Dr Rockridge Cir Eloian Dr Verges Rd Ara Dr Charlie B Way Greenfield Rd High Meadow Ave Ramshorn St 16 Observation/Monitor Wells 3 Irrigation/Livestock Wells Sixmile Creek Cow House Cre e k Williams Rd Ohio Ave « ,000 2,000 Feet August 2009 Legend ^ Morris Bridge Sink Observation/Monitor Well!( Irrigation/Livestock Distance 0.5-Mile Buffer 1-Mile Buffer Data provided by SWFWMD and HCHD
90
91 APPENDIX G
92 Iron Values Collected from Domestic Wells Part of the Morris Bridge Sink Pumping Test
93
94
95
96 Select Water Quality Parameters Collected from Wells Sampled as part of the Morris Bridge Sink Pumping Test
97
98
99
100
101
102
103 APPENDIX H
104
105
106
107 Figure Select water quality parameters collected from surface water sites as part of the Morris Bridge Sink pumping test.
108
109