ACIDIZING DOLOMITE RESERVOIRS USING HCL ACID PREPARED WITH SEAWATER: PROBLEMS AND SOLUTIONS. A Thesis DENNIS GEORGE ARENSMAN
|
|
|
- Marsha Weaver
- 5 years ago
- Views:
Transcription
1 ACIDIZING DOLOMITE RESERVOIRS USING HCL ACID PREPARED WITH SEAWATER: PROBLEMS AND SOLUTIONS A Thesis by DENNIS GEORGE ARENSMAN Submitted to the Office of Graduate and Professional Studies of Texas A&M University in partial fulfillment of the requirements for the degree of MASTER OF SCIENCE Chair of Committee, Committee Members, Head of Department, Hisham A. Nasr-El-Din Robert Lane Mahmoud El-Halwagi A. D. Hill May 214 Major Subject: Petroleum Engineering Copyright 214 Dennis George Arensman
2 ABSTRACT Seawater is the only viable water source for many offshore wells with dolomite formations. For these wells it is important to use compatible fluids when stimulating to avoid damaging the formation with calcium sulfate precipitation. Much work has been conducted on this problem for limestone, but there have been no publications about calcium sulfate precipitation within dolomite during matrix acidizing. This work quantifies permeability damage when acidizing using hydrochloric acid mixed with seawater and no scale inhibitors. Scale inhibitors were also tested for effectiveness in reducing calcium sulfate scale during acidizing. Static jar tests of three phosphonate-based, two sulphonated polymer-based, and one polyacrylic-based scale inhibitors in spent acid systems were used to compare the effectiveness at temperatures ranging from 77 to 325 F. Corefloods were conducted to investigate the extent of calcium sulfate precipitation without scale inhibitors and to test permeability improvements with the addition of compatible scale inhibitors at temperatures up to 325 F. This work shows that calcium sulfate precipitation within dolomite during matrix acidizing with seawater and hydrochloric acid will damage the well. Corefloods with seawater showed a permeability reduction of 3% or greater compared to corefloods with freshwater for all temperatures tested when no scale inhibitors were included in the acid solution. Calcium sulfate precipitation was determined to be the cause of the decreased permeability. DTPMP, a phosphonate-based scale inhibitor, and a sulfonated ii
3 polymer scale inhibitor at concentrations of 15 ppm were shown to effectively reduce calcium sulfate scale with minimal inhibitor/rock reaction during these tests. The ability to improve stimulation effectiveness by the addition of compatible scale inhibitors to the acid solution is critical information to prevent damaging dolomite formations during matrix acidizing with hydrochloric acid and seawater. iii
4 DEDICATION This work is dedicated to my parents and my fiancée, Holly. iv
5 ACKNOWLEDGEMENTS I would like to thank my committee chair, Dr. Nasr-El-Din, and my committee members, Dr. Lane, and Dr. El-Halwagi, for their guidance and support throughout this research. Thanks also go to my friends and colleagues and the department faculty and staff for making my time at Texas A&M University a great experience. I also want to extend my gratitude to the Acid Stimulation Research Project funding for this research. Finally, I give thanks to my mother and father for their encouragement and to my fiancée for her patience and love. v
6 NOMENCLATURE DI Water HCl k k f k i md P SI SW T t TDS ϕ Deionized water Hydrochloric Acid Permeability Final Permeability Initial Permeability Millidarcy Pressure Scale Inhibitor Seawater Temperature Time Total Dissolved Solids Porosity vi
7 TABLE OF CONTENTS Page ABSTRACT...ii DEDICATION... iv ACKNOWLEDGEMENTS... v NOMENCLATURE... vi TABLE OF CONTENTS...vii LIST OF FIGURES... ix LIST OF TABLES... xiv 1. INTRODUCTION Background Previous Work Statement of Problem Objectives EXPERIMENTAL METHODS Acid Preparation Seawater Preparation Core Preparation Corefloods Static Jar Tests DAMAGE CAUSED BY ACIDIZING DOLOMITE IN THE PRESENCE OF SEAWATER Introduction Results Discussion MITIGATING DAMAGE DUE TO CALCIUM SULFATE SCALE Introduction vii
8 4.2 Results Discussion COMPARISON OF DOLOMITE AND LIMESTONE RESULTS Summary of Calcite Results Discussion SUMMARY AND CONCLUSIONS Summary Conclusions REFERENCES viii
9 LIST OF FIGURES ix Page Figure 1: Piping and instrument diagram of coreflood set-up... 8 Figure 2: Cross-section view of core holder Figure 3: VCL Series visual cell Figure 4: Graph of pressure drop across the tested core for the 77 F DI Water experiment Figure 5: Graph of pressure drop across the tested core compared to dissolved calcium and magnesium concentrations within collected effluent samples for the 77 F DI Water experiment Figure 6: Graph of pressure drop across the tested core compared to the ph of the collected effluent samples for the 77 F DI Water experiment Figure 7: Graph of pressure drop across the tested core for the 77 F seawater experiment Figure 8: Graph of pressure drop across the tested core compared to dissolved calcium and magnesium concentrations within collected effluent samples for the 77 F seawater experiment Figure 9: Graph of pressure drop across the tested core compared to the ph of the collected effluent samples for the 77 F seawater experiment Figure 1: Graph of sulfate concentration in effluent samples measured immediately after collection and one day after collection compared to dissolved calcium concentration within collected effluent samples for the 77 F seawater experiment Figure 11: Graph of pressure drop across the tested core for the 15 F DI Water experiment Figure 12: Graph of pressure drop across the tested core compared to dissolved calcium and magnesium concentrations within collected effluent samples for the 15 F DI Water experiment Figure 13: Graph of pressure drop across the tested core compared to the ph of the collected effluent samples for the 15 F DI Water experiment
10 Figure 14: Graph of pressure drop across the tested core for the 15 F seawater experiment Figure 15: Graph of pressure drop across the tested core for the repeated 15 F seawater experiment Figure 16: Graph of pressure drop across the tested core compared to dissolved calcium and magnesium concentrations within collected effluent samples for the 15 F seawater experiment Figure 17: Graph of pressure drop across the tested core compared to dissolved calcium and magnesium concentrations within collected effluent samples for the repeated 15 F seawater experiment Figure 18: Graph of pressure drop across the tested core compared to the ph of the collected effluent samples for the 15 F seawater experiment Figure 19: Graph of pressure drop across the tested core compared to the ph of the collected effluent samples for the repeated 15 F seawater experiment Figure 2: Graph of sulfate concentration in effluent samples measured immediately after collection and one day after collection compared to dissolved calcium concentration within collected effluent samples for the 15 F seawater experiment Figure 21: Graph of sulfate concentration in effluent samples measured immediately after collection and one day after collection compared to dissolved calcium concentration within collected effluent samples for the repeated 15 F seawater experiment Figure 22: Graph of pressure drop across the tested core for the 25 F DI Water experiment Figure 23: Graph of pressure drop across the tested core compared to dissolved calcium and magnesium concentrations within collected effluent samples for the 25 F DI Water experiment Figure 24: Graph of pressure drop across the tested core compared to the ph of the collected effluent samples for the 25 F DI Water experiment Figure 25: Graph of pressure drop across the tested core for the 25 F seawater experiment x
11 Figure 26: Graph of pressure drop across the tested core compared to dissolved calcium and magnesium concentrations within collected effluent samples for the 25 F seawater experiment Figure 27: Graph of pressure drop across the tested core compared to the ph of the collected effluent samples for the 25 F seawater experiment Figure 28: Graph of sulfate concentration in effluent samples measured immediately after collection and one day after collection compared to dissolved calcium concentration within collected effluent samples for the 25 F seawater experiment Figure 29: Graph of pressure drop across the tested core for the 325 F DI Water experiment Figure 3: Graph of pressure drop across the tested core compared to dissolved calcium and magnesium concentrations within collected effluent samples for the 325 F DI Water experiment Figure 31: Graph of pressure drop across the tested core compared to the ph of the collected effluent samples for the 325 F DI Water experiment Figure 32: Graph of pressure drop across the tested core for the 325 F seawater experiment Figure 33: Graph of pressure drop across the tested core compared to dissolved calcium and magnesium concentrations within collected effluent samples for the 325 F seawater experiment Figure 34: Graph of pressure drop across the tested core compared to the ph of the collected effluent samples for the 325 F seawater experiment Figure 35: Graph of sulfate concentration in effluent samples measured immediately after collection and one day after collection compared to the dissolved calcium concentration within collected effluent samples for the 325 F seawater experiment Figure 36: Graph of pressure drop across the tested core for the 15 F seawater and 15 ppm BHMT experiment Figure 37: Graph of pressure drop across the tested core compared to dissolved calcium and magnesium concentrations within collected effluent samples for the 15 F seawater and 15 ppm BHMT experiment xi
12 Figure 38: Graph of pressure drop across the tested core compared to the ph of the collected effluent samples for the 15 F seawater and 15 ppm BHMT experiment Figure 39: Graph of sulfate concentration in effluent samples measured immediately after collection and one day after collection compared to dissolved calcium concentration within collected effluent samples for the 15 F seawater and 15 ppm BHMT experiment Figure 4: Graph of pressure drop across the tested core for the 77 F seawater and 15 ppm P-tagged sulfonated polymer experiment Figure 41: Graph of pressure drop across the tested core compared to dissolved calcium and magnesium concentrations within collected effluent samples for the 77 F seawater and 15 ppm P-tagged sulfonated polymer experiment Figure 42: Graph of pressure drop across the tested core compared to the ph of the collected effluent samples for the 77 F seawater and 15 ppm P-tagged sulfonated polymer experiment Figure 43: Graph of sulfate concentration in effluent samples measured immediately after collection and one day after collection compared to dissolved calcium concentration within collected effluent samples for the 77 F seawater and 15 ppm P-tagged sulfonated polymer experiment Figure 44: Graph of pressure drop across the tested core for the 25 F seawater and 15 ppm P-tagged sulfonated polymer experiment Figure 45: Graph of pressure drop across the tested core compared to dissolved calcium and magnesium concentrations within collected effluent samples for the 25 F seawater and 15 ppm P-tagged sulfonated polymer experiment Figure 46: Graph of pressure drop across the tested core compared to the ph of the collected effluent samples for the 25 F seawater and 15 ppm P-tagged sulfonated polymer experiment Figure 47: Graph of sulfate concentration in effluent samples measured immediately after collection and one day after collection compared to dissolved calcium concentration within collected effluent samples for the 25 F seawater and 15 ppm P-tagged sulfonated polymer experiment Figure 48: Graph of pressure drop across the tested core for the 77 F seawater and 15 ppm DTPMP experiment xii
13 Figure 49: Graph of pressure drop across the tested core compared to dissolved calcium and magnesium concentrations within collected effluent samples for the 77 F seawater and 15 ppm DTPMP experiment Figure 5: Graph of pressure drop across the tested core compared to the ph of the collected effluent samples for the 77 F seawater and 15 ppm DTPMP experiment Figure 51: Graph of sulfate concentration in effluent samples measured immediately after collection and one day after collection compared to dissolved calcium concentration within collected effluent samples for the 77 F seawater and 15 ppm DTPMP experiment Figure 52: Graph of pressure drop across the tested core for the 15 F seawater and 15 ppm DTPMP experiment Figure 53: Graph of pressure drop across the tested core compared to dissolved calcium and magnesium concentrations within collected effluent samples for the 15 F seawater and 15 ppm DTPMP experiment Figure 54: Graph of pressure drop across the tested core compared to the ph of the collected effluent samples for the 15 F seawater and 15 ppm DTPMP experiment Figure 55: Graph of sulfate concentration in effluent samples measured immediately after collection and one day after collection compared to dissolved calcium concentration within collected effluent samples for the 15 F seawater and 15 ppm DTPMP experiment Figure 56: Graph of pressure drop across the tested core for the 25 F seawater and 15 ppm DTPMP experiment Figure 57: Graph of pressure drop across the tested core compared to dissolved calcium and magnesium concentrations within collected effluent samples for the 25 F seawater and 15 ppm DTPMP experiment Figure 58: Graph of pressure drop across the tested core compared to the ph of the collected effluent samples for the 25 F seawater and 15 ppm DTPMP experiment Figure 59: Graph of sulfate concentration in effluent samples measured immediately after collection and one day after collection compared to dissolved calcium concentration within collected effluent samples for the 25 F seawater and 15 ppm DTPMP experiment xiii
14 LIST OF TABLES Page Table 1: Table of ion concentrations in seawater at different locations around the middle east and the average ion concentration within seawater. Concentrations in the table are shown in units of ppm Table 2: Weight of salts added to 4 ml of synthetic seawater to create a synthetic environment of (partially) spent acid in dolomite Table 3: Volume of scale inhibitor added to 4 ml 1 wt% partially spent acid sample to obtain a desired inhibitor concentration Table 4: Table summarizing initial and final core conditions along with flow rate Table 5: Table summarizing the amount of precipitated sulfate during each test and dissolved calcium and magnesium Table 6: Results of static jar tests. The cells highlighted in red indicate scale inhibitor failed the test at the specified concentration, and cells highlighted green indicate that the test passed at the specified conditions Table 7: Pictures of samples at the end of the static jar tests with 15 ppm of each scale inhibitor Table 8: Summary of initial and final core conditions for all corefloods (with and without scale inhibitors) Table 9: Summary of precipitated sulfate and dissolved calcium and magnesium, determined by chemical analysis of collected samples, for each set of seawater experiments xiv
15 1. INTRODUCTION 1.1 Background Stimulating carbonate reservoirs by injecting HCl into the reservoir is a common technique that has been used in the field for decades. Both calcite and dolomite reactions with HCl have been well studied 1. In a perfect open system at standard temperature and pressure with pure dolomite and HCl reaction the reaction is as follows: CaMg(CO 3 ) 2 + 4HCl CaCl 2 + MgCl 2 + 2CO 2 + 2H 2 O (1-1) During the reaction calcium and magnesium ions are released into solution to bond with monovalent and divalent ions; which leads to the potential for scales to form. Local water sources are the main source of water injected into oilfields. In offshore locations the only local source of water is seawater. During stimulation treatments, seawater can be used during every stage of the operation from pre-flush to post-flush including diluting acids. Seawater contains high concentrations of sulfate, which can lead to the following reactions during matrix acidizing of dolomite; Ca 2+ + SO xh 2 O CaSO 4 xh 2 O (1-2) where x=, 1/2, and 2 and, Mg 2+ + SO xh 2 O MgSO 4 xh 2 O. (1-3) Magnesium sulfate is soluble in all conditions present within the oilfield so the reaction shown in (1-3) does not need to be considered, but calcium sulfate will precipitate in field conditions. The forms of calcium sulfate that can occur are anhydrite (CaSO 4 ), hemihydrate (CaSO 4 1/2H 2 O), and gypsum (CaSO 4 2H 2 O). Gypsum is the stable phase 1
16 up to 4 C, anhydrite is the stable phase above 12 C, and hemihydrate is the stable phase at intermediate temperatures with high TDS brines 2. Temperature and ionic strength are the predominant factors affecting calcium sulfate solubility with other factors, like ph and flow rate, having a smaller influence on the scale solubility 3. Scale inhibitors are included during matrix acidizing treatments to prevent scales from forming and have two main inhibition mechanisms: nucleation inhibition and crystal growth inhibition 4. Nucleation inhibition is the prevention of scales from starting to form crystals while crystal growth inhibition is the prevention of already formed scale crystals from growing. Scale inhibitors have been tested in acidic calcite environments, for squeeze treatments, and for water injection in all types of carbonate environments for various types of scales 5. Unfortunately every environment is different and testing of various scale inhibitors is always required to find the best scale inhibitor for each environment. 1.2 Previous Work Previous work similar to the experiments discussed later have been conducted on the reduction of calcium sulfate scale during matrix acidizing of carbonates 5c, 5d, 6, but the authors tested calcite and not dolomite while claiming the result held true for all carbonates. The problem with assuming results from work with calcite is true for all carbonates is that calcium sulfate is dependent on ion concentration within the brine for solubility and crystal structure 2b and scale inhibitors are dependent on both ion concentration within the brine and the Ca 2+ /Mg 2+ ratio 7. Differences in rock mineralogy 2
17 cause calcite that is acidized with HCl to release twice as many calcium ions as dolomite. Also, dolomite contains magnesium ions which are not present in calcite. For these reasons dolomite needs to be analyzed separately from calcite for scaling tendencies and scale inhibitor compatibility. 1.3 Statement of Problem Seawater is the only viable source of surface water for injection in an increasing number of wells. If the seawater is compatible with the formation brine, then this practice will not cause additional damage to the well. However, when hydrochloric acid is injected into a dolomite reservoir with seawater present, the calcium ions released during the dolomite dissolution will bond with free sulfate ions within seawater to form calcium sulfate scale. The flow path within the dissolved dolomite is then restricted by calcium sulfate scale attaching to pore walls and pore throats. Scale inhibitors can be added in order to mitigate scale formation, but not all scale inhibitors will effectively prevent calcium sulfate scale. Furthermore, not all scale inhibitors are compatible with the high salinity environment, which may result in precipitation. 1.4 Objectives Experiments were designed to quantify damage caused by acidizing dolomite with HCl in the presence of seawater. The potential of various scale inhibitors to inhibit scale formation under conditions that promote scale formation during acidizing of dolomite with HCl was examined and quantified using the permeability change resulting 3
18 from the treatment. Finally, the results from these experiments will be compared with results from studies on calcite. 4
19 2. EXPERIMENTAL METHODS 2.1 Acid Preparation ACS grade HCl was diluted to 15 wt% using either DI water or seawater. The diluting fluid was matched with the pre- and post- flush fluids for each experiment. 2.2 Seawater Preparation Table 1 below shows the average seawater composition from locations around the world and the composition of seawater at the Arabian Gulf at Kuwait. The composition of seawater for the Arabian Gulf at Kuwait has a very high sulfate concentration for seawater. For these studies high sulfate concentration was desired, so synthetic seawater was created according to the composition of seawater at Arabian Gulf at Kuwait. The table lists the salt concentration in ppm. To create the synthetic seawater, first the salts were weighed out and added to the desired volume of water. Then, the salts and water were mixed with an overhead mixer at 45 rpm until no visible salts remained in the water. 5
20 Table 1: Table of ion concentrations in seawater at different locations around the world and the average ion concentration within seawater. Concentrations in the table are shown in units of ppm. Typical Seawater Chloride (Cl - ) 18,98 23, Sodium (Na + ) 1,556 15,85 Sulfate (SO 4 2- ) 2,649 3,2 Magnesium (Mg 2+ ) 1,262 1,765 Calcium (Ca 2+ ) 4 5 Potassium (K + ) Bicarbonate (HCO 3 - ) Strontium (Sr 2+ ) 13 - Bromide (Br - ) 65 8 Borate (BO 3 3- ) 26 - Fluoride (F - ) 1 - Silicate (SiO 3 2- ) Iodide (I - ) <1 - Others - - Arabian Gulf at Kuwait Total Dissolved Solids (TDS) 34,483 45, 2.3 Core Preparation Dolomite cores were first cut into cylinders of 1.5 inch diameter by 6 inch length. The cut cores were then placed in a 25 F oven for 4 hours to dehydrate the cores. Each core was then weighed to get the dry weight of the core. Next, the cores were saturated in either DI water or seawater. The initial permeability for each core was then measured 6
21 using the coreflood at a minimum two different flow rates; preferably three flow rates were used. Cores with initial permeability in the range.3 to 4 md were tested in these experiments. If the core was later decided to be used for seawater application these steps would be repeated and seawater would be substituted for DI water. Each core was reweighed after the saturation step to obtain the saturated weight. Each core s porosity was calculated from the wet and dry weight of each core. 2.4 Corefloods Figure 1 shows the piping and instrument diagram of the coreflood set-up used in these studies. Pressure is applied to each fluid cylinder by the syringe pump at a constant flow rate. Each valve above the pistons can be opened and closed independently to select which fluid is pushed through the coreflood. An effluent sample collection area is set-up to collect fluid exiting the core holder in test tubes or a waste container. Pressure drop across the core is measured using a pressure gauge with lines connected to each end of the core holder, and then recorded electronically as the pressure gauge transmits the recorded values to a computer. 7
22 PI C Nitrogen Effluent PI Overburden Oil Collection Fluid Waste Brine Piston DI Piston Acid Piston P Overburden Pump PI Oil Refill Syringe Pump Oil Collection Figure 1: Piping and instrument diagram of coreflood set-up. Figure 2 shows a cross-sectional view of the core holder used in these studies. Within the metal frame is an overburden sleeve surrounded by oil. A core is placed within the overburden sleeve so that when pressure is applied to the overburden sleeve flow around the core is restricted. Oil around the overburden sleeve can be added to increase pressure applied by using a hand pump. 8
23 Inlet Heating Core Overburden Outlet Overburden Figure 2: Cross-section view of core holder. Corefloods testing initial permeability used an overburden pressure of 2 PSI, a back pressure of PSI, and a temperature of 77 F. Corefloods during the acidizing experiments used an overburden pressure of 2 PSI, a back pressure of at least 1 PSI, and a temperature of 77 F, 15 F, 25 F, or 325 F, depending on the experiment. Backpressure was maintained above 1 psi during acidizing tests to prevent the release of CO 2 generated by the reactions within the core. After the core was placed in the core holder the saturation fluid would be injected through the core until equilibrium conditions within the core were achieved. Then, the temperature would be raised to the desired level (if applicable) and the conditions would be allowed to return to equilibrium. After equilibrium conditions were achieved, 2 ml of acid would be injected through the core followed by a post-flush of the original saturation fluid. The experiment would conclude once equilibrium conditions, based on sulfate concentration of collected samples, were observed once again. 9
24 2.5 Static Jar Tests Solutions were mixed to simulate the spent acid environment with dolomite according to Table 2. For these tests, the salts were mixed with 4 ml of synthetic seawater and 1 wt% HCl. Scale inhibitors were added to the synthetic spent acid environment according to Table 3. Then, the sample was placed within a Hassler-type visual cell, shown in Figure 3, and brought to the desired temperature. Samples were exposed to test temperatures for 3 minutes to allow the full amount of scale to precipitate. According to He et al. (213) scale inhibitors will be least effective during the 1 wt% partially spent HCl condition during matrix acidizing. Table 2: Weight of salts added to 4 ml of synthetic seawater to create a synthetic environment of (partially) spent acid in dolomite. Salts Added to Simulate 4 ml (Partially) Spent Acid Environment in Dolomite 15 wt% HCl 1 wt% Partially Spent HCl 5 wt% Partially Spent HCl 1 wt% Partially Spent HCl Completely Spent HCl Density, g/cm Volume, cm MgCl 2 6(H 2 O), g Added to Mixture CaCl 2 2(H 2 O), g Added to Mixture
25 Table 3: Volume of scale inhibitor added to 4 ml 1 wt% partially spent acid sample to obtain a desired inhibitor concentration. Volume of Scale Inhibitors Added to 4 ml Partially Spent Acid Environment Scale inhibitor Concentration, mg/l Density, g/ml Volume Scale Inhibitor (μl) for a 4 ml Sample PPCA, ml Sulfonated Polymer, ml PAA, ml P-tagged Sulfonated Polymer, ml DTPMP, ml BHMT, ml Sample Size 4. ml A 1 wt% partially spent acid solution was prepared using seawater. Then, the scale inhibitor was added, and finally CaCl 2 and MgCl 2 were added according to calculations in Table 2. 11

26 Figure 3: VCL Series visual cell. 12
27 3. DAMAGE CAUSED BY ACIDIZING DOLOMITE IN THE PRESENCE OF SEAWATER 3.1 Introduction Acid reaction with calcite is much faster than acid reaction with dolomite. Reaction rates of HCl and dolomite will increase as temperature increases until the reaction is transport limited rather than reaction rate limited at about 2 F 8. Clays such as illite within the dolomite, however, can slow or even prevent the rock from reacting with the HCl because they do not react with HCl and will form an impenetrable layer for the acid when the surrounding rock is dissolved 1c. When acid is injected into a core too slowly a single wormhole with a large diameter will form, at too high of flow rates many small wormholes will form 9. This is caused by the reaction rate of acid and the flow rate of the acid resulting in 1) high reaction rates and low flow rates that allow the acid to form a dominant channel with higher permeability which will encourage more acid to flow through that same wormhole and continuously increase the size of the dominant wormhole, or 2) low reaction rates and high flow rates that allow the acid to form many small wormholes since the acid will not have time to dissolve a single wormhole to encourage acid to continue flowing along the same path. In laboratory corefloods if the reaction rate is very high and the flow rate is very low, a phenomenon called face dissolution occurs on the core, which is when the acid reacts completely with the core before it enters the core. This causes the inlet of the core to be dissolved and no wormholes to form. For the 13
28 current set of experiments, face dissolution needs to be avoided to allow over-saturation conditions to occur within the core; not before entering the core. Formation of the other two types of wormholes is desirable since both will allow over-saturation conditions to be created within the core. Magnesium that is freed during the dissolution of dolomite by HCl will bond with the free sulfates when seawater is present in quantities allowing over-saturation conditions to exist. Magnesium sulfate has many crystal forms with water, such as MgSO 4, MgSO 4 H 2 O, MgSO 4 2H 2 O, MgSO 4 7H 2 O, et cetera, and all of these forms are soluble in water at all reservoir conditions 1. This means that magnesium sulfate is not a potential source of damage during the coreflood experiments. Calcium that is freed during the dissolution of dolomite by HCl will bond with the free sulfates when seawater is present in quantities allowing over-saturation conditions to exist. Calcium sulfate has three different forms: anhydrite (CaSO 4 ), hemihydrate (CaSO 4 1/2H 2 O), and gypsum (CaSO 4 2H 2 O) 11. Below 4 C gypsum is the predominant stable form of calcium sulfate scale that will form and above 12 C anhydrite is the predominant form of calcium sulfate scale that will form. The Solubility of Gypsum decreases with increased temperature above 4 C while the solubility of hemihydrate and anhydrite decreases with increases temperature at all temperatures. Pressure does not affect the solubility of any form of calcium sulfate. Calcium sulfate will start to grow gypsum crystals at ph values as low as 4.5 to 6.6 and at lower ph values 2.3 hemihydrate and gypsum crystals that form will slowly transform into anhydrite
29 Precipitated crystals will form along walls and pore throats. Any scale that forms along pore throats restricts flow 3-4 times more than scale that forms along walls 13. So long as the scale precipitates while in the bulk solution, the Peclet number will describe the deposition of particles in the absence of particle/pore repulsions. Veerapen also found that scale deposition diminished as flow rate increased. 3.2 Results In order to determine the amount of damage caused by sulfate precipitation, corefloods were run using DI water and seawater at predetermined temperatures. The temperatures tested were 77, 15, 25, and 325 F. Side-by-side comparison shows how much the dolomite would be stimulated in an ideal case (no sulfate present) and how much stimulation, or damage, there is in the non-ideal case (sulfate present). The comparison creates a quantifiable amount of damage caused by calcium sulfate precipitation within this system by comparing the ratio of final permeability to initial permeability (k f /k i ) from each case Temperature = 77 F The DI water coreflood at 77 F increased the permeability within the core while not causing breakthrough. The k f /k i ratio for this case was 1.14 meaning stimulation occurred. Figure 4 shows the graph of the pressure drop across the core for this experiment and it shows how the pressure drop across the core corresponds to the introduction of each fluid. Figure 5 shows the graph of pressure drop across the core 15
30 compared with the concentration of dissolved calcium and magnesium in the collected effluent samples. The rise and fall of the calcium and magnesium concentrations correspond with the introduction and removal of acid from the system. The calcium concentrations reached below supersaturation concentrations by the end of the experiment indicating that no precipitation of calcium carbonate could take place after the coreflood. Sulfate was not measured during this experiment, nor during any other experiment with DI water as the pre- and post- flush fluid, because no sulfate was introduced into the core during the coreflood. Figure 6 shows a comparison between the pressure drop across the core and the ph of the collected effluent samples. The ph lowers when HCl is added to the system as expected, and then rises after DI Water is reinjected through the core. DI Water Run at 77 F: Test Data Pressure Drop Across Core, PSI Pre- Flush Acid Injection Post-Flush Figure 4: Graph of pressure drop across the tested core for the 77 F DI Water experiment. 16
31 DI Water Run at 77 F: [Ca] 2+, [Mg] 2+, and Pressure Data Pressure Drop Across Core, PSI Pre- Flush Acid Injection Post-Flush Pressure Drop Across Core Calcium Concentration Magnesium Concentration [Ca] 2+ and [Mg] 2+, mg/l Figure 5: Graph of pressure drop across the tested core compared to dissolved calcium and magnesium concentrations within collected effluent samples for the 77 F DI Water experiment. DI Water Run at 77 F: Pressure Data vs ph Pressure Drop (PSI) Pre- Flush Acid Injection Post-Flush Pressure Drop Across Core ph ph Figure 6: Graph of pressure drop across the tested core compared to the ph of the collected effluent samples for the 77 F DI Water experiment. The coreflood using seawater and no scale inhibitors at 77 F showed large amounts of damage caused by sulfate scale formation. This core was damaged as shown 17
32 by the k f /k i ratio of.93. Figure 7 shows the graph of pressure drop across the core for this experiment and Figure 8 shows the graph comparing calcium and magnesium ratios in collected samples to the pressure drop across the core. Both of these graphs have similar trends to the ones for the experiment with DI Water at 77 F. Figure 9 shows the comparison of ph in the collected effluent samples to pressure drop across the core. There was less of a drop in ph in the collected samples this time indicating that the acid reacted more fully in this test than in the DI water test. Sulfate concentration was measured immediately after the coreflood and after a delay of at least 24 hours which allowed all scaling products to fully react and bring the chemicals within the sample to saturation levels as shown in Figure 1. Seawater Run at 77 F: Test Data Pressure Drop Across Core, PSI Pre- Flush Acid Injection Post- Flush Figure 7: Graph of pressure drop across the tested core for the 77 F seawater experiment. 18
33 Seawater Run at 77 F: [Ca] 2+, [Mg] 2+, and Pressure Data Pressure Drop Across Core, PSI Pre- Flush Acid Injection Post- Flush Pressure Drop Across Core Calcium Concentration Magnesium Concentration [Ca] 2+ and [Mg] 2, mg/l Figure 8: Graph of pressure drop across the tested core compared to dissolved calcium and magnesium concentrations within collected effluent samples for the 77 F seawater experiment. Seawater Run at 77 F: ph and Pressure Data Pressure Drop Across Core, PSI Pre- Flush Acid Injection Post- Flush Pressure Drop Across Core ph ph Figure 9: Graph of pressure drop across the tested core compared to the ph of the collected effluent samples for the 77 F seawater experiment. 19
34 3 Seawater Run at 77 F: [Ca] 2+ and [SO 4 ] [Ca] 2+, mg/l Calcium Concentration Sulfate Concentration Immediately After Collection Sulfate Concentration One Day After Collection [SO 4 ] 2-, mg/l Figure 1: Graph of sulfate concentration in effluent samples measured immediately after collection and one day after collection compared to dissolved calcium concentration within collected effluent samples for the 77 F seawater experiment Temperature = 15 F The DI water coreflood at 15 F increased the permeability within the core while not causing breakthrough. For this case a k f /k i ratio of 1.33 was obtained. Note that the initial permeability for this test was 3.1 md. More stimulation is noted in this core than in the experiment with DI Water at 77 F due to the increased temperature increasing acid reactivity of the HCl. Figure 11 shows the pressure drop across the core, Figure 12 shows the comparison of pressure drop across the core to calcium and magnesium concentrations within the collected effluent samples, and Figure 13 shows a comparison of ph from the collected effluent samples to pressure drop across the core. All these graphs show that the ending condition of the core was such that no acid breakthrough occurred and no further reactions would occur within the core after the experiment. In Figure 13 there is a second drop in the ph of the collected samples after the acid 2
35 injection finished. This drop in ph suggests that live acid became trapped within a large vug during matrix acidizing and was released after DI Water was reinjected into the core. 12 DI Water Run at 15 F: Test Data Pressure Drop Across Core, PSI Pre- Flush Acid Injection Post Flush Figure 11: Graph of pressure drop across the tested core for the 15 F DI Water experiment. 21
36 12 DI Water Run at 15 F: [Ca] 2+, [Mg] 2+, and Pressure Data 25 Pressure Drop Across Core, PSI Pre- Flush Acid Injection Post Flush Pressure Drop Across Core Calcium Concentration Magnesium Concentration [Ca] 2+ and [Mg] 2+, mg/l Figure 12: Graph of pressure drop across the tested core compared to dissolved calcium and magnesium concentrations within collected effluent samples for the 15 F DI Water experiment. 12 DI Water Run at 15 F: ph and Pressure Data 14. Pressure Drop Across Core, PSI Pre- Flush Acid Injection Post Flush Pressure Drop Across Core ph ph Figure 13: Graph of pressure drop across the tested core compared to the ph of the collected effluent samples for the 15 F DI Water experiment. 22
37 The coreflood using seawater and no scale inhibitors at 15 F showed large amounts of damage caused by sulfate scale formation, the k f /k i ratio was.91 for the original core with a permeability of.33 and the k f /k i ratio was.81 for the repeated experiment which had a core with an initial permeability of 3.39 (comparable permeability to the DI Water test run). Figures for the first test run are as follows: Figure 14 shows the pressure drop across the original core and Figure 15 shows this for the core in the repeated coreflood. Figure 16 shows the comparison of pressure drop across the core to calcium and magnesium concentrations within the collected effluent samples and Figure 17 shows this for the core in the repeated coreflood. Figure 18 shows a comparison of ph from the collected effluent samples to pressure drop across the core and Figure 19 shows this for the core in the repeated coreflood. Figure 2 shows a comparison of sulfate concentration in collected effluent samples immediately after collection and one day after collection against calcium concentration within collected effluent samples and Figure 21 shows this for the core in the repeated coreflood. All of these graphs show that the ending condition of the core was such that no acid breakthrough occurred and no further reactions would occur within the core after the experiment. 23
38 7 Seawater Run at 15 F: Test Data 6 Pressure Drop Across Core, PSI Pre- Flush Acid Injection Post Flush Figure 14: Graph of pressure drop across the tested core for the 15 F seawater experiment. 12 Seawater at 15 F with (Repeat): Test Run Data Pressure Drop Across Core, PSI Pre- Flush Acid Injection Post- Flush Figure 15: Graph of pressure drop across the tested core for the repeated 15 F seawater experiment. 24
39 7 Seawater Run at 15 F: [Ca] 2+, [Mg] 2+, and Pressure Data 25 Pressure Drop Across Core, PSI Pre- Flush Acid Injection Post Flush Pressure Drop Across Core Calcium Concentration Magnesium Concentration [Ca] 2+ and [Mg] 2+, (mg/l) Figure 16: Graph of pressure drop across the tested core compared to dissolved calcium and magnesium concentrations within collected effluent samples for the 15 F seawater experiment. Pressure Drop Across Core, PSI Pre- Flush Seawater at 15 F with (Repeat): [Ca] 2+, [Mg] 2+, and Pressure Data Acid Injection Post- Flush Pressure Drop Across Core Calcium Concentration Magnesium Concentration [Ca] 2+ and [Mg] 2+, mg/l Figure 17: Graph of pressure drop across the tested core compared to dissolved calcium and magnesium concentrations within collected effluent samples for the repeated 15 F seawater experiment. 25
40 7 Seawater Run at 15 F: ph and Pressure Data Pressure Drop Across Core, PSI Pre- Flush Acid Injection Post- Flush Pressure Drop Across Core ph ph Figure 18: Graph of pressure drop across the tested core compared to the ph of the collected effluent samples for the 15 F seawater experiment. Seawater at 15 F with (Repeat): ph and Pressure Data Pressure Drop Across Core, PSI Pre- Flush Acid Injection Pressure Drop Across Core ph Post- Flush ph Figure 19: Graph of pressure drop across the tested core compared to the ph of the collected effluent samples for the repeated 15 F seawater experiment. 26
41 Seawater Run at 15 F: [Ca] 2+ and [SO 4 ] [Ca] 2+, mg/l Calcium Concentration Sulfate Concentration Immediately After Collection Sulfate Concentration One Day After Collection [SO 4 ] 2-, mg/l Figure 2: Graph of sulfate concentration in effluent samples measured immediately after collection and one day after collection compared to dissolved calcium concentration within collected effluent samples for the 15 F seawater experiment. Seawater Run at 15 F (Repeat): [Ca] 2+ and [SO 4 ] [Ca] 2+, mg/l Calcium Concentration Sulfate Concentration Immediately After Collection Sulfate Concentration One Day After Collection [SO 4 ] 2-, mg/l Figure 21: Graph of sulfate concentration in effluent samples measured immediately after collection and one day after collection compared to dissolved calcium concentration within collected effluent samples for the repeated 15 F seawater experiment. 27
42 3.2.3 Temperature = 25 F The DI water coreflood at 25 F increased the permeability within the core while not causing breakthrough. Flow rate was increased at this temperature from.5 to 2 cc/minute to prevent face dissolution from occurring on the core when HCl was introduced. A total of 13 moles of HCl was collected within the effluent samples due to the increased flow rate, but breakthrough did not occur within the core so the experiment was considered a success. A k f /k i ratio of 1.31 was obtained from the experiments. Figure 22 shows the pressure drop across the core, Figure 23 shows the comparison of pressure drop across the core to calcium and magnesium concentrations within the collected effluent samples, and Figure 24 shows a comparison of ph from the collected effluent samples to pressure drop across the core. All these graphs show that the ending condition of the core and the fluid contained therein was such that no further reactions would occur within the core after the experiment and no acid breakthrough occurred during the experiment. 28
43 DI Water Run at 25 F: Test Data 4 35 Pressure Drop Across Core, PSI Preflush Acid Injection Post-flush Figure 22: Graph of pressure drop across the tested core for the 25 F DI Water experiment. 4 DI Water Run at 25 F: [Ca] 2+, [Mg] 2+, and Pressure Data 9 Pressure Drop Across Core, PSI Pre-flush Acid Injection Post-flush Pressure Drop Across Core Calcium Concentration Magnesium Concentration [Ca] 2+ and [Mg] 2+, (mg/l) Figure 23: Graph of pressure drop across the tested core compared to dissolved calcium and magnesium concentrations within collected effluent samples for the 25 F DI Water experiment. 29
44 DI Water Run at 25 F: ph and Pressure Data Pressure Drop Across Core, PSI Pre-flush Acid Injection Pressure Drop Across Core ph Post-flush ph Figure 24: Graph of pressure drop across the tested core compared to the ph of the collected effluent samples for the 25 F DI Water experiment. The coreflood using seawater and no scale inhibitors at 25 F showed large amounts of damage caused by sulfate scale formation, k f /k i ratio was.71. Figure 25 shows the pressure drop across the core, Figure 26 shows the comparison of pressure drop across the core to calcium and magnesium concentrations within the collected effluent samples, Figure 27 shows a comparison of ph from the collected effluent samples to pressure drop across the core, and Figure 28 shows a comparison of sulfate concentration in collected effluent samples immediately after collection and one day after collection against calcium concentration within collected effluent samples. All these graphs show that the ending condition of the core was such that no acid breakthrough occurred and no further reactions would occur within the core after the experiment. In this experiment the HCl fully reacted with the dolomite. 3
45 Seawater Run at 25 F: Test Data 9 8 Pressure Drop Across Core, PSI Pre-flush Acid Injection Post-flush Figure 25: Graph of pressure drop across the tested core for the 25 F seawater experiment. Seawater Run at 25 F: [Ca] 2+, [Mg] 2+, and Pressure Data 9 3 Pressure Drop Across Core, PSI Pre-flush Acid Injection Post-flush Pressure Drop Across Core Calcium Concentration Magnesium Concentration [Ca] 2+ and [Mg] 2+, mg/l Figure 26: Graph of pressure drop across the tested core compared to dissolved calcium and magnesium concentrations within collected effluent samples for the 25 F seawater experiment. 31
46 Seawater Run at 25 F: ph and Pressure Data Pressure Drop Across Core, PSI Pre-flush Acid Injection Post-flush Pressure Drop Across Core ph ph Figure 27: Graph of pressure drop across the tested core compared to the ph of the collected effluent samples for the 25 F seawater experiment. Seawater Run at 25 F: [Ca] 2+ and [SO 4 ] 2- [Ca] 2+, mg/l Calcium Concentration Sulfate Concentration Immediately After Collection Sulfate Concentration One Day After Collection [SO 4 ] 2-, mg/l Figure 28: Graph of sulfate concentration in effluent samples measured immediately after collection and one day after collection compared to dissolved calcium concentration within collected effluent samples for the 25 F seawater experiment. 32
47 3.2.4 Temperature = 325 F The DI water coreflood at 325 F increased the permeability within the core and caused breakthrough. The k f /k i ratio for this experiment was Repeating the experiment with less HCl was unnecessary since similar results were found with the seawater case. More stimulation is noted in this core than any other case with DI Water due to the increased temperature increasing acid reactivity of the HCl. Figure 29 shows the pressure drop across the core, Figure 3 shows the comparison of pressure drop across the core to calcium and magnesium concentrations within the collected effluent samples, and Figure 31 shows a comparison of ph from the collected effluent samples to pressure drop across the core. All these graphs show that the ending condition of the core was such that no further reactions would occur within the core after the experiment and breakthrough occurred during the experiment after a very small injection of acid (about 5 ml). 33
48 DI Water Run at 325 F: Test Run Pressure Drop Across Core, PSI Acid Injection Post-Flush Pre-Flush Figure 29: Graph of pressure drop across the tested core for the 325 F DI Water experiment. DI Water Run at 325 F: [Ca] 2+, [Mg] 2+, and Pressure Data Pressure Drop Across Core, PSI Pre-Flush Acid Injection Post-Flush Pressure Drop Across Core Calcium Concentration Magnesium Concentration [Ca] 2+ and [Mg] 2+, mg/l Figure 3: Graph of pressure drop across the tested core compared to dissolved calcium and magnesium concentrations within collected effluent samples for the 325 F DI Water experiment. 34
49 DI Water Run at 325 F: ph and Pressure Data Pressure Drop Across Core, PSI Pre-Flush Acid Injection Post-Flush Pressure Drop Across Core ph ph Figure 31: Graph of pressure drop across the tested core compared to the ph of the collected effluent samples for the 325 F DI Water experiment. At 35 F, the seawater coreflood case had stimulation effects that showed breakthrough conditions after about 5 ml of HCl was injected. A large stimulation effect was noted with the k f /k i ratio for this experiment being Figure 32 shows the pressure drop across the core, Figure 33 shows the comparison of pressure drop across the core to calcium and magnesium concentrations within the collected effluent samples, Figure 34 shows a comparison of ph from the collected effluent samples to pressure drop across the core, and Figure 35 shows a comparison of sulfate concentration in collected effluent samples immediately after collection and one day after collection against calcium concentration within collected effluent samples. All these graphs show that the ending condition of the core was such that no acid breakthrough occurred and no further reactions would occur within the core after the experiment. Figure 35 shows no 35
50 scale forming during the experiment, but additional scale forming after the experiment. The use of scale inhibitors at this temperature was determined to be unnecessary due to the quick breakthrough leading to under saturated conditions existing within the core during the experiment. 3 Seawater Run at 325 F: Test Run Pressure Drop Across Core, PSI Pre-flush Acid Injection Post-flush Figure 32: Graph of pressure drop across the tested core for the 325 F seawater experiment. 36
51 Seawater Run at 325 F: [Ca] 2+, [Mg] 2+, and Pressure Data 3 4 Pressure Drop Across Core, PSI Preflush Acid Injection Post-flush Pressure Drop Across Core Calcium Concentration Magnesium Concentration [Ca] 2+ and [Mg] 2+, mg/l Figure 33: Graph of pressure drop across the tested core compared to dissolved calcium and magnesium concentrations within collected effluent samples for the 325 F seawater experiment. Seawater Run at 325 F: ph and Pressure Data Pressure Drop Across Core, PSI Preflush Acid Injection Post-flush Pressure Drop Across Core ph ph Figure 34: Graph of pressure drop across the tested core compared to the ph of the collected effluent samples for the 325 F seawater experiment. 37
52 Seawater Run at 325 F: [Ca] 2+ and [SO 4 ] 2- [Ca] 2+, mg/l Calcium Concentration Sulfate Concentration Immediately After Collection Sulfate Concentration One Day After Collection [SO 4 ] 2-, mg/l Figure 35: Graph of sulfate concentration in effluent samples measured immediately after collection and one day after collection compared to the dissolved calcium concentration within collected effluent samples for the 325 F seawater experiment. 3.3 Discussion Calcium sulfate scale will damage dolomite formations acidized by HCl at temperatures up to 25 F. Table 4 summarizes the initial and final conditions of the experiments conducted without scale inhibitors and shows that all acidized cores saturated with seawater at 25 F and below experienced reductions in permeability throughout the experiment. The table shows a clear trend of seawater always having less of a stimulation effect than the DI Water counterparts, even above 25 F. At 325 F the acid reaction occurs so quickly that breakthrough can be achieved with a significantly lower volume of acid, which in turn would lower the concentration of free calcium and magnesium ions. The scale that did form during this experiment formed slower than the growth of the wormholes which allowed stimulation to occur even though scale did 38
53 form. For these reasons, it was determined that scale inhibitors will be needed for temperatures up to 25 F. Table 5 shows the amount of sulfate precipitated and the amount of calcium and magnesium dissolved in each experiment. During the repeat test at 15 F, it was observed that more damage occurred in the higher permeability core and more scale precipitated within the same core. This follows the observations of Moghadasi et al. (24). The total amount of sulfate which precipitated increased during the experiments as the temperature increased. This additional precipitation is caused by the solubility of calcium sulfate decreasing as temperature increases. Table 4: Table summarizing initial and final core conditions along with flow rate. Porosity (%) (cc) k-initial (md) k-final (md) kf/ki Flow Rate (cc/min) DI Water F 25F 15F 77F Seawater DI Water Seawater Seawater DI Water Seawater DI Water DI Water Seawater
54 Table 5: Table summarizing the amount of precipitated sulfate during each test and dissolved calcium and magnesium. 77F 15F 25F 325F Total Sulfate Injected, mg Total Sulfate Ejected, mg Total Sulfate After One Day, mg Sulfate Precipitated in Core, mg Addition Sulfate Precipitation After One Day, mg Total Sulfate Precipitated, mg Total Dissolved Calcium, mg Total Dissolved Magnesium, mg
55 4. MITIGATING DAMAGE DUE TO CALCIUM SULFATE SCALE 4.1 Introduction Scale inhibitors operate with two main modes of inhibition: nucleation inhibition and crystal growth inhibition. Nucleation inhibition is the process of preventing scales from creating crystal seeds. Crystal growth inhibition is the process of preventing scale crystals from increasing in in size. All scale inhibitors work using both types of inhibition mechanisms, though one mechanism is typically favored over the other 4. Polymer based scale inhibitors generally favor nucleation inhibition, and short chain scale inhibitors generally favor crystal growth inhibition. Nucleation inhibition is less well understood than crystal growth inhibition and is thought to work by bonding with accumulating scale forming ions and disrupting the ion cluster causing ions to disperse before they form scale on a solid surface; then the inhibitor is released when ion cluster breaks apart allowing the scale inhibitor to disrupt more clusters. Scale inhibitors can also benefit from the dispersion effect inherent in some scale inhibitors. Crystal growth inhibition works by the scale inhibitor adsorbing onto existing scale crystal structures and preventing further growth of the crystal and by adsorbing onto scale precipitates within the bulk solution to prevent the scale from depositing on the wall. Both types of scale inhibitors can be used in squeeze treatments where the scale inhibitor is injected into the reservoir and expected to prevent scale growth for the life of the scale inhibitor
56 DTPMP (Diethylene Triamine Penta (Methylene Phosphonic acid)) is a short chain phosphonate based scale inhibitor which acts like a chelating agent and favors crystal growth inhibition. It is one of the oldest phosphonate based scale inhibitors to be used in the oil field. This scale inhibitor performs well at high temperatures compared to other short chain based scale inhibitors and has long retention rates within the reservoir which make it suitable for squeeze treatments 15. The phosphonic acid group within the scale inhibitor is the active group and does not perform well in environments with ph values greater than BHMT (Bis(HexaMethylene Triamine penta (methylene phosphonic acid))) is another short chain phosphonate based scale inhibitor which acts like a chelating agent and favors crystal growth inhibition. This scale inhibitor performs well in high ph conditions, but does not perform well at high temperatures 17, unlike DTPMP. Increasing the Ca 2+ concentration will increase the inhibitor efficiency, but can lead to calcium phosphonate precipitation, especially in the presence of iron 18 Sulfonated polymer is a long chain polymer based scale inhibitor which prefers nucleation inhibition. It is known to work well at low temperatures and high supersaturation conditions 19, which is a problem for many phosphonate based scale inhibitors. These scale inhibitors can also be designed for applications above 35 F. Calcium, magnesium, and iron ions do not affect this type of scale inhibitor as much as they do for crystal growth inhibition type scale inhibitors 4. P-tagged sulfonated polymer is a long chain polymer based scale inhibitor which prefers nucleation inhibition. It is another type of sulfonated polymer with phosphorous 42
57 included in the molecular chain. The scale inhibitor behaves similarly to sulfonated polymer. PAA (PolyAcrylic Acid) is a scale inhibitor which favors crystal growth inhibition. It performs better as ph increases, due to increasing dissociation of the carboxylic groups at increasing ph values, increasing the affinity for PAA to absorb onto the scale crystal surface 2. PPCA (Phosphino-PolyCarboxylic Acid) is a short chain phosphonate based scale inhibitor which has a balance of crystal growth inhibition and nucleation inhibition mechanisms. The effect of divalent ions is less than that observed on DTPMP 19, 21. PPCA inhibition efficiency increases with increasing temperature and decreases at low temperatures, though it does not lose as much inhibition efficiency as DTPMP Results In an acidic environment (conditions created to simulate conditions where 15 wt% HCl reacts with dolomite and 1 wt% HCl remains) DTPMP and BHMT were effective at any concentration; and sulfonated polymer and P-tagged sulfonated polymer were effective at 15 ppm and 1, ppm. Polyacrylic acid and PPCA were not effective scale inhibitors at any inhibitor concentration. According to He et al (213) scale inhibitors will be least effective during the 1 wt% partially spent HCl condition during matrix acidizing. Table 6 shows the overall results from the static jar tests. 43
58 Table 6: Results of static jar tests. The cells highlighted in red indicate scale inhibitor failed the test at the specified concentration, and cells highlighted green indicate that the test passed at the specified conditions. Spent Acid/Scale Inhibitor (SI) System Good 5 ppm 15 ppm 5 ppm 1 ppm 1 ppm Bad SI RT 15F 21F RT 15F 21F RT 15F 21F RT 15F 21F RT 15F 21F PPCA Polyacrylic Acid Sulfonated Polymer DTPMP BHMT P-Tagged Sulfonated Polymer No SI LC ThP ThP N C P SC ThP ThP C ThP ThP C ThP N = Solution is ThP Clear SC P P SC ThP ThP SC ThP ThP C ThP ThP C P C C = Solution is Cloudy C ThP P N tp tp SC P tp C C/P P C N N SC = Severely Cloudy C tp tp LC LC tp N LC tp N N N N N N LC = Lightly Cloudy N LC tp LC LC tp N LC tp N LC tp N N N P = Precipitation C ThP ThP N N N SC P P C P P N N N LC C P Layer Formed ThP = Thick Precipitation Layer tp = Thin Precipitation Table 7 shows pictures taken of the synthetic spent acid environments for samples tested with 15 ppm scale inhibitor and no scale inhibitor. PPCA and polyacrylic acid showed signs of enhanced scale precipitation during static jar tests at 15 ppm. DTPMP, BHMT, and P-tagged sulfonated polymer work as sulfate scale inhibitors for acidizing dolomite under idealized conditions. The corefloods with scale inhibitors following the results of the static jars tests were conducted at 15 ppm of each passing scale inhibitor. 44


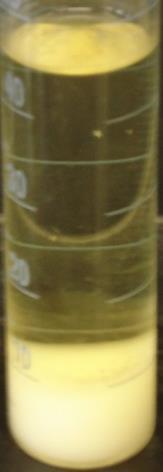
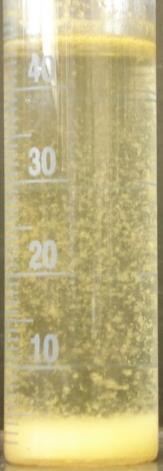
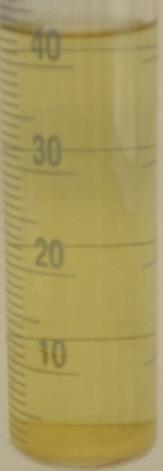
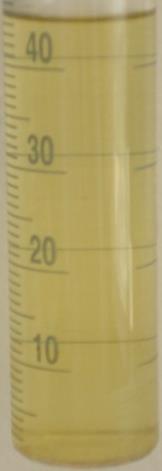

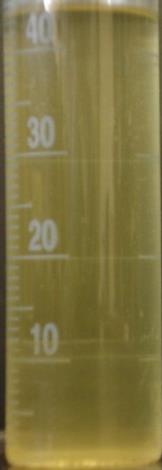
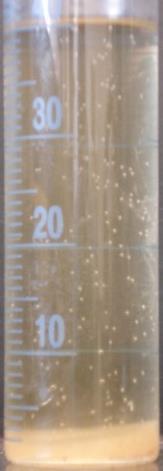


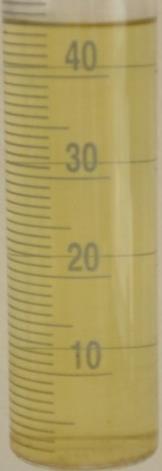

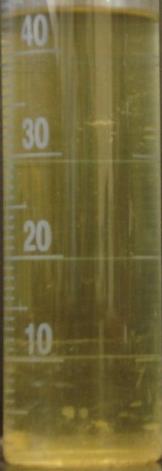
59 Table 7: Pictures of samples at the end of the static jar tests with 15 ppm of each scale inhibitor. 15 ppm of Scale Inhibitor Temperature No Scale Inhibitor PPCA Polyacrylic Acid Sulfonated Polymer DTPMP BHMT P-tagged sulfonated polymer 77 F 15 F Thin layer of scale 21 F Thin layer of scale 45