Riverside New Urbanism Project
|
|
|
- Shonda Strickland
- 5 years ago
- Views:
Transcription
1 Riverside New Urbanism Project Task 2.2 Neighborhood Traffic and Air Pollution Modeling Final Report By Ji Luo Kanok Boriboonsomsin College of Engineering - Center for Environmental Research and Technology (CE-CERT) University of California, Riverside Jun 2014
2 1 Introduction This study is a part of Riverside New Urbanism project for two neighborhoods Arlington and Ramona in the City of Riverside, California. The New Urbanism notion includes many facets that aim at making the traditional suburban area more walkable and sustainable 1. The two neighborhoods are among those oldest areas in Riverside, boasting some of the most historical buildings, businesses, schools, shopping centers, and transit lines. These advantages highlight the community as an excellent New Urbanism demonstration candidate. Center for Sustainable Suburban Development (CSSD) of UCR as a project leader has engaged in a number of neighborhood surveys, education outreaches, and community meetings to advocate walkability and healthy actively living lifestyle. Meanwhile, the College of Engineering - Center for Environmental Research and Technology (CE-CERT) has collaborated on traffic and air quality analysis component of this project. This report describes the use of various data sources and models to estimate primary PM2.5 (particulate matter smaller than 2.5 micron) concentration in the neighborhoods for calendar year Modeling Framework Modeling traffic-related air pollutant concentration is a process involving multiple modeling components. Figure 1 shows the multi-step modeling framework of this study. Traffic activity, in terms of traffic flow and speed, were obtained from the Riverside County s transportation model (RIVTAM) for the analysis area. Traffic emissions were estimated using EMFAC2007 and used as input for the CALINE4 dispersion model that predicted PM2.5 concentrations in the neighborhoods. Details of the modeling process are provided in the sections that follow. Traffic Model (RIVTAM) Emission Model (EMFAC2007) Traffic Network Traffic Activity Traffic Emissions Dispersion Model (CALINE4) Air Pollutant Concentration Figure 1 Modeling framework used in this study 1 Walkable Communities Aim of UC Riverside, Community Collaboration
3 1.2 Scope of Study Particulate matter or particles can be formed in different ways. Primary particles are emitted directly from a source, such as construction sites, unpaved roads, smokestacks, fires, and combustion engines. In contrast, secondary particles are formed in complicated reactions in the atmosphere of chemicals such as sulfur dioxides and nitrogen oxides that are emitted from power plants, industries, and automobiles. This study only deals with primary particles that are dispersed from vehicular traffic into the air nearby the roadways. Particles from vehicular traffic are emitted from multiple sources, including the combustion of fuel (especially diesel) and the wear and tear of tires and brake pads. This study only models particle emissions from the combustion of fuel (i.e., running exhaust particle emissions), which account for the majority of traffic-related particle emissions. 2 Traffic Activity Modeling Traffic data (flow and speed) were obtained from the Riverside County s RIVTAM model for the traffic network in the Arlington-Ramona neighborhoods for calendar years 2007 and The data were available for four time periods: morning (AM: 6-9 am), midday (MD: 9am-3pm), afternoon (PM: 3-7 pm) and nighttime (NT: 7pm-6am). Year 2014 traffic flow was linearly interpolated from years 2007 and 2035 data, and traffic speed was estimated using SCAG (Southern California Association of Governments) s formulas and parameters Traffic Flow Modeling Traffic flow for the target network was modeled for years 2007 and It included the following vehicle types: 1) DA: passenger car driving alone, 2) SR2: passenger car shared ride with 2 persons, 3) SR3: passenger car shared ride with 3 or more persons, 4) LHDT: light-heavy duty trucks, 5) MHDT: medium-heavy duty trucks, 6) HHDT: heavy-heavy duty trucks. The total flow is the summation of the six vehicle types, and the calendar year 2014 traffic flow was linearly interpolated from the 2007 and 2035 data for each link in the network. The results are shown in Figure 2 through Figure 5. 2 SCAG, Arterial Speed Study Final Report, April, 2005,

4 Figure Riverside Arlington-Ramona Neighborhood Morning Traffic Flow Map Figure Riverside Arlington-Ramona Neighborhood Midday Traffic Flow Map

5 Figure Riverside Arlington-Ramona Neighborhood Afternoon Traffic Flow Map Figure Riverside Arlington-Ramona Neighborhood Night Traffic Flow Map
6 2.2 Traffic Speed Estimation Year 2014 traffic speed was estimated following the procedure shown in Figure 5. The parameters and formulas are described in chapter 4 of a SCAG report 3. Road facility type Road posted speed limit Area type 2007 traffic flow 2035 traffic flow 2014 traffic flow Road free flow speed Road capacity Area type Road lane number 2014 traffic speed Figure 6 Flow chart of year 2014 traffic speed estimation Because each roadway link in the network carries two-way traffic, which may have different speeds, there are eight traffic speed maps for four time periods, which are given in Appendix A. 3 Emission Factors Modeling Emission factors that represent the vehicle fleet, speeds, and environmental conditions associated with a project are needed to perform air quality modeling. The EMFAC model developed by the California Air Resources Board is usually used to provide emission factors that are specific to California. Among several available EMFAC versions, the EMFAC web-based tool was used to estimate traffic emission factors for the study area. To characterize the 6 vehicle types (listed in Section 1.1) with more accuracy, Table 1 gives the corresponding EMFAC 2007 vehicle categories for South Coast Air Basin region in Riverside County of calendar year SCAG, Arterial Speed Study Final Report, April, 2005,

7 PM 2.5 emission factor (g/mile) Table 1 Riverside traffic vehicle types and corresponding EMFAC 2007 vehicle categories Regrouped Vehicle type Study Area Traffic Vehicle Type EMFAC 2007 Vehicle Category LDV DA, SR2, SR3 LDA, LDT1, LDT2, MDV LHDT LHDT LHDT1, LHDT2 MHDT MHDT MHDT HHDT HHDT HHDT After aggregating EMFAC 2007 vehicle categories into the regrouped vehicle type, the PM 2.5 emission factors for each vehicle type and traffic emission maps are display as follows Speed bin (mph) LDV LHDV MHDV HHDV Figure 7 PM 2.5 running exhaust emission factors for regrouping vehicle types. Figure Riverside Arlington-Ramona Neighborhood Morning Traffic Emission Factor Map

8 Figure Riverside Arlington-Ramona Neighborhood Midday Traffic Emission Factor Map Figure Riverside Arlington-Ramona Neighborhood Afternoon Traffic Emission Factor Map

9 Figure Riverside Arlington-Ramona Neighborhood Nighttime Traffic Emission Factor Map 4 Dispersion modeling When the traffic activity and emission factor estimation are prepared ready as inputs, dispersion model will be used to calculate the air pollutant concentration, as shown in Figure 1. The air pollutant dispersion modeling in this study was conducted using the CALINE4 model, developed in the late 1980's at Caltrans' Transportation Laboratory. CALINE4 is the standard modeling program used by Caltrans to assess carbon monoxide impacts near transportation facilities. It can also handle dispersion modeling of particulate matter (PM) and nitrogen dioxide (NO 2 ). 4 In this analysis, CALINE4 is downloaded from a public domain 5 and used to model traffic running exhaust PM 2.5 concentration for the Arlington-Ramona neighborhood. The input requirements are described as in Table 2. An example input file is listed in Appendix B. 4 Benson, P. E. CALINE4 A Dispersion Model for Predicting Air Pollutant Concentrations near Roadways. Report No. FHWA/CA/TL-84/15, California Department of Transportation, Sacramento, California, November

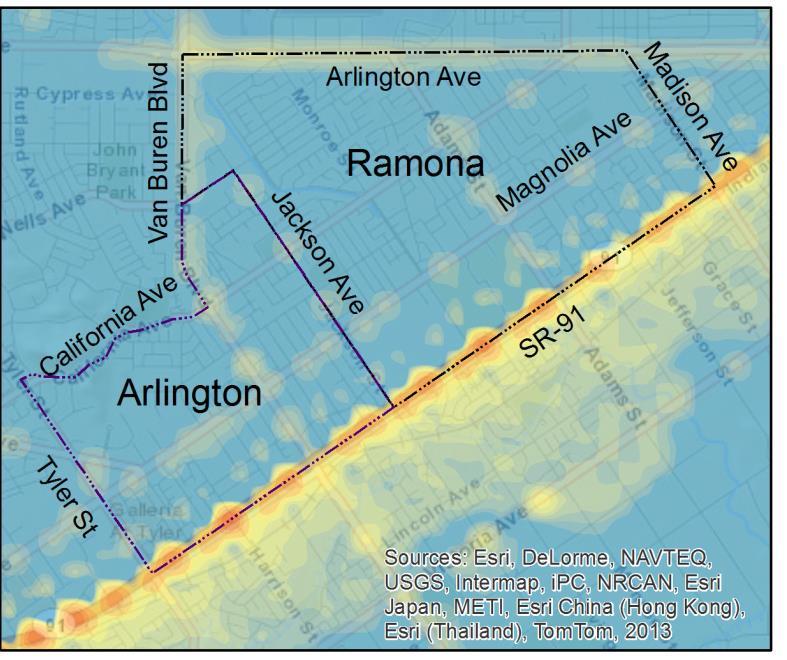
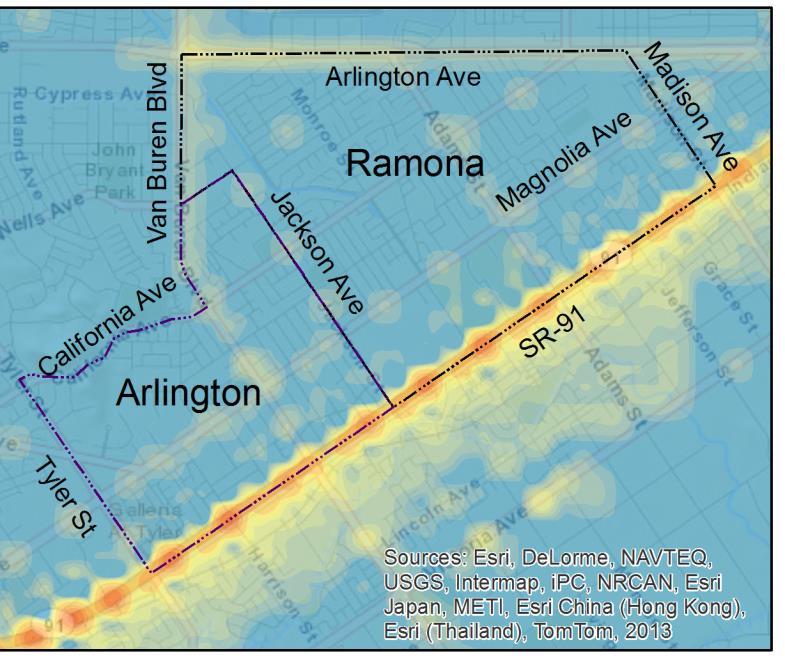
10 Table 2 CALINE4 input file components Part Description 1 Title 2 Name of pollutant 3 Scenario parameters: Surface roughness length, molecular weight, setting velocity, deposition velocity, number of receptors, number of links, distance unit, altitude above sea level 4 Receptor index and their Cartesian coordinates 5 Link index and link parameters: Link type, coordinates, link height, mixing zone width, canyon/bluff mix left, canyon/bluff mix right 6 Averaging time interval specification 7 Traffic flow for each input link 8 Traffic emission factor for each input link 9 Meteorology inputs: Wind direction, wind speed, stability class, mixing height, wind standard deviation, background concentration, air temperature 4.1 Weather Data Processing Wind speed, wind direction, and temperature are obtained from AQMD routine measurements. 6 The measurement site and target area are shown in Figure 12. Figure 12 AQMD Meteorology Measurement Site: Riverside Municipal Airport, and the Target Area: Arlington-Ramona Neighborhood (blue-dash-outlined area) 6 CARB, Meteorology Data Query Tool,
11 The weather data are all acquired from 2012 annual measurements, and the 365-day 24-hour matrixes are averaged into a 24-hour vector 7. Annual wind rose graph and temperature are presented as in Fig 8. And the wind rose graphs for the four time periods are shown in Fig 9. a. Temperature b. Humidity Wind Speed (1 m/s) c. Wind Rose Graph Figure 13 Year 2010 Riverside Arlington-Ramona Neighborhood Annual Meteorology Parameters 7 U.S EPA, Meteorological Monitoring Guidance for Regulatory Modeling Applications, Feb, 2000,
12 Figure 14 From Top-down and Left-right sequence: Morning, Midday, Afternoon, and Nighttime Wind Rose Graphs 4.2 CALINE4 Execution The network links nodes coordinates are extracted from the Arlington-Ramona neighborhood map in form of shapefile using ArcMap software. The 50-by-50-meter receptor grid is set up covering the entire target area. The CALINE4 program published by Caltrans is capable at processing 20 links and 20 receptors at one time. In this analysis CALINE4 batch command is applied to handle the 743 road links and receptors that cover the 7-km-by-4-km land. The batch processing program is coded in Matlab. It takes the entire network and receptor grid, breaks them into 20-link-20-receptor group, generates CALINE4 input files, batch run files, triggers the execution of input files, read all the output files and assemble them into the original receptor grid for visualization. The modeled morning, midday, afternoon, nighttime PM 2.5 concentration are mapped in the following figures.
13 To investigate into the wind direction variation impacts to the PM 2.5 concentrations, we vary the wind direction every 30 degree until reaching 360 degree, for each time period. Then all the receptors concentrations are calculated for each wind direction. The overall receptor grid concentration average which is the maximum in all the directions is selected as the worst case and the concentration map is followed for comparison for each time period. The user interface of the CALINE4 software provides a convenient way to enter and visualize input data, but is limited to only 20 links and 20 receptors at a time. It is thus suitable for smallscale modeling projects. In order to calculate 77,844 roadway links and 927,429 receptors in this study, an execution of the model in batch mode is necessary. In addition to the software with user interface, an executable file CALINE4.exe is also available. This file can read formatted input files and execute them in batch mode. To make use of the batch mode, a MATLAB script was created to perform the following tasks: 1. Select 20 neighboring roadway links and identify receptors within a 2,000-meter buffer. 2. Divide the identified receptors into groups of 20 and assign a unique index to each linkreceptor group. 3. Create input text files containing the links, receptors, meteorology data, traffic flow, traffic emission factor, and other required inputs (as listed in Error! Reference source not found.) as well as a corresponding batch run command file. An example of batch run command file is given in Appendix C. 4. Run the batch command to execute the input files for all the link-receptor groups. 5. Read the output files according to the link-receptor group index and extract the estimated PM2.5 concentration value at each receptor. 6. Update the PM2.5 concentration values for the effective receptors (within a 5,000-meter buffer) by adding the newly estimated concentration values to the existing values. 7. Repeat steps 1-6 for all the roadway links in the network.


14 wind direction Upper: Morning Average, WD: 45 Lower: Morning worst case, WD: 225 Figure Riverside Arlington-Ramona Neighborhood Morning PM 2.5 Concentration Map

15 Figure Riverside Arlington-Ramona Neighborhood Midday PM 2.5 Concentration Map


16 wind direction Upper: Afternoon Average, WD: 274 Lower: Afternoon worst case, WD: 64 Figure Riverside Arlington-Ramona Neighborhood Afternoon PM 2.5 Concentration Map


17 wind direction Upper: Nighttime Average, WD: 297 Lower: Nighttime worst case, WD: 147 Figure Riverside Arlington-Ramona Neighborhood Nighttime PM 2.5 Concentration Map To note, the wind direction is in degree in meteorology coordinate, whose x-axis is pointing towards south. The average and worst case in each time period comparison is illustrated in the figures above. In morning and nighttime, when the turbulence is low and pollutants are more likely to accumulate, the wind direction plays an important role in the neighborhood PM2.5 concentration- when wind is blowing towards the neighborhood, the average PM2.5 concentration in the neighborhood tends to be higher than scenarios where wind are moving away from the neighborhood.

18 However, in the midday and afternoon, when the atmospheric turbulence is high, PM2.5 disperses fairly quickly, and the pollutants are not stagnant in the neighborhood so that no matter wind flows into the neighborhood or not the average concentration is generally insignificant. Besides the four time periods, we also model the PM2.5 concentration in an annual hourly average time interval, in which the annual traffic and weather data are averaged into a one-hour scenario, and the PM2.5 concentration is displayed below. Figure Riverside Arlington-Ramona Neighborhood Hourly Average PM 2.5 Concentration Map 5. Conclusions The modeling suite yields good representation of the PM2.5 distribution in the Riverside Arlington-Ramona Neighborhood, revealing the following effects of traffic PM2.5 emission on PM2.5 concentration in the neighborhoods and future improvements. 1) The levels of fine particle pollution in 2014 for the Arlington and Ramona neighborhoods are estimated to be satisfactory according to the Air Quality Index (AQI) definition of the U.S. Environmental Protection Agency. The satisfactory AQI is partly due to favorable average wind directions that direct away from the neighborhoods.
19 2) In the neighborhood PM2.5 concentration is relatively higher in the morning period (6-9 a.m.) than other times of the day. 3) Roadways that contribute the most fine particle pollution to the neighborhoods are State Route 91, Arlington Ave and Van Buren Blvd. 4) The wind direction sensitive test estimates the worst scenarios in each time period. It shows that in the morning period under the worst wind direction the neighborhoods concentration are highest among all time periods but still within moderate AQI region. The worst cases could be helpful information in walkability design and community promotion. 5) Some of the important parameters, such as mixing zone width and atmospheric mixing height, are determined empirically. It would be beneficial to create lookup tables or curves to determine a specific value from a set of routinely measured weather data (such as wind speed, temperature, and solar radiation).

20 Appendix A: Traffic speed choropleth Figure 20 Modeled 2014 Riverside Arlington-Ramona Neighborhood Morning Traffic Speed Direction 1 Map Figure 21 Modeled 2014 Riverside Arlington-Ramona Neighborhood Midday Traffic Speed Direction 1 Map

21 Figure 22 Modeled 2014 Riverside Arlington-Ramona Neighborhood Afternoon Traffic Speed Direction 1 Map Figure 23 Modeled 2014 Riverside Arlington-Ramona Neighborhood Nighttime Traffic Speed Direction 1 Map
22 Figure 24 Modeled 2014 Riverside Arlington-Ramona Neighborhood Morning Traffic Speed Direction 2 Map Figure 25 Modeled 2014 Riverside Arlington-Ramona Neighborhood Midday Traffic Speed Direction 2 Map
23 Figure 26 Modeled 2014 Riverside Arlington-Ramona Neighborhood Afternoon Traffic Speed Direction 2 Map Figure 27 Modeled 2014 Riverside Arlington-Ramona Neighborhood Nighttime Traffic Speed Direction 2 Map
24 Appendix B: Example of CALINE4 Input File 2014RiversidePM 4Particulates R161 R162 R163 R164 R165 R166 R167 R168 R169 R170 R171 R172 R173 R174 R175 R176 R177 R178 R179 R Link1 Link2 Link3 Link4 Link5 Link6 Link7 Link8 Link9 Link10 Link11 Link12 Link13 Link14 Link15 Link16 Link17 Link18 Link19
25 Link Hour Note: This input file tells CALINE4_w32.exe to calculate receptor R161 to R180 concentration for assigned link.
26 Appendix C: Example of Batch Run Command File (Change Disk if needed) Caline4_w32.exe <L828R1.txt>oAM-L828R1.txt Caline4_w32.exe <L828R2.txt>oAM-L828R2.txt Caline4_w32.exe <L828R3.txt>oAM-L828R3.txt Caline4_w32.exe <L828R4.txt>oAM-L828R4.txt Caline4_w32.exe <L828R5.txt>oAM-L828R5.txt Caline4_w32.exe <L828R6.txt>oAM-L828R6.txt Caline4_w32.exe <L828R7.txt>oAM-L828R7.txt Caline4_w32.exe <L828R8.txt>oAM-L828R8.txt Caline4_w32.exe <L828R9.txt>oAM-L828R9.txt Caline4_w32.exe <L828R10.txt>oAM-L828R10.txt Caline4_w32.exe <L828R11.txt>oAM-L828R11.txt Caline4_w32.exe <L828R12.txt>oAM-L828R12.txt Caline4_w32.exe <L828R13.txt>oAM-L828R13.txt Caline4_w32.exe <L828R14.txt>oAM-L828R14.txt Caline4_w32.exe <L828R15.txt>oAM-L828R15.txt Caline4_w32.exe <L828R16.txt>oAM-L828R16.txt Caline4_w32.exe <L828R17.txt>oAM-L828R17.txt Caline4_w32.exe <L828R18.txt>oAM-L828R18.txt Caline4_w32.exe <L828R19.txt>oAM-L828R19.txt Caline4_w32.exe <L828R20.txt>oAM-L828R20.txt Caline4_w32.exe <L828R21.txt>oAM-L828R21.txt Note: This file will process the receptor groups R1 to R21 for Link 828 with CALINE4_w32.exe in one batch run.