PRESENTATION OF SMOLENSK REGION
|
|
|
- Alan Lang
- 5 years ago
- Views:
Transcription

1 PRESENTATION OF SMOLENSK REGION


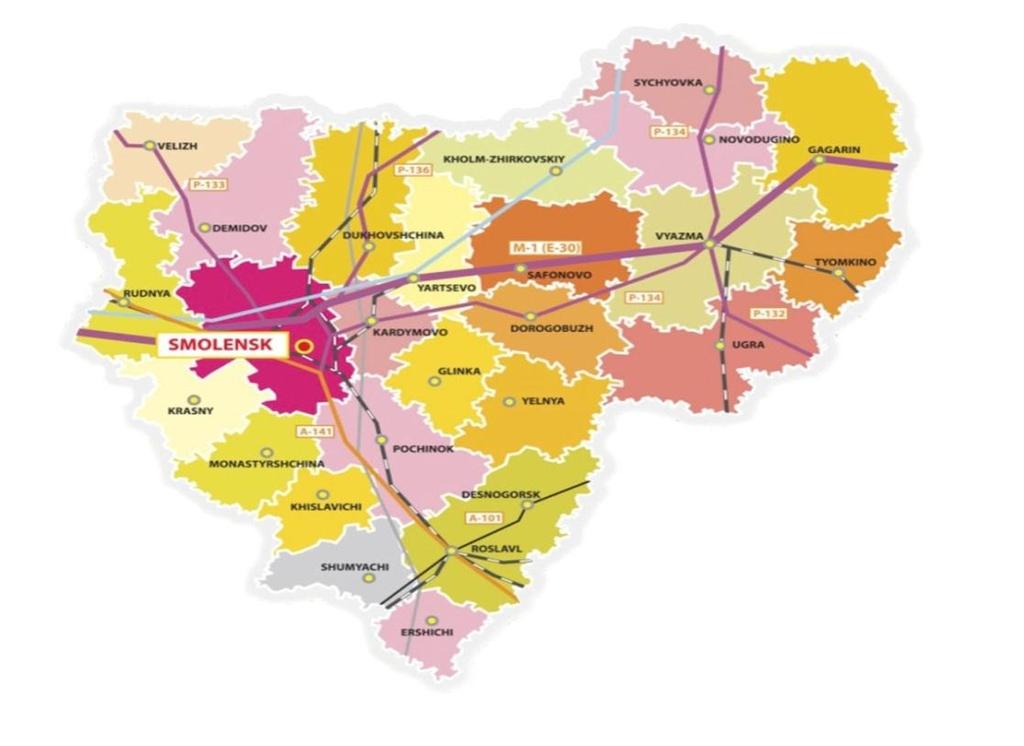
2 Geographical location The total area of the region: 49,8 thousand square kilometers The population size 975,2 thousand people 2

3 Transport infrastructure Federal highway М-1 «Belarus» Federal highway А-141 «Orel Rudnya» Federal highway А-101 «Moscow Bobruisk» Lateral transportation corridor «North - South» Perspective transportation corridor «The Golden Ring» Perspective fiber-optical communication link Moscow St. Petersburg Fiber- optical communication link Moscow Bryansk Smolensk Belarus Gas transmission pipeline «Yamal Europe» Baltic Pipeline System(BPS-II) 3


4 Power supply The Smolensk region produces excessive power. The power industry of the region is represented by such large enterprises as the Smolensk Nuclear Power Plant and the Smolensk Thermal Power Station, which is a partner of the German power-producing concern E.ON. The annual volume of electricity generated is 25 bln. kwh. 4
.")
5 Institutions for vocational training Basic vocational training: Number of institutions -18; number of trainees 3879 in 14 degree programs (94 professional majors). Intermediate vocational training: Number of institutions - 49; number of trainees in 21 degree programs (87 professional majors). Higher professional training: Number of institutions - 34; number of trainees in 20 degree programs (about 80 professional majors). 5

6 Gross Regional Product The volume of the Gross Regional Product of the Smolensk region contains 199,1 bln. rubles. bln. rubles 250,0 200,0 183,2 199,1 208,1 235,4 The growth rate of the Gross Regional Product: ,7% ,9% 2013(estimated) 99,0% 2014(predicted) 106,3% 150,0 100,0 50,0 0,


7 The Structure of the Gross Regional Product Manufacturing activities 22,90% 0,40% Trade Transport and communication 7,30% 10,70% 22,30% Production and distribution of electrical energy, gas and water Construction Agriculture, forestry, hunting Mining and quarrying 7,40% 9,30% 19,70% Others types of economic activities 7


8 The structure of industrial production 5,90% 6,20% 4,00% 9,50% 26,8% Production and distribution of electricity, gas and water Сhemical production Production of food, beverages and tobacco Production of electrical equipment Jewelry industry Production of vehicles and equipment 7,60% 5,50% 6,30% 8,80% 8,50% 10,60% Manufacture of basic metals and fabricated metal products Production of other non-metallic mineral products Manufacture of rubber and plastic products Processing of wood and of products of wood 8


9 The enterprises with foreign investment 9


10 The largest enterprises of the region JSC «DOROGOBUZH» - production of mineral fertilizers «KRISTALL» PRODUCTION CORPORATION - one of the largest diamond manufacturers in the world 10


11 Industrial production: machine-building complex Machine-building complex of the region integrates more than 200 enterprises employing more than 35 thousand people It includes: enterprises of power engineering industry enterprises of instrument-making industry and electrical engineering enterprises of transport machine building 11


12 Production of foods and beverages: 8 creamery plants 16 milk processing factories 3 milk canning plants 2 meat-packing plants 3 distilleries on breweries Industrial production: food industry 12


13 Development of wood processing and timber industry The total reserve of timber in state forestry fund 295 mln. square meters. The reserve of exploitable and overripe forests 57 mln. square meters. The amount of exploitable and overripe forests 4,6 mln. square meters annually. 13


14 Industrial production: wood processing industry LLC «EGGER DREVPRODUCT GAGARIN»- production of flakeboard and laminated plywood JSC «Igorevsky wood processing integrated plant» Investment into the construction of the facility for medium-density fiberboard production on the terms of private-public partnership funded by the Investment Fund of Russia. 14
 55,9 bln. rubles. 37,6 34,6 48,8 56,9 56,4 55,9 30,0 25,2 20,0 10,0 0,0 2007 2008 2009 2010 2011 2012 2013 15")
15 Dynamics of the investment into capital stock bln.rub 60,0 50,0 40,0 The volume of the investment into capital stock in 2012 was 56,4 bln. rubles, in 2013 (estimated) 55,9 bln. rubles. 37,6 34,6 48,8 56,9 56,4 55,9 30,0 25,2 20,0 10,0 0,

16 Dynamics of foreign investments 96% of the total amount of investments are into processing industry. The largest major countries-investors are Austria and Germany. mln.dollars 400,0 350,0 300,0 250,0 200,0 150,0 100,0 50,0 0,0 359,3 381,9 334,4 292,6 254,2 92,8 31,
17 State support of the investors Providing tax concessions, investment tax credits Information and administrative support of investors Provision of grants to organizations of industry Assistance in investment projects Provision of the investment land lots with transport, energetic and engineering infrastructure Forms of State support Providing subsidies to small and medium enterprises Participation of the authorities in the development, evaluation and implementation of investment projects 17
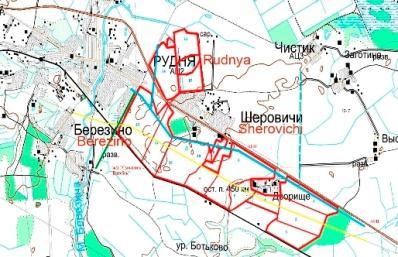
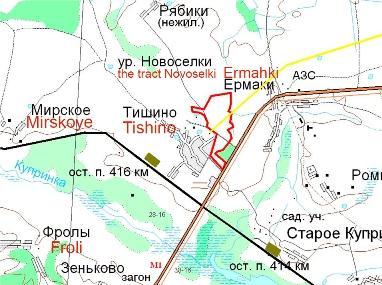
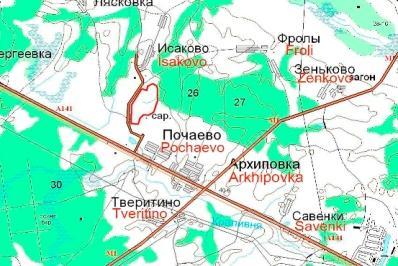
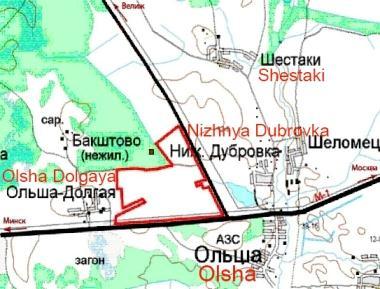
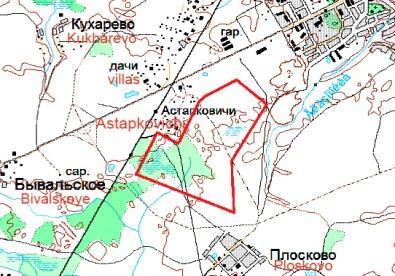
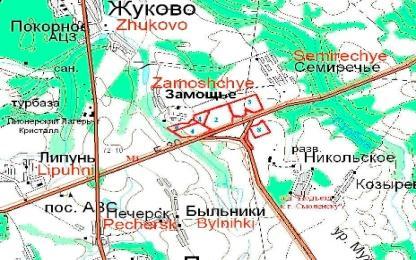
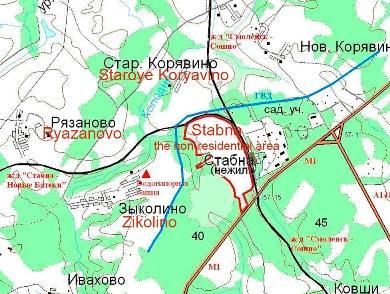
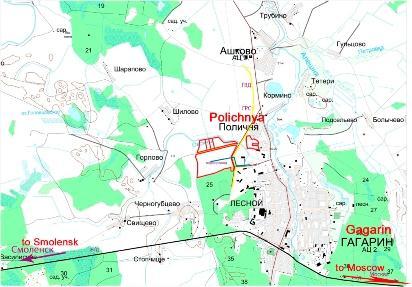
18 Priority investment sites 18
19