SCHOOL ENERGY EFFICIENCY
|
|
|
- Austin Stephens
- 5 years ago
- Views:
Transcription

1 SCHOOL ENERGY EFFICIENCY Andy Robinson, Training and Education, SEDAC West 40 Facility Meeting 11/9/2016


2 ILLINOIS ENERGY NOW 2

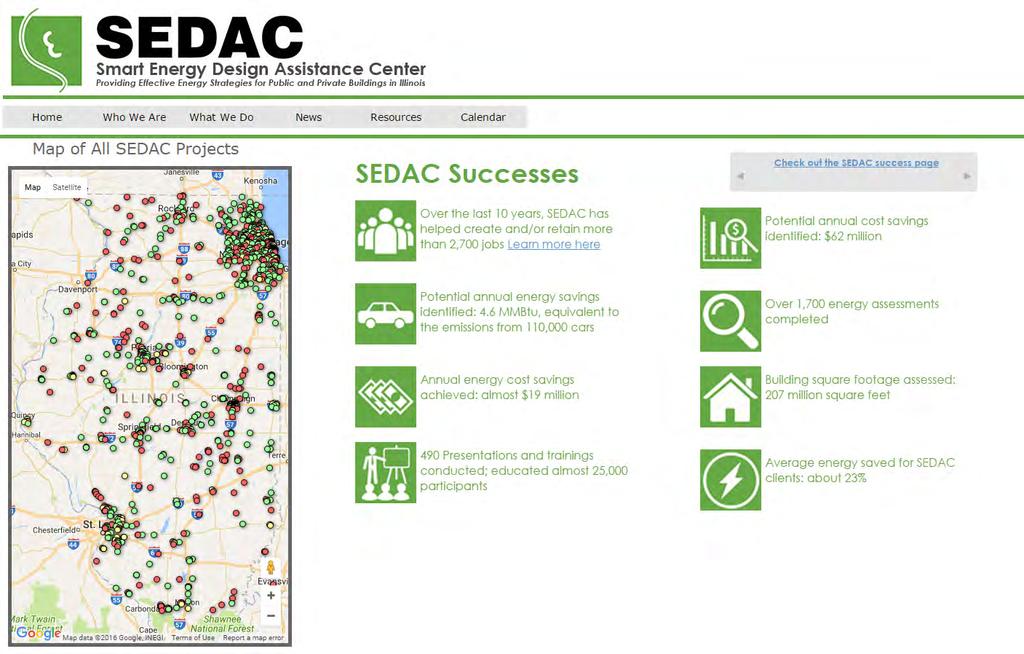
3 WHO WE ARE ILLINOIS ENERGY NOW s A Public/Private Partnership The Department of Commerce University of Illinois Staff, faculty, students 360 Energy Group Private sector energy specialists UIC Energy Resources Center Staff, students To help reduce the energy footprint of the State of Illinois 3


4 WHAT WE DO SEDAC Free Services Outreach and Training Energy Assistance and Assessments New Construction Design Assistance New Construction Incentives Energy Performance Contracting Support Retro-Commissioning Application Assistance
 Private Sector Businesses Residential Non-profits Public Sector Governments K-12 Schools Community Colleges Public Universities Low-Income Residential Affordable Housing PHAs")
5 ENERGY EFFICIENCY PORTFOLIO STANDARD ComEd Ameren Illinois Electric Efficiency (75% of $) DCEO Electric Efficiency Gas Efficiency (25% of $) Nicor Gas Peoples/North Shore Ameren Illinois Gas Efficiency (75% of $) Private Sector Businesses Residential Non-profits Public Sector Governments K-12 Schools Community Colleges Public Universities Low-Income Residential Affordable Housing PHAs Implementation Agencies Private Sector Businesses Residential Non-profits SEDAC 5
6 6


7 SEDAC GOALS FOR OUR CLIENTS: Save energy dollars Identify efficient equipment upgrades Identify incentives Reduce carbon footprints 8
8 EFFICIENCY IS WORKING Total US energy use has leveled off since 2000 Production is up, imports are down, exports are up.

 $88,812 26% $16 $/kw 165,094 therms $145,097 43% $0.")

9 EXAMPLE SITE AND BILLS Sep09-Aug10 Annual Consumption Annual Costs Average Unit Cost 2001 High School Standard construction Constant volume system Standard efficiency boilers Ran out of money on the energy budget Electric Energy Electric Demand Natural Gas 2,041,200 kwh $106,176 31% $0.05 $/kwh kw (min-max) $88,812 26% $16 $/kw 165,094 therms $145,097 43% $0.88 $/therm Total $340,085 Floor Area 117,000 sf Occupants 300 Students, 55 Staff Electricity Use Intensity 17.4 kwh/sf/yr Gas Use Intensity 1.41 therms/sf/yr Energy Use Intensity 201 kbtu/sf/yr Energy Cost Intensity $2.91 $/sf/yr Sept 07 - Aug 08 EUI Sept 08 - Aug 09 Sept 09 - Aug 10 Targe Finder KBTU/SF/YR
10 Electricity (kwh) BILL ANALYSIS 300, , , , ,000 50,000 On-Peak kwh Off-Peak kwh Cooling Degree Days SBHS: Monthly Electricity Usage 2008 had summer school Some anomalies in 2007 Fairly high spring and fall baseload 0 Feb-07 Apr-07 Jun-07 Aug-07 Oct-07 Dec-07 Feb-08 Apr-08 Jun-08 Aug-08 Oct-08 Dec-08 Feb-09 Apr-09 Jun-09 Aug-09 Oct-09 Dec-09 Feb-10 Apr-10 Jun-10 Aug-10 Oct-10 Dec-10 Feb-11 Apr-11 Jun-11 Aug-11 Oct-11 Dec-11 Feb-12 Apr-12 Jun-12 Aug-12 Oct-12 Dec-12 25,000 Therms Heating Deg Days SBHS: Monthly Gas Usage 20,000 15,000 10,000 5,000 0 Feb-07 Apr-07 Jun-07 Aug-07 Oct-07 Dec-07 Feb-08 Apr-08 Jun-08 Aug-08 Oct-08 Dec-08 Feb-09 Apr-09 Jun-09 Aug-09 Oct-09 Dec-09 Feb-10 Apr-10 Jun-10 Aug-10 Oct-10 Dec-10 Feb-11 Apr-11 Jun-11 Aug-11 Oct-11 Dec-11 Feb-12 Apr-12 Jun-12 Aug-12 Oct-12 Gas Use (therms) HDD line is a relative indicator of gas use Notice pretty good seasonal dependency
11 Electricity (kwh) BILL ANALYSIS 300,000 On-Peak kwh Off-Peak kwh Cooling Degree Days 250, , , ,000 50,000 SBHS: Monthly Electricity Usage Then, things went crazy. 0 Feb-07 Apr-07 Jun-07 Aug-07 Oct-07 Dec-07 Feb-08 Apr-08 Jun-08 Aug-08 Oct-08 Dec-08 Feb-09 Apr-09 Jun-09 Aug-09 Oct-09 Dec-09 Feb-10 Apr-10 Jun-10 Aug-10 Oct-10 Dec-10 Feb-11 Apr-11 Jun-11 Aug-11 Oct-11 Dec-11 Feb-12 Apr-12 Jun-12 Aug-12 Oct-12 Dec-12 25,000 Therms Heating Deg Days SBHS: Monthly Gas Usage 20,000 15,000 10,000 5,000 0 Feb-07 Apr-07 Jun-07 Aug-07 Oct-07 Dec-07 Feb-08 Apr-08 Jun-08 Aug-08 Oct-08 Dec-08 Feb-09 Apr-09 Jun-09 Aug-09 Oct-09 Dec-09 Feb-10 Apr-10 Jun-10 Aug-10 Oct-10 Dec-10 Feb-11 Apr-11 Jun-11 Aug-11 Oct-11 Dec-11 Feb-12 Apr-12 Jun-12 Aug-12 Oct-12 Gas Use (therms)
12 BILL ANALYSIS SBHS: Monthly Electricity Usage 300,000 On-Peak kwh Off-Peak kwh Cooling Degree Days Now it is fixed. 250, , , ,000 50,000 0 Feb-07 Apr-07 Jun-07 Aug-07 Oct-07 Dec-07 Feb-08 Apr-08 Jun-08 Aug-08 Oct-08 Dec-08 Feb-09 Apr-09 Jun-09 Aug-09 Oct-09 Dec-09 Feb-10 Apr-10 Jun-10 Aug-10 Oct-10 Dec-10 Feb-11 Apr-11 Jun-11 Aug-11 Oct-11 Dec-11 Feb-12 Apr-12 Jun-12 Aug-12 Electricity (kwh) Oct-12 Dec-12 25,000 20,000 Therms SBHS: Monthly Gas Usage Heating Deg Days 15,000 10,000 5,000 0 Feb-07 Apr-07 Jun-07 Aug-07 Oct-07 Dec-07 Feb-08 Apr-08 Jun-08 Aug-08 Oct-08 Dec-08 Feb-09 Apr-09 Jun-09 Aug-09 Oct-09 Dec-09 Feb-10 Apr-10 Jun-10 Aug-10 Oct-10 Dec-10 Feb-11 Apr-11 Jun-11 Aug-11 Oct-11 Dec-11 Feb-12 Apr-12 Jun-12 Aug-12 Oct-12 Gas Use (therms)
13 BILL BENCHMARKING SEDAC Illinois K-12 School Energy Use Intensities Electric kbtu/sf Gas kbtu/sf Bad Year '09-'10 Fixed '10-'11 Original '08-' kbtu/sf-yr MS 1 - MS 2 - Elem 3 - HS 4 - Elem 5 - Elem 6 - MS 7 - HS 8 - K Elem 10 - HS 11 - HS 12 - Elem 13 - Elem 14 - HS 15 - Elem 16 - Elem 17 - HS 18 - HS 19 - Elem 20 - Elem 21 - Elem 22 - HS 23 - K Elem 25 - Elem 26 - Elem 27 - MS 28 - MS 29 - HS 30 - Elem 31 - Elem 32 - Elem 33 - MS 34 - Elem 35 - HS 36 - Elem 37 - Elem 38 - Pre-K 39 - Elem 40 - Elem 41 - MS 42 - HS 44 - Elem 43 - HS 45 - Elem 46 - Elem 47 - HS 14


14 ENERGY COST BREAKDOWN Cooling $29,906 17% Kitchen $3,717 2% Water Heating $5,380 3% Fans and Pumps $15,300 9% Lights $32,307 18% Plug Loads $13,338 8% Heating $75,707 45% Envelope $22,698 13% Reheat $24,396 15% Ventilation $28,612 17% Of the 45% spent for heating, about one third is for building envelope losses Lights use more than cooling and have great potential for savings Based on a typical good year In problem year, HVAC is double.

15 KEEP IT SIMPLE: LIBRARY HVAC 16
16 UTILITY DATA kwh 60,000 50,000 40,000 30,000 20,000 kwh CDD CDD 10,000 Actual monthly utility 0 consumption data More is better than less Multiple years can illustrate anomalies Changes in consumption other than weather related may be highlighted Watch out for (and note) estimated consumption (vs. actual meter reading) Preparation for site visit Jan-10 Mar-10 May-10 Jul-10 Sep-10 Nov-10 Jan-11 Mar-11 May-11 Jul-11 Sep-11 Nov-11
17 TYPICAL DATA ANALYSIS A SCHOOL We know A school No summer school Heated Cooled Comfortable kwh 400, , , , , , ,000 50,000 0 Nov-10 Dec-10 Jan-11 Feb-11 Mar-11 Apr-11 May-11 Jun-11 Jul-11 Aug-11 kwh (3,753,262) CDD (1,237) Sep-11 Oct Degree Days
18 Is the baseline electric use ~225,000 kwh? kwh 500, , , , , , , , ,000 50,000 0 Nov-10 Dec-10 Jan-11 Feb-11 kwh (3,753,262) CDD (1,237) REMEMBER When you shift a secondary axis you are changing the story you tell. Mar-11 Apr-11 May-11 Jun-11 Jul-11 Aug-11 Sep-11 Oct Degree Days
19 OR is the baseline electric use closer to ~275,000 kwh? kwh April is a reasonable guess for baseline monthly usage 500, , , , , , , , ,000 50,000 0 High electric use in air conditioned schools - late spring/ early fall is not unusual as students return to classes and cooling demand can be high. Nov-10 Dec-10 Jan-11 Feb-11 Mar-11 kwh (3,753,262) CDD (1,237) REMEMBER The graph tells only part of the story! A school with minimal summer occupancy Apr-11 May-11 Jun-11 Jul-11 Aug-11 Sep-11 Oct Degree Days
20 Correlation with heating degree days likely means electric resistance heating somewhere in the building (i.e. teachers bringing in small space heaters) kwh 500, , , , , , , , ,000 50,000 0 Nov-10 Dec-10 Jan-11 Feb-11 kwh (3,753,262) HDD REMEMBER Remember to look for the unexpected! Mar-11 Apr-11 May-11 Jun-11 Jul-11 Aug-11 Sep-11 Oct-11 2,000 1,000 0 Degree Days

21 Consider whether or not it is likely the baseline (base utility) natural gas use is ~2,500 Therms/month? Base Load is typically DHW, pilot lights, etc. 6,000 2,000 5,000 1,500 Monthly Therms 4,000 3,000 1, Heatng Degree Days 2,000 1,000 0 Jun-10 Jul-10 Aug-10 Sep-10 Oct-10 Nov-10 Dec-10 Jan-11 Feb-11 Mar-11 Apr-11 May-11 Nat'l Gas Usage (Therms) REMEMBER When you shift a secondary axis you are changing the story you tell. HDD
22 Or is it more likely that high natural gas use in summer indicates excessive use of ventilation system reheat and the baseline (base utility) use is closer to 300 Therms/month. 6,000 1,500 5,000 1,300 Monthly Therms 4,000 3,000 1, Heatng Degree Days 2, , Jun-10 Jul-10 Aug-10 Sep-10 Oct-10 Nov-10 Dec-10 Jan-11 Feb-11 Mar-11 Apr-11 May-11 Nat'l Gas Usage (Therms) REMEMBER When you shift a secondary axis you are changing the story you tell. HDD
23 Election Day, school is closed. But some portions are open for polling. 160 November Monday November 1, Tuesday November 2, :00 AM to 12:30 AM 1:00 AM to 1:30 AM 2:00 AM to 2:30 AM 3:00 AM to 3:30 AM 4:00 AM to 4:30 AM 5:00 AM to 5:30 AM 6:00 AM to 6:30 AM 7:00 AM to 7:30 AM 8:00 AM to 8:30 AM 9:00 AM to 9:30 AM 10:00 AM to 10:30 AM Figure 1: 1/2-Hour Interval Metered Electric Energy Demand November :00 AM to 11:30 AM 12:00 PM to 12:30 PM 1:00 PM to 1:30 PM 2:00 PM to 2:30 PM 3:00 PM to 3:30 PM 4:00 PM to 4:30 PM 5:00 PM to 5:30 PM 6:00 PM to 6:30 PM 7:00 PM to 7:30 PM 8:00 PM to 8:30 PM Don t forget the power of interval data analysis when available! 9:00 PM to 9:30 PM 10:00 PM to 10:30 PM 11: 00 PM to 11:30 PM
24 HOURLY ENERGY USE All Lights On January 2011 Cleaning Done - Lights Off Electricity Use (kw) Staff Arrives Turns On ½ Lights Fans and Pumps 12:00 12:30 1:00 AM 1:30 AM 2:00 AM 2:30 AM 3:00 AM 3:30 AM 4:00 AM 4:30 AM 5:00 AM 5:30 AM 6:00 AM 6:30 AM 7:00 AM 7:30 AM 8:00 AM 8:30 AM 9:00 AM 9:30 AM 10:00 10:30 11:00 11:30 12:00 12:30 1:00 PM 1:30 PM 2:00 PM 2:30 PM 3:00 PM 3:30 PM 4:00 PM 4:30 PM 5:00 PM 5:30 PM 6:00 PM 6:30 PM 7:00 PM 7:30 PM 8:00 PM 8:30 PM 9:00 PM 9:30 PM 10:00 10:30 11:00 11:30
25 CHANGING THE SCHEDULE kw Red: Spring Break 2011 (March 28-April 02) 5am - 5pm Reduced Schedule Fri, Mar 25, 2011 Sat, Mar 26, 2011 Sun, Mar 27, 2011 Mon, Mar 28, 2011 Tue, Mar 29, 2011 Wed, Mar 30, 2011 Thu, Mar 31, 2011 Fri, Apr 01, 2011 Sat, Apr 02, 2011 Sun, Apr 03, 2011 Mon, Apr 04, 2011 Tue, Apr 05, :00 3:00 6:00 9:00 12:00 15:00 18:00 21:00 0:00 Spring break was used as a test Morning start was changed from 5am to 6am Evening shutdown was changed from 10pm to 5pm This saved $250/wk (or $13,000 per year) in fan electricity alone
26 COMMISSIONING A quality assurance process Occurs between early design phase through occupancy Ensures that the building operates as intended Building staff are prepared to operate and maintain Why is it needed? Increasing complexity of building control systems Lack of contractual coordination between trades Technical staff in the field who looks out for the owner Construction Manager Plumbing Mechanical Engineer Architect Electrical Engineer General Contractor Controls Engineer
27 ONGOING COMMISSIONING Requires a full-time energy watchdog Nights, weekends, holidays You can t turn things off when you aren t around Someone to put eyes on all the dampers, valves, VFDs, boilers, chillers, and plug loads Potential for 10-25% savings 31
28 RETRO-COMMISSIONING 32
29 TYPICAL FINDINGS FROM RCX Missing or broken equipment/components Incorrect thermostat settings and control sequences Incorrect or missing BAS schedules for fans, pumps, lights, and other key components Malfunctioning control sensors such as outside air temperature sensors, supply air temperature sensors, damper position, etc. Heating and cooling systems fighting each other (excessive reheat).
30 AHU 2 and associated VAV box 201 VAV Damper Reheat Coil Supply Fan Outside Air Damper 12:00:00 AM 1:10:00 AM 2:20:00 AM 3:30:00 AM 4:40:00 AM 5:50:00 AM 7:00:00 AM 8:10:00 AM 9:20:00 AM 10:30:00 AM 11:40:00 AM 12:50:00 PM 2:00:00 PM 3:10:00 PM 4:20:00 PM 5:30:00 PM 6:40:00 PM 7:50:00 PM 9:00:00 PM 10:10:00 PM 11:20:00 PM 12:30:00 AM 1:40:00 AM 2:50:00 AM 4:00:00 AM 5:10:00 AM 6:20:00 AM 7:30:00 AM 8:40:00 AM 9:50:00 AM 11:00:00 AM 12:10:00 PM 1:20:00 PM 2:30:00 PM 3:40:00 PM 4:50:00 PM 6:00:00 PM 7:10:00 PM 8:20:00 PM 9:30:00 PM 10:40:00 PM 11:50:00 PM 12/9/ /10/2011 System fans do not throttle down at night Outdoor air % stays high 40% VAV boxes stay open Night setpoints are the same as the day setpoints Reheat runs excessively through the night
 Heating, Ventilating, & Air Conditioning 3. Ventilation (reduction, heat recovery) 4.")

31 TOP TEN ENERGY STRATEGIES Loads 1. Lighting 2. Plug Loads (computers, heaters) Heating, Ventilating, & Air Conditioning 3. Ventilation (reduction, heat recovery) 4. Heating, Cooling (condensing boilers) 5. Motors & Pumps (VFDs, turn off) 6. Building Automation 7. Commissioning EXTRA CREDIT: After implementing all of these, consider renewables such as solar and wind. Building Envelope 8. Air Sealing 9. Insulation (roof deck, walls unlikely) 10. Windows (likely very expensive)


32 EXTRA CREDIT Renewables: Plan the infrastructure now for future Select site-appropriate technologies Use to take last step to net-zero Consider a Power Purchase Agreement 36

33 ELEMENTARY SCHOOL A What they did Replaced existing boiler and chiller New windows Retrofit lighting Occupancy sensors Air sealing Elementary School Building Type Energy Measures K-5 School HVAC, lighting, windows, occ sensors, controls Annual Energy Savings $16,933 Total DCEO Incentives $29,800 Total Project Cost $138,801 Payback 6.4 years


34 WALL TO ROOF JUNCTION AIR SEALING PRE-RETROFIT POST AIR SEALING From SEDAC report After Air Sealing


35 EXAMPLE: ENVELOPE PROBLEMS Occupants were cold No continuous insulation Don t underestimate the impact of thermal bridging This is not easy to change once the building is occupied

36 ELEMENTARY SCHOOL B What they did New Geothermal New windows Retrofit lighting Occupancy sensors Air sealing (not completed yet) Elementary School Building Type K-5 School Why high payback was acceptable. Previously heated with boiler and unit ventilators Boiler needed to be replaced They added air conditioning Windows at end of life Energy Measures Total Project Cost $618,501 Total DCEO Incentives $35,393 Final Project Cost $583,108 Annual Energy Savings $19,587 Payback HVAC, lighting, windows, occ sensors, controls 29 years

37 BOILERS - LARGE This 1960 steam unit has a new burner with an O2 sensor and separate gas and air controls to optimize burner efficiency. +2% Options: Boiler Tune Up New Boilers High Impact Incentives 41
38 HIGH IMPACT NATURAL GAS EFFICIENCY HINGE Bonus Projects shall include the following functions: Projects may be an accumulation of energy saving measures all located within the same building but does not include facility wide improvements. Incentive and Allowable Percentage Adjustments: Projects that achieve savings of over 50,000 therms and less than 100,000 therms per year of natural gas savings will qualify for $3.50 per therm saved and up to 90 percent of Total Project Cost. Projects that achieve savings of over 100,000 therms per year of natural gas savings will qualify for $4.50 per therm saved and up to 90 percent of Total Project Cost. Projects must be a custom incentive and not currently listed as a standard incentive in the base Department of Commerce Standard and Custom Incentive Program. 42

39 HYBRID BOILER ECRM 4: Add a Condensing Boiler Supplement the two original boilers with a high efficiency modular condensing unit. This will run at peak efficiency during most of the low-load heating hours. ECRM 4 Annual Savings kwh kw therms Energy % $ Estimated Cost Add a Condensing Boiler ,632 9% $18,133 $50,000 Gas for heating $75,000/yr Full engineering analysis is necessary. Isolate the two old boilers with valves. AKA: Shoulder Boiler or Front-Loaded Boiler Full upgrade is always an option if funds allow.


40 LIGHTING Lighting power usage Reduce ASHRAE numbers <0.9 W/sf Occupancy & vacancy sensors Manual On / Auto OFF (after less than 30 minutes) Multi-level switching or dimming Daylighting controls Solar tubes Outdoor lighting Reduce by 50% after closing Turn off 30 minutes after sunrise

41 MULTI-LEVEL SWITCHING


42 EXTERIOR LED LED Parking lot fixtures mainly save energy by having better directionality. Savings of 50-60% are typical. There is also potential for motion sensors, photo cells, and dimming.


43 APPLYING FOR SMART ENERGY DESIGN ASSISTANCE SERVICES Apply to SEDAC today!
44 FINANCING AND INCENTIVES Financing projects Energy Performance Contracting ILLINOIS ENERGY NOW Incentive Application support Assistance with other Grant and Rebate Applications 48
45 STANDARD/CUSTOM INCENTIVE PROGRAMS PUBLIC SECTOR Standard Custom Efficient Lighting Boilers, Chillers, Furnaces, Air Conditioners HVAC Equipment Tune-Up Variable Speed Drives Programmable Thermostats $/Item installed Any other project that will save energy If there is a standard incentive and you think your situation is saves more energy than normal inquire about a custom incentive $/kwh saved and $/therm saved The objective is to help pay down the cost of using high performance equipment. NOT to pay for it entirely! 49
46 OTHER INCENTIVE OPPORTUNITIES Non-EEPs Incentives IMEA for municipalities and coops Illinois Clean Energy Community Foundation (ICECF) programs for gov t buildings, non-profit community centers, and non-eeps. Lighting, innovative energy, green buildings, design and commissioning, and more! Illinois State Board of Education (ISBE) Illinois School Board Association Energy Efficiency Grants will they be back? Illinois Association of County Board Members (IACBM) free application assistance to Public Sector Metropolitan Mayors Caucus (MMC) direct incentives and help with purchasing for local governments in the Chicago-area and collar counties Performance Contracting assistance with RFPs and contracting DSIREUSA.org website listing all known energy programs by state 50
47 FINANCING SOURCES Banks for some municipalities and counties Revolving and specialized funds available through some RPCs/EDCs, internal in some large orgs, specialized programs ie US EPA, USDA RD, IFF, Bonds available for projects larger than ~$1M 3rd party EPC, ESCO, PPA, Equipment leasing The 3rd party absorbs performance risk and arranges financing Stay tuned: lots of interest and development across US, for more universally available public sector EE finance Sources of risk: Technical performance, Financial solvency (all parties involved), M&V, Changes in operating conditions 51
48 SCENARIO building: 50,000 sf repayment term: 5-yr & 10-yr at 6% APR Baseline condition: $1.50/sf/year energy costs Improved condition: $1.25/sf/year energy costs Soft costs: 10% of installed project value Incentives: $0.12/kWh & $2.50/therm Incentive calculation assumptions: Savings distribution, 2/3 electric & 1/3 gas Unit energy costs, $0.08/kWh & $0.70/therm 52
49 50,000 SF; 5-YEAR SCENARIO $1.50/sf/year baseline $75,000/year energy costs $0.25/sf/year savings $12,500/year savings (104,000 kwh/year & 6,000 therm/year savings) $62,500 installed cost (5.0 year SPB); 20% down payment One-time transactions in the implementation year Recurrent annual cash flow Item Cost/Incentive Item Cash flow Down payment ($12,500) Loan payment ($11,600) Misc. soft costs ($6,250) Energy savings $12,500 Incentive $27,000 Misc. Op. savings Total $8,250 Total $900 SEDAC Paying for Energy Efficiency with Financing: Implement More and Improve Operations Todd Rusk 53

50 ENERGY PERFORMANCE CONTRACTING EPC agreements are typically years in length, are adaptable to site specific needs and are best suited for facilities that have the following characteristics: Annual utility cost in excess of $100,000 Stable use of the facility for the next ten years Limited availability of funds for energy related capital improvements Have accomplished minimal energy efficiency upgrades over the past five years 54
 842-9106 davebirr@aol.")
51 ENERGY PERFORMANCE CONTRACTING Dave Birr ILLINOIS ENERGY NOW: EPC (847)


52 EASTERN ILLINOIS UNIVERSITY EXAMPLE Large-scale improvements Chiller and cooling tower upgrades Adding buildings to the campus chilled water loop Retro-commissioning New Renewable Energy Center Decommissioning the old coal plant Small-scale improvements replacing incandescent light bulbs with fluorescents and replacing toilets, faucet aerators, showerheads, and washing machines with water-conserving fixtures 56
53 EPC EXAMPLE Eastern IL Univ. Phase 2 $10,800,000 Energy cost savings $1,888,911 Operational cost savings $ 31,398 Electricity savings 4,934,513 kwh Gas savings 504,540 therms Coal savings 127,467 mmbtu Water savings 66,221,444 gallons Avoided Emissions CO2 SO2 Nox 41,506,257 lbs. 150,950 lbs. 52,407 lbs. 57


54 EIU RENEWABLE ENERGY CENTER $80m project to replace the rapidly failing 1928 coal-burning plant New combined woodchip, natural gas, and solar plant Two-stage high temperature gasification Back pressure turbine for electricity generation Expected to reduce CO2 by 80% First LEED Platinum power plant in country 58


55 MORE ILLINOIS ENERGY NOW SPECIAL PROGRAMS Energy Efficiency Aggregation Program Application Assistance Savings Through Efficient Products (STEP) Natural Gas Boiler System Program Combined Heat and Power Energy Performance Contracting Low Income Incentive Programs/PHA Lights for Learning Waste Water Treatment Facilities Trade Ally Program And more! 59

56 NEW CONSTRUCTION 60


57 NEW CONSTRUCTION PROGRAMS Two approaches: New Construction Design Assistance (NCDA) Work with owner and design team to develop and meeting energy efficiency goals Set goals Develop strategies Identify incentives Open to public buildings Incentive Review (NCIR) Provide review of incentive applications for ILLINOIS ENERGY NOW Review claimed energy savings Recommend funding levels. 61

58 NEW CONSTRUCTION INCENTIVE ELIGIBILITY Large Small 62
59 NEW CONSTRUCTION INCENTIVES 1. Timeline Submit Pre-application at 100% CD SEDAC reviews project Submit Final-application at project completion (occupancy) PY9: Project completion between May 31, 2016 June 1, 2017 Submit Application and all documentation prior to April 1, Funding Limits Incentives cannot exceed 100% of incremental measure cost and 75% of total cost If additional incentives are provided from other public sources, DCEO incentives combined with other incentives may not exceed 100% of cost Maximum grant award of $3/sf including high performance design bonus Contact: Simi Han SEDAC Maximum incentive of $300,000 per single location Based on 3. Prescriptive and Custom ASHRAE Prescriptive has individual measures from a list (menu) IECC 2015 Custom requires a building energy model Projects can include some prescriptive and some custom measures 63
60 NC INCENTIVES Prescriptive Lighting $0.30 / sf for each 0.10 W / sf beyond Roof $0.08 / sf / improved R-value Walls $0.10 / sf / improved R-value HVAC based on equipment efficiency Water heaters $500 / unit Kitchen Equip Varies based on equipment Contact: Simi Han SEDAC sumihan@illinois.edu Custom (requires building model or energy calculations) $0.08 / kwh and $2 / therm incentives Based on ASHRAE IECC 2015 High Performance Design Bonus (requires whole building energy model) 5%-30% beyond code $0.40-$1.40 / sf 64

61 CASE STUDY NEW CONSTRUCTION DESIGN ASSISTANCE Recreation Center Recommended Strategies beyond code: Install demand control ventilation throughout facility Increase efficiency of mechanical systems Utilize higher performance glazing Add air sealing to building specifications Further reduce lighting power density Recommended Strategies to add: Building Automation System Full building commissioning Bi-level switching in stairs 51% Energy Cost Savings (vs. ASHRAE ) Estimate of $64,000 in DCEO incentives! 65

62 CASE STUDY NEW CONSTRUCTION INCENTIVES Building Type Energy Measures Park District Rec Center Recreation Center Lighting, HVAC, envelope, DHW Annual Energy Savings $10,643 Total DCEO Incentives $77,467 Net Incremental Cost $57,152 Simple Payback 5.3 years What they got Prescriptive Incentive for individual measures. They did not model the building due to costs constraints What they did New 39,100 sf recreation center Increased roof and wall R-values using precast concrete Reduce lighting power density by almost 0.3 W/sf High Efficiency GSHP Open April 2014 Case study by SEDAC 66

63 CASE STUDY NEW CONSTRUCTION INCENTIVES High School Building Type K-12 Energy Measures Annual Energy Savings $9,061 Lighting, HVAC, envelope Total DCEO Incentives $110,336 Net Incremental Cost $34,137 Simple Payback 3.7 years What they did 147,867 sf addition and renovation Improved lighting Improved envelope High Efficiency HVAC What they got Incentive for 18% beyond code Case study by SEDAC 67

 10.")
64 CASE STUDY SUMMARY Energy Use Intensity /08 07/08 08/09 09/10 10/11 11/12 12/13 Total Incremental Cost $546,120 Incentives $340,508 Final Incremental Cost $205,612 Annual Utility Savings w/o solar $33,037 Simple Payback 6.2 years IRR (5% acceptable) 10.3% Net Present Value (10 yr, 5%) $53,952 Intro Form & Environment Loads HVAC

65 CASE STUDY ORIENTATION East West Axis South overhangs Northern and southern windows $82,000 $80,000 $78,000 $76,000 $74,000 $72,000 $70,


66 CASE STUDY SOLAR TUBES Natural light for interior rooms Better insulated than skylights 50 fc 1 fc 6 fc

67 CASE STUDY HVAC Ground source heat pumps EER 13.5 COP 4.5 Server room cooling tied to heat pump loop Dedicated outside air VAV with GSHP & heat recovery Demand control ventilation Economizers User control thermostats with +/- 2 F adjustment VFDs on water pumps


68 CASE STUDY PLUG LOADS Data center houses thin client servers for district ENERGY STAR equipment Elevator only usable as needed Computer energy management district-wide Vending energy management contractually obligated by vendors

69 TRAINING AND EDUCATION Online Trainings In-person Workshops Webinars Online Videos Publications Certification Courses: MEEA 73

70 SEDAC ONLINE TRAINING EB-101: Energy Assessments: A Cost Savings Solution for Schools EB-105: An Introduction to Energy Terms and Measurements EB-106: Introduction to Building Equipment EB-107: Sample Calculations for Energy Cost Reduction Measures NC-201 Designing Beyond Code NC-301 Strategies for Designing Energy Efficient New Construction Projects 74


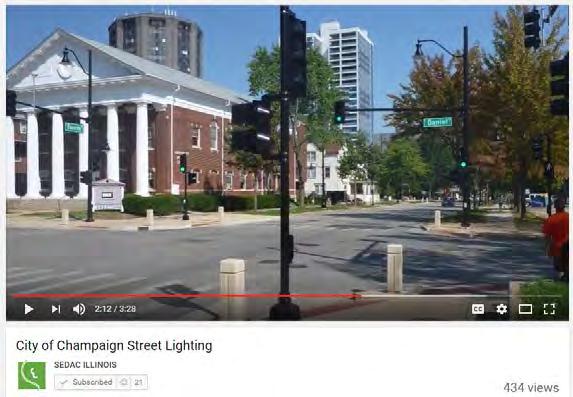
71 VIDEO CASE STUDIES 75


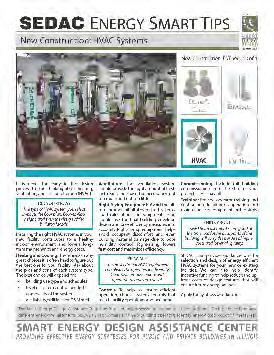


72 PUBLICATIONS 76

73 SUMMARY SEDAC is in place to help identify cost effective energy efficiency solutions for buildings in Illinois We are a first-stop for all your ILLINOIS ENERGY NOW questions Trade Allies are private sector partners to help make changes There are many examples of other owners who have taken advantage of these programs. Get your buildings involved in these programs! Energy Assessments Retro-Commissioning New Construction Design Assistance New Construction Incentives Andy Robinson, CEM, LEED AP Training and Education Director, SEDAC 77


74 Illinois Energy Now