Phytoplankton Community Index (PhyCoI) A new way of assessing ecological health in lakes and reservoirs
|
|
|
- Cory Jefferson
- 5 years ago
- Views:
Transcription

1 Phytoplankton Community Index (PhyCoI) A new way of assessing ecological health in lakes and reservoirs LMRCC Annual Meeting, June 21, 2016, Memphis, Tennessee Reed Green, Hydrologist, U.S. Geological Survey, Lower Mississippi-Gulf Water Science Center U.S. Department of the Interior U.S. Geological Survey
2 Phytoplankton Community Index (PhyCoI)* Based on the fact that phytoplankton biomass and community structure, 1. respond to changes in water quality and 2. by themselves also influence water quality. *Katsiapi, M., Moustaka-Gouni, M., and Sommer U., Assessing ecological water quality of freshwaters: PhyCoI a new phytoplankton community index. Ecological Informatics 31:
3 PhyCoI Accommodates double role of phytoplankton as indicator and impact 5 different levels combining both specific metrics (1) total biomass, (2) cyanobacteria biomass, (3) taxonomic group biomass, (4) taxonomic group species richness, and (5) a new quality group sub index.
4 PhyCoI Scores PhyCoI = TB + WG + NB + NS + QG (range, 0-5) 0-1 = Bad 1-2 = Poor 2-3 = Moderate 3-4 = Good 4-5 = High

5 Main taxonomic groups as a fraction of total biomass Brettum P., and Anderson, T The use of phytoplankton as indicators of water quality. Norwegian Inst. for Water Research. 33 pp.


6 Cyanobacteria (blue-green algae) Source:
")

7 Chlorophytes (green algae) Source:


8 Desmids Source:


9 Euglenophytes Source:


10 Chrysophytes (golden-brown algae) Source:
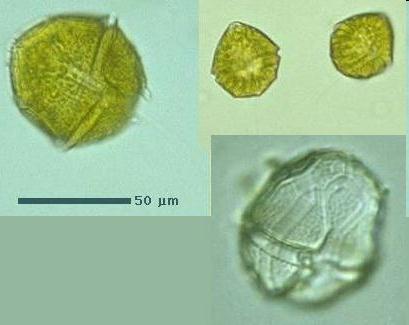


11 Dinoflagellates Source:

12 Cryptophytes Source:


13 Diatoms Source:
14 #1 Total biomass (TB) Total phytoplankton biomass (Smith, 2003) <0.1 mg/l = ultraoligotrophic (2.0) mg/l = oligotrophic (1.6) mg/l = mesotrophic (1.0) mg/l = eutrophic (0.6) >8.0 - hypereutrophic (0.2) Smith, V Eutrophication of freshwater and coastal ecosystems, a global problem. Environ Sci & Pollut Res 10 (2)
15 #2 Cyanobacteria biomass (WG, WHO guidelines) Total cyanobacteria biomass <0.2 mg/l = <WHO Level 1 (1.0) mg/l = WHO Level 1 (0.8) mg/l = WHO Level 1 (0.5) mg/l = WHO Level 2 (0.3) > 100 mg/l = Scum formation (0.1)
16 #3 Modified Nyaard Index (NB, biomass) cyanobacteria + chlorophytes + euglenophytes chrysophytes + desmids 0-1 mg/l (0.5) 1-10 mg/l (0.4) mg/l (0.3) mg/l (0.2) >1000 mg/l (0.1)
17 #4 Modified Nyaard Index (NS, species richness) cyanobacteria + chlorophytes + euglenophytes chrysophytes + desmids <2 ultra-oligotrophic (1) 2-4 oligotrophic (0.8) 4-6 mesotrophic (0.6) 6-8 eutrophic (0.4) > 8 hypereutrophic (0.2)
 46-60 (0.4) 31-45 (0.")
18 #5 Quality Group species (QG) QG = 5 x chrysophytes + 2 x desmids + dinoflagellates + cryptomonads + diatoms > 60 (0.5) (0.4) (0.3) (0.2) <16 (0.1)
19 PhyCoI Scores PhyCoI = TB + WG + NB + NS + QG (range, 0-5) 0-1 = Bad 1-2 = Poor 2-3 = Moderate 3-4 = Good 4-5 = High
 example")
20 Katsipi et al. (2016) example


21 Lousiana Oxbows
22 Oxbow Phytoplankton Composition April 2013 August 2013 August 2014 November 2014 Feb-March 2015 May 2015
23 Oxbow PhyCoI Scores


24 Louisiana Reservoirs
25
26
27
28
29
30
31
32
33
34
35 Results from this little exercise: To reach the good threshold (PhyCoI >3), Secchi depth > ~ 10 feet Chlorophyll a < ~ 4-5 ug/l TN:TP > ~ 50:1 Phosphorus and Nitrogen concentrations??????
36 PhyCoI Potential 5 metrics enhance consistency and robustness. Critical info embedded related to community structure reflect responses to environmental changes, and express potential impacts of phytoplankton on water quality.
37 PhyCoI Potential Using an index based on higher taxa instead of individual species has the advantage of being less sensitive to lacks in taxonomic skills of the microscopist. Relation between PhyCoI and Secchi depth allows for high frequency monitoring (Secchi) with periodic PhyCoI analysis.
38 PhyCoI Potential Lake and reservoir environmental health can be determined without expensive chemical analyses, without the wait for receiving analytical results which can be months. Cost-effective tool for large-scale, long-term monitoring programs for ecological water quality assessment and management.
39 What about fisheries? The PhyCoI might work well for assessing lake and reservoir water quality for drinking water, recreation, and asthetics, but, how would it relate to fisheries?