Macromodels & Data Products Provide Context BUT Local Precision Needed for Decision Makers
|
|
|
- Kevin Cole
- 5 years ago
- Views:
Transcription
1 Macromodels & Data Products Provide Context BUT Local Precision Needed for Decision Makers
2 Macromodels & Data Products Provide Context BUT Local Precision Needed for Decision Makers High-resolution landscape models I m going to invest here instead of here


3 Low Cost Sensors, Standard Protocols, & NHD Framework Can Significantly Improve Precision Many stakeholders Boots-on-the-Ground Inexpensive sensors & standard data protocols Models, analyses, & information Open access databases

4 More Local Measurements = More Precision Miniature Temperature Sensors Vendor & Sensor model Accuracy Battery life & memory Cost Hobo Pro v2 +/-0.2 C 6 years $123 Tidbit v2 +/-0.2 C 5 years $133 ibutton +/-0.5 C 1 year $20 40 Tinytag Aquatic 2 +/-0.5 C 1 year $170


5 Discharge Pressure Transducers Vendor & Sensor model Accuracy Battery life & memory Cost Onset Hobo +/-0.05% 5 years $300 Global Water WL16 +/-0.1% 1 year $1,000 INW PT2X +/-0.05% 1.5 years $1,095 In-Situ Level TROLL +/-0.05% 10 years $1,170


6 Yet More Miniature Sensors Conductivity ph Light sensors Oxygen

7 Stream Temperature ( C) Stream Temperature ( C) Sensors Yield Semi-Continuous Measurement Records with Time Stamps Daily Cycles 10 8/14 8/15 8/16 8/17 8/18 8/19 Seasonal/Annual Cycles /11/ /21/2012 8/29/ /7/2012 3/17/2013 6/25/ /3/2013


8 Biological Sensing: Traditional Methods


9 Biological Sensing: Environmental DNA (edna) The data The data sheet ~$2,000 of equipment


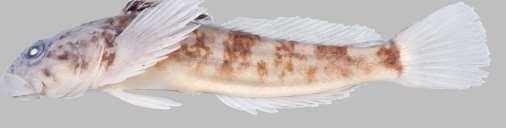
10 One Person Can Sample Many Sites Rapidly 20 minutes to collect a sample Precise species distribution information


11 Electrofish density edna Density ~ Fish Abundance r 2 = % 50% 0% edna copies Wilcox et al Biological Conservation 194:


12 Samples Contain edna for All Critters Comprehensive Biodiversity Assessments are Possible


13 edna Samples Serve as a Longterm BioDiversity Archive Processing destroys only a small portion of a sample Samples can be dry stored in freezer or office Sample processing ~$100
 2008 2009")

14 edna Is a Nascent Field Number of Aquatic edna Studies (n = 320) Costs will shrink


15 Standardized & Robust Data Collection Protocols Exist
16 Example: BACI design to Measure Local Flow Restoration Effect A) How much does flow alteration affect temperature?
 How much does flow")
 Does better flow passage design result")
17 Example: BACI design to Measure Local Flow Restoration Effect A) How much does flow alteration affect temperature? B) Does better flow passage design result in dispersal?

18 Example: NHD Guided Network Sampling Design Monitoring network in central Idaho 7,000 hectares and 2,500 stream kilometers


19 Link Descriptors to NHD Reaches to Make Network Queries Possible Easily done anywhere Elevation Slope %Landuse Precipitation 10 s more
20 Summarize Network Gradients & Locate Sensors Based on Design Criteria (SRS, Systematic, GRTS, etc.) = network stream segment = segments with sensor


21 Example: NHD Guided Network Sampling Design Monitoring network in central Idaho 7,000 hectares and 2,500 stream kilometers Stream sensors Air sensors Initial Cost: $10,000 Maintenance Cost: $1,000 per year 2 people, 2 weeks to visit sensors (download & replace)


 =")
22 Example: NHD Guided Network Sampling Design Utah Temperature Monitoring Enhancement Pre-existing sites (n= 143) New sensor sites (n = 60) = stratification = GRTS Random

23 Example: NHD Guided Network Sampling Design Pacific Lamprey Regional edna Sampling Design Obtain existing biological survey data (n = 988) Link data to NHD covariates & build preliminary model Systematically edna sample potential habitat Use model to predict habitat suitability throughout study area network


")
24 Example: Network Scale Model of Drought Year Effects on Trout Thermal Habitat Clearwater River Basin: 16,700 stream kilometers 4,487 August means 746 stream sites 19 summers ( ) Clearwater R. Temperature site
 7. Baseflow Index (USGS) 8. Watershed size (NHD) 9. Discharge (NWIS - USGS) 10. Air Temperature (USGS, COOP, many sources) 25 20 15 10 5 r 2 = 0.95; RMSE = 0.")
25 Predicted ( C) Statistical Stream Temperature Model Covariate Predictors 1. Elevation (DEM) 2. Canopy (NLCD) 3. Stream slope (NHD) 4. Ave Precipitation (NHD) 5. Latitude (GPS) 6. Lakes upstream (NHD) 7. Baseflow Index (USGS) 8. Watershed size (NHD) 9. Discharge (NWIS - USGS) 10. Air Temperature (USGS, COOP, many sources) r 2 = 0.95; RMSE = 0.60 C Summer Temperatures Observed ( C) SSN Isaak et al The NorWeST summer stream temperature model & scenarios for the western U.S. Water Resources Research 53:
26 Air Temperature ( C) Summer Climate Variation ( ) Year Discharge (m 3 /s) COOP Stations NWIS - USGS 18 Air temperature Discharge
")
 Drought year")
27 Prediction Maps for Summer Temperatures Average year (2010) temperature = 12.2 C Temperature ( C) Drought year (2015) temperature = 13.7 C


28 Where are Cutthroat Trout Negatively Affected? Average year (2010) Too Cold <11.0 C Suitable <17.0 C & >11.0 C Too Hot >17.0 C Drought year (2015)
29 I m going to invest here instead of here