Rating of Cities, National Urban Sanitation Policy Government of India
|
|
|
- Aileen Dean
- 5 years ago
- Views:
Transcription

1 Rating of Cities, National Urban Sanitation Policy Government of India WSSCC Global Forum Rewards, Sanctions and Benchmarking Mumbai, India 10, October, 2011 EP Nivedita, Director, Ministry of Urban Development, Govt. of India and Vivek Raman Water and Sanitation Program, 1

 sewer networks. 13.")

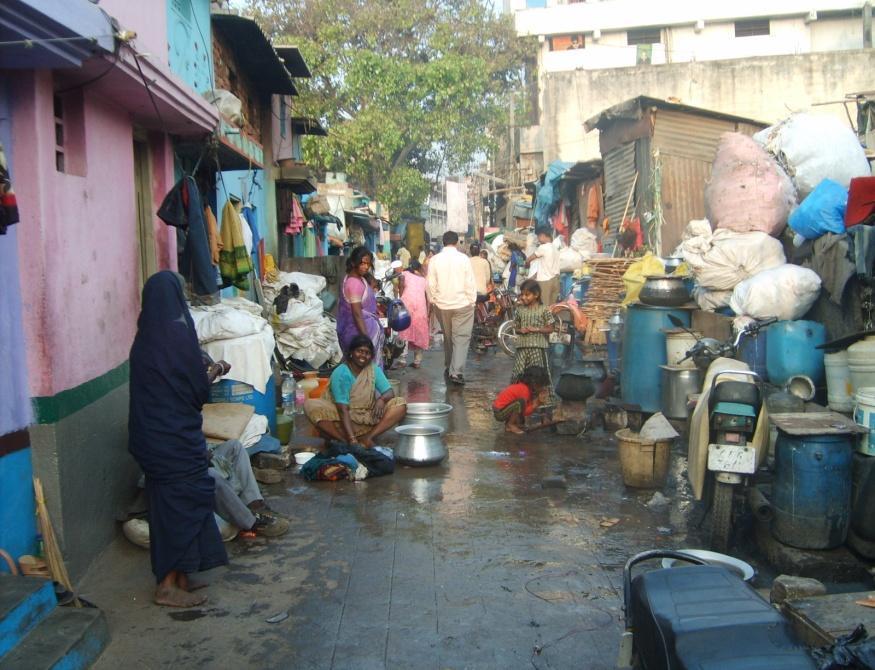
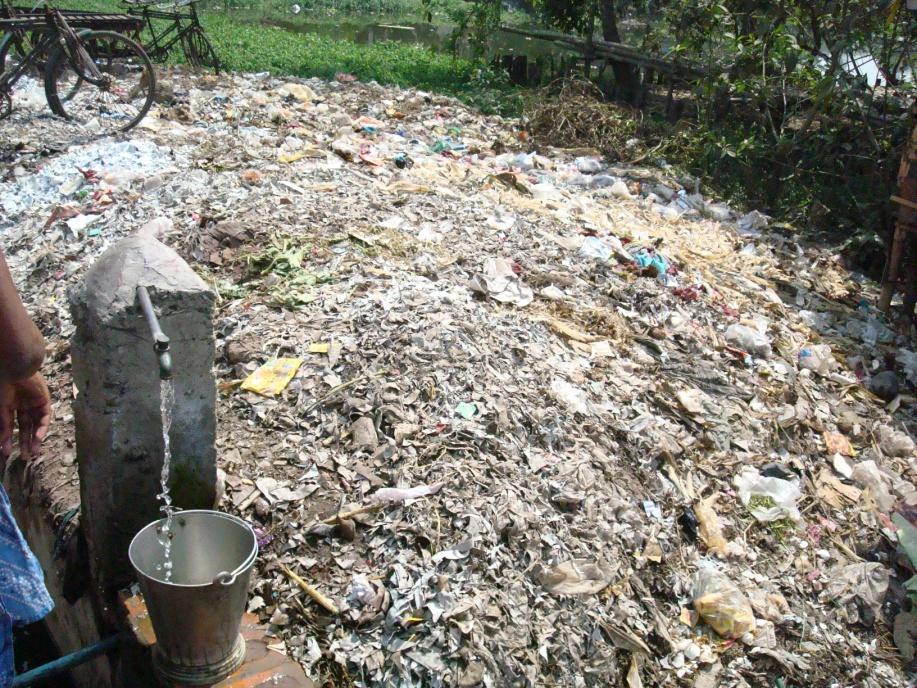
2 Urban Sanitation in India Large urban migration: 331 million people reside in urban India in 5161 cities More than 40 million resort to open defecation 82 % households dispose human waste unsafely causes 80% of surface water pollution Only 300 cities have partial (20-50%) sewer networks. 13.5% of the wastewater from cities is treated. Outcomes are not achieved CITIZENS SUFFER No Accountability multiple institutions responsible for different activities 2
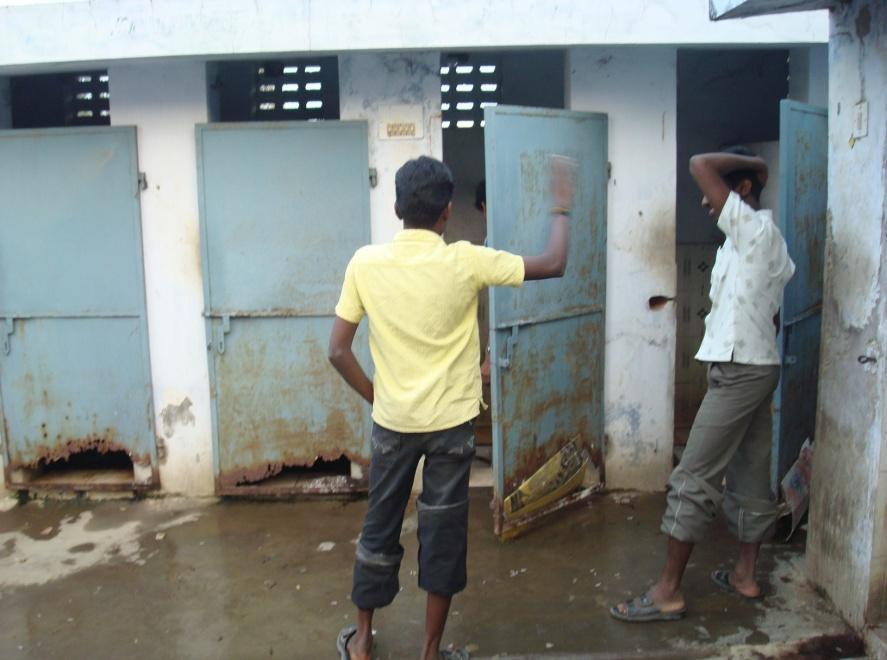
3 Its not just about coverage unsafe collection, treatment and disposal On site sanitation and sewerage Household Toilet 56% No Household Toilets 44% On Site Disposal 34-46% Sewerage Connection 28-40% Shared toilets 24% Community Toilets 9% 40 million households Open Defecation 11% Safe Disposal 18-52% Unsafe Disposal % 3 Sources: NSS 65th Round, Report No. 535: Housing Condition and Ammenities in India: July 2008 June 2009 (Nov 2010)
, ESI, WSP 2010 Issues Lack of awareness: Banned but still exist: Manual Scavenging Dense")

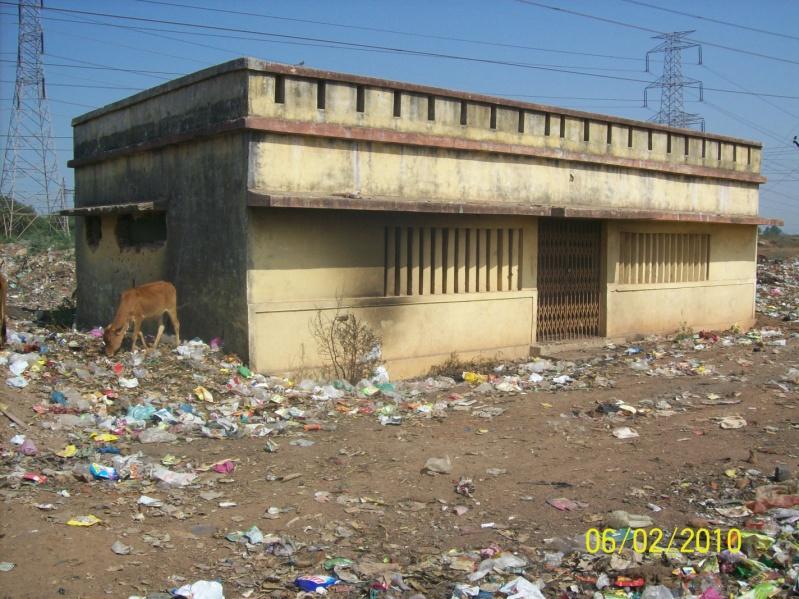
4 Urban Poor worse off Context The poorest urban households bear the highest per capita impacts (Rs 1700), ESI, WSP 2010 Issues Lack of awareness: Banned but still exist: Manual Scavenging Dense informal settlements: Most resort to open defecation Lack of tenure; even if motivated unable to invest in sanitary facilities Community toilets not enough and poorly maintained: high ratios of persons / seats 4
5 5


6 National Urban Sanitation Policy Vision: All Indian cities and towns become totally sanitized, healthy.., ensure public health and environmental outcomes for all their citizens. Goals: Target behavior change; Achieve open defecation free cities; Total Sanitation: Safe disposal of 100% human and liquid waste; State sanitation strategies and city sanitation plans for every state; 6
7 Evolution of Sanitation Policy & Rating Govt forms task force supported by TA Workshop seeds idea for a national urban sanitation policy Outcome oriented approach adopted for planning 2008 National workshops with stakeholders to draft policy 2008: National Urban Sanitation Policy approved by Cabinet of India 2010: National Rating of 423 cities and Clean City Award 2009 on: State sanitation strategies and city sanitation plans developed 7
8 Sanitation Rating of cities The Nirmal Shahar Puraskar Reward Scheme Biennial rating & reward for achieving sanitation outcomes Why a rating of cities? Mobilize cities on a competitive basis to rapidly promote and achieve milestones Prioritize total sanitation Advocacy tool for awareness Monitor and measure progress of achieving national policy goals Recognize excellent performance 8


9 Rating of Cities: Methodology 19 indicators divided into 3 categories Categories of Indicators Output = Infrastructure created 9 indicators Process = Systems/ procedures 7 indicators Outcome = Health and water quality 3 indicators Outcome 20% Process 30% Output 50% 423 cities with population over 100,000 rated covered 72% of urban India Cities divided into Metro: x > 5 million Big Cities: 1 million < x < 5million Other Cities = 100,000 <x< 1 million Metros Big Class I Other Class I Number of Cities 9


10 How and who did the rating? 423 cities divided into five packages North, South, East, West, Central Total cost approx $1.1 million ($3000/ city) 100% funded by Government of India Three agencies hired competitively Firms trained on common methodology Sites selected with ULB and mix of slum/non slum, railway stations and commercial areas etc. 10


11 Consulting local governments Pre Survey Draft Methodology, Training of agencies Methodology put on website and sent to states and cities Press conference by Union Minister in Dec 09 announcing the survey Letters sent to states/ cities to support agencies with data/ survey Post Survey Verification /analysis of data Data and score of cities sent to states for comments in 1 month National consultation workshop in May 10 with state and city to voice concerns with city scores. Results declared to public by Union Minister 11
12 Unique Color coding of Cities City Color Codes: Categories Category Red: Less than 33 points Black: points Blue: points Green: points Description Needs immediate remedial action Needs considerable improvement Recovering Healthy and clean city 12


13 Results of 2010 Rating of Cities 185 cities in red category ; 234 cities in black category Only four cities in blue category, No city is green and healthy No rated city can claim open defecation free Over 50 cities report 90% safe collection of human excreta, But 380 collect & treat less than 40% human excreta & dispose unsafely 24 cities report collecting over 80 % of solid waste, but open dumping still exists: About 90% of cities (379) treat less than 40 percent of their sewage- 285 cities water body samples failed completely; only 20 cities passed all samples Only 26 cities passed all drinking water samples 13
14 Changed perspective: Outcomes of Rating and Policy Excellent response from press and public on rating of cities. Union Minister writes detailed report to each provincial Minister urging to take action States initiating state level rating and incentive system Central Government allocates $20 million to draft city sanitation strategy shifting focus from infrastructure Using rating goals as aspiration: CSPs intensified: with support from six donor agencies; Awareness campaign with Bollywood actor, Aamir Khan as Ambassador Rating round 2 Underway likely for 600 cities 14
15 Some thoughts for discussion How to initiate, scale up and sustain Advantages Strong government push and political will Reliability of Data; Good firms for survey Streamline investments according to rating Encourage cities to improve: Give them time to improve; Rating Once every two years Technical expertise required to drive process and monitor survey State and city should own data Increases accountability Recognition and encouragement A government rating stands as an official rating Public awareness and advocacy Provides a monitoring framework Shifting focus from asset creation to measuring outcomes 15
16 For more information on National Urban Sanitation Policy and Rating of Cities refer to: 16