MEMORANDUM. Suwannee River Water Management District Governing Board. Tom Mirti, Director, Division of Water and Land Resources
|
|
|
- Jocelin Day
- 5 years ago
- Views:
Transcription
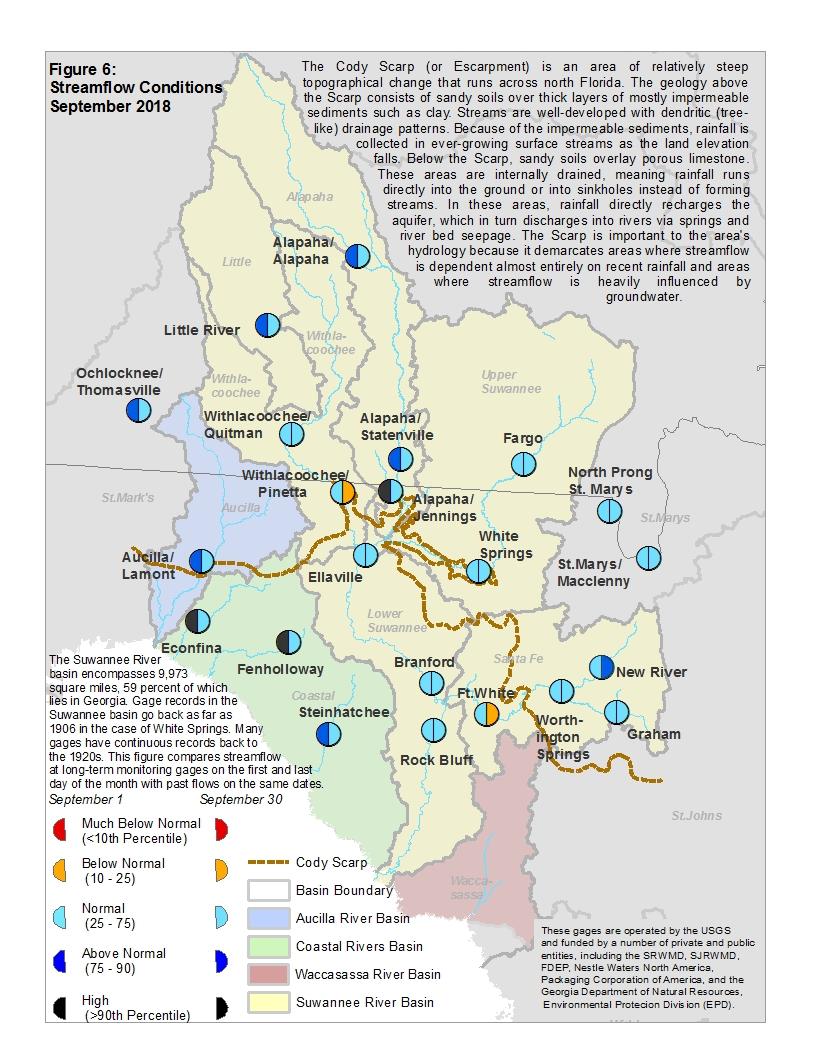
1 MEMORANDUM TO: FROM: THRU: Suwannee River Water Manaement District Governin Board Tom Mirti, Director, Division of Water and Land Resources Huh Thomas, Executive Director DATE: ober 8, 2018 RE: tember 2018 Hydroloic Conditions Report for the SRWMD RAINFALL District-wide rainfall in tember averaed 3.44 inches, or moderately lower than the lon-term averae tember rainfall of 5.61 (Table 1, Fiure 1). In all counties within the District rainfall was lower than normal durin the month of tember. However, there were areas of hiher than normal rainfall in some areas alon the coast and northeastern sections of the District (Fiure 2). The maximum daily rainfall recorded at a sinle station was at New River Tower in Bradford County, where 2.21 of rain fell on tember 28 th. The hihest aed monthly rainfall total of 7.51 was also recorded in Bradford County, at the Bureau of Property Assistance. The lowest measured monthly rainfall at a District rainfall station was 1.79 at Wacissa Goose Pasture (Jefferson County). Averae rainfall across the District for the 12-month period endin tember 30 was 54.57, very close to the annual rainfall averae of 54.61". This brins the District overall to a rainfall deficit of 0.04 as of the end of tember (Table 1, Fiure 3). Coastal areas are showin rainfall surpluses of more than 15 inches in some limited areas in Taylor, Dixie and Levy counties. The Aucilla, Suwannee and Santa Fe river basins had rainfall deficits over the past three months (Fiure 4). The coastal basins and the Waccasassa River basin continue to have rainfall surpluses over the past three months, a eoraphic pattern of rainfall surplus that was first seen this year durin the month of il. SURFACEWATER Rivers: By the end of tember most river flows were within the 25 th to 75 th percentile rane. (Fiure 5). This continues a District-wide trend of lower flows that bean in ust. At the Santa Fe River at Fort White, Withlacoochee River at Pinetta, and Aucilla River at Lamont aes, flow dropped considerably in tember and is now at or near the 25 th percentile (Fiure 6). Lakes: Water levels at many lakes in the District continued a decline that bean in ust in response to low rainfall (Fiure 7). Low water levels persisted at Sampson Lake and Lake Crosby (Bradford County) as well as at Cherry Lake (Madison County). By contrast water levels at Andrews Lake in Taylor County continued to be hih. Water levels at this lake bean to rise in uary 2018 and the District record of manual measurements indicates that the lake has not been at this hih a water level since 2005.
2 Sprins: Field measurements of flow were made at 4 sprins in the District by the U.S. Geoloical Survey (USGS), District staff, and District contractors in tember. Flow at many sprins in the District declined in tember, reflectin lower rainfall than in ust. At times the sprins alon the Suwannee River are affected by backwater when river floodin impines on sprin pools. This was seen at Fannin Sprins in tember when flows that had been above the 25 th percentile since il 2018 dipped below the 10 th percentile durin river floodin near the end of tember (Fiure 8). Flow at the Wacissa River durin ust and tember was low compared to the record for the past 10 years (Fiure 9) and appeared to be below recorded minimums in previous years. GROUNDWATER In tember the marked decrease in rainfall compared to ust was reflected by measured levels in the Upper Floridan Aquifer (UFA), which declined at many locations (Fiure 10). There was considerable variability in the UFA chane within the District, ranin from declines of over 5 feet in much of Hamilton County to rises of over 3 feet in other areas that had hih rainfall in tember (Fiure 10a). On a District-wide basis, UFA levels declined by 0.65 feet in tember, endin the month at the 74 th percentile on averae. Despite the eneral District-wide decline in roundwater levels, of the 120 wells in the District's monitorin network 36 (30%) were at still levels at or above the 90th percentile at the end of tember, compared to 41% at the end of ust. Two wells continued to set new maximum records in tember: the USGS Bronson well, and the well on the campus of the University of Florida. Hydroraphs for a roup of UFA wells with records that extend back to the mid-1970s are provided in Fiure 11 alon with summary statistics for the full period of record. Nearly all wells in this roup ended the month of tember at or above lon-term averae levels, and wells in Taylor, Bradford and Levy counties remain near or above record maximum levels. Several other UFA wells with lon records still have levels above the 90 th percentile (Fiure 12a). Levels at 5 wells with records that o back to at least the 1960s continue to show recovery from the 2012 drouht (Fiure 12b). HYDROLOGICAL/METEOROLOGICAL INFORMATION The National Weather Service s Climate Prediction Center (CPC) is continuin the El Niño watch that has been in place since 2018 and predicts an increasin chance of a transition to El Niño conditions by late These conditions typically result in above averae rainfall in Florida when they occur in the fall, winter and sprin of the year. A La Niña episode that bean in the fall of 2017 ended in 2018, accordin to the CPC. The U.S. Drouht Monitor report for the week endin tember 4th showed no drouht conditions anywhere in the District. Northern and central Peninsular Florida displayed nearnormal drouht severity conditions accordin to the Palmer Drouht Severity Index for the first week of ober. 2
3 CONSERVATION Water conservation continues to be necessary to sustain healthy roundwater levels and flows in District sprins and rivers. All users are ured to eliminate unnecessary uses. Landscape irriation durin Dayliht Savins Time (ch 11 to ember 4, 2018) is limited to twice per week based on a District water conservation rule that applies to residential landscapin, public or commercial recreation areas, and businesses that are not reulated by a District-issued water use permit. Information about SRWMD s year-round conservation measures is available at This report is compiled in compliance with Chapter 40B , Florida Administrative Code, usin rainfall (ae-adjusted radar-derived estimates), roundwater (97 wells), surfacewater (35 stations), and eneral information such as drouht indices and forecasts. Data are provisional and are updated as revised data become available. Data are available at or upon request. ACKNOWLEDGEMENTS The Hydroloic Conditions Report is a monthly effort of the Water and Land Resources Division s Data Collection Proram. Acknowledement is made to the followin staff for their sinificant contributions, hard work and dedication to the timely production of this report: Data Collection: Kevin Jones, Henry Richardson, and Vince Robinson QA/QC and Reportin: Fay Baird, Ross Davis, Connie Woodward Administrative Support/Document Preparation: Pennie Flickiner 3
4 Table 1: Estimated Monthly Rainfall Totals by County (inches) County tember tember Month % Total Last Annual % 2018 Averae of Normal 12 Months of Normal Alachua % % Baker % % Bradford % % Columbia % % Dixie % % Gilchrist % % Hamilton % % Jefferson % % Lafayette % % Levy % % Madison % % Suwannee % % Taylor % % Union % % tember 2018 District Averae: tember Lon-Term Averae ( ): Historical 12-month Averae ( ): Past 12-Month Total: 12-Month Rainfall Surplus/Deficit: Fiure 1: Comparison of District-wide Monthly Rainfall (Rainfall reported in inches) Rainfall (inches) Past 13 Months Averae Maximum Minimum

5 Fiure 2: tember 2018 SRWMD Gae-adjusted Radar Rainfall Estimate


6 Fiure 3: 12-Month Rainfall Surplus/Deficit by River Basin throuh tember 30, 2018 Fiure 4: 3-Month Rainfall Surplus/Deficit by River Basin throuh tember 30, 2018
7 Fiure 5: Daily River Flow Statistics Percentile ober 1, 2017 throuhtember 30, Past 12 Months Flow Suwannee River at Faro, GA 10, , Suwannee River at White Sprins Suwannee River at Branford Suwannee River at Ellaville Alapaha River near Statenville, GA Withlacoochee River near Pinetta
8 Fiure 5, cont: Daily River Flow Statistics Percentile ober 1, 2017 throuh tember 30, Past 12 Months Flow Santa Fe River at Worthinton Sprins Santa Fe River near Fort White above SR47 Bride 10,000 1, Ichetucknee River at US 27 Steinhatchee River above US Econfina River on Salt Road above US Aucilla River at Lamont 10,000 1,000 1,
9


10 Fiure 7: tember 2018 Lake Levels SRWMD lakes react differently to climatic chanes dependin on their location in the landscape. Some lakes, in particular ones in the eastern part of the District, are embedded in a surficial or intermediate aquifer over relatively impermeable clay deposits. These lakes rise and fall accordin to local rainfall and surface runoff. They retain water durin severe drouhts since most losses occur from evaporation. Other lakes, such as Governor Hill and Waters Lake, have porous or leaky bottoms that interact with the Floridan aquifer. These lakes depend on roundwater levels to stay hih. If aquifer levels are low, these lakes o dry even if rainfall is normal. The District currently monitors 14 lakes on a lon-term basis; much of the data was oriinally provided by volunteer observers. Monitorin records bean in the 1970s, except for Lakes Butler, Sampson, and Santa Fe, which started in Feet Above or Below Historic Averae

11 Fiure 8: Dischare Over Past 12 Months, Fannin Sprins (dischare in cubic feet per second)
")
12 Fiure 9: Dischare Over Past 12 Months, Wacissa River near Wacissa, FL (dischare in cubic feet per second)

 Normal (25th to 75th Percentile) Low (10th to 25th Percentile)")

13 JEFFERSON TAYLOR SUWANNEE Fiure 10: tember 2018 Upper Floridan Aquifer Conditions Statistics for wells compared to historical records beinnin no earlier than 1976 UNION ALACHUA DIXIE BRADFORD GILCHRIST BAKER COLUMBIA LAFAYETTE MADISON HAMILTON LEVY Additional wells courtesy of SJRWMD, SWFWMD and USGS Hih (Greater than 75th Percentile) Normal (25th to 75th Percentile) Low (10th to 25th Percentile) Extremely Low (Less than 10th Percentile) & & Inset: ust Groundwater Percentiles Increase/decrease in level since last month Increase/decrease since last month less than one percent of historic rane District Boundary

14 Fiure 10 a: tember 2018 Chane in Level of the Upper Floridan Aquifer, SRWMD
15 Fiure 11: Monthly Groundwater Level Statistics Levels ober 1, 2017 throuh tember 30, 2018 Period of Record Beinnin 1976 Maximum Averae Since 1976 Minimum Past 12 Months 86 Madison County N near Greenville 56 Suwannee County S near Live Oak Upper Floridan Aquifer Elevation above NGVD 1929, Feet Columbia County S Lake City Lafayette County S near o Hamilton County N near Jasper Taylor County S Perry
16 Fiure 11, cont.: Groundwater Level Statistics Levels ober 1, 2017 throuh tember 30, 2018 Period of Record Beinnin 1976 Maximum Averae Since 1976 Minimum Past 12 Months 63.0 Union County S near Lake Butler 43.0 Alachua County S at Hih Sprins Upper Floridan Aquifer Elevation above NGVD 1929, Feet Gilchrist County S near Trenton Dixie County S at Cross City Bradford County S near Graham Levy County S near Bronson
17 Fiure 12a: Reional Lon Term Upper Floridan Monitor Wells (tember 2018) The Floridan aquifer system underlies Florida and parts of Alabama, Georia, and South Carolina. It is one of the most productive aquifers in the world. In the SRWMD and surroundin areas,it is the primary source of irriation and domestic drinkin water, as well as the source of sprins that sustain river flow durin drouhts. ( ( Rechare to the Floridan occurs naturally as rainfall filters beneath the root zone of plants in uplands, wetlands, and some lakes and rivers. The rechare rate depends on the soils and deree of confinement of the underlyin eoloy. Unconfined areas frequently consist of porous sands and limerock that permit hih rechare from rainfall and surfacewater. Rechare to confined areas is restricted by nearly impermeable deposits, such as clay, that bound the top of the aquifer. Semi-confined areas are bounded at the top by thinner or breached impermeable deposits. Water levels in the Floridan chane in response to climatic conditions and pumpin. A number of aencies in addition to the SRWMD monitor water levels in the Floridan. Of the hundreds of monitor wells across Florida and Georia, relatively few have continuous records that predate the 1980s. The wells on this map and a selection in fiure 12b are some of the wells in and near the SRWMD with the lonest continuous records. Map and confinement data source: Bellino, J.C., 2011, Diital surfaces and hydroeoloic data for the Floridan aquifer system in Florida and in parts of Georia, Alabama, and South Carolina: U.S. Geoloical Survey Data Series 584 ( ( ( Occurrence of Confined and Unconfined Conditions in the Upper Floridan Aquifer Confined: Upper confinin unit is enerally reater than 100 feet thick and unbreached. Rechare is low. Semi-confined: Upper confinin unit is enerally less than 100 feet thick, breached, or both. Rechare is moderate. Percentile of Most Recent Water Level Relative to Entire Record Very Hih (Greater than 90th Percentile) Hih (Greater than 75th Percentile) Normal (25th to 75th Percentile) Low (10th to 25th Percentile) Very Low (Less than 10th Percentile) Inset: Extent of Floridan Aquifer Unconfined: Upper confinin unit is absent or very thin. Rechare is hih. Data Not Available SRWMD Boundary

18 Fiure 12b: Reional Lon Term Upper Floridan Aquifer Levels Data throuh tember 2018 Taylor 57 Newberry Well Alachua County Lake City DOT Raiford Sanderson Newberry Taylor and Sanderson wells courtesy of SJRWMD Upper Floridan Aquifer Elevation above NGVD 1929, Feet USGS Taylor Well Baker County DOT Lake City Well Columbia County USGS Sanderson Well Baker County 1963 USGS Raiford Well Bradford County 1959