CLIMATE CHANGE REGULATION IN CALIFORNIA. NCSL Summer Energy Outlook Conference Denver, CO
|
|
|
- Mae Powers
- 5 years ago
- Views:
Transcription
1 CLIMATE CHANGE REGULATION IN CALIFORNIA NCSL Summer Energy Outlook Conference Denver, CO
2 OUTLINE The GhG Issue California Policy Landscape Utility/SMUD Reduction Options Carbon Sequestration & Offsets Energy Efficiency RD&D Renewables
3 THE GHG ISSUE Citizens Believe Global Warming is Happening & Will Get Worse in Future Numerous Scientific Studies, IPCC Reports Federal Legislation Developing Other States Taking Action, e.g., RGGI Many California Scientific & Policy Reports
4 THE GHG ISSUE Emissions Scenarios (End of century Atmospheric C0 2 Concentration) Higher Emissions A1fi (970 ppm) Medium-High Emissions A2 (830 ppm) Lower Emissions B1 (550 ppm) 90% loss in Sierra snow pack cm (22-30 inches) of Sea level rise 3-4 times as many heatwave days in major urban centers times the number critically dry years 3 20 % increase in electricity demand 4-10 times as many heat-related deaths projected for some urban centers 4 Increase in Forest yields not evaluated for this scenario 5 Increase in Fire risk not evaluated for this scenario 5 Increase in days meteorologically conducive to ozone formation % loss in Sierra snow pack cm (14-22 inches) of Sea level rise 1-2 times as many heatwave days in major urban centers times as many heat-related deaths projected for some urban centers % increase in days meteorologically conducive to ozone times the number critically dry years 3 11% increase in electricity demand 30% decrease in forest yields (Pine) 55% increase in the expected risk of large fires % loss in Sierra snow pack cm (6-14 inches) of Sea level rise times as many heatwave days in major urban centers 2-4 times as many heat-related deaths projected for some urban centers % increase in days meteorologically conducive to ozone formation 6 Upto times the number critically dry years % increase in electricity demand 7-14% decrease in forest yields (Pine) 10-35% increase in the risk of large fires Statewide Temperature Rise (ºC) ºC ( ºF) ºC ( ºF) ºC ( ºF) Increased Temperatures Reduction in Snowpack Worsened Air Quality Increased Risk of Flooding Source: California EPA Climate Action Team Report, Figure 4-9, 2006
5 THE GHG ISSUE Electricity 12% Residential 7.6% Commercial 3.4% Electricity 28.5% Residential 14.6% Industry 20% Commercial 12.7% Transportation 57% Transportation 24.2% Industry 20% California (left) and US (right) CO2 Emissions in 2006 Source: DOE EIA 2006 Data
6 2,500 2,000 1,500 1, THE GHG ISSUE Average CO2 Emissions Rates for Various Technologies Cosumnes SMUD Cogens Gas Peaker Oil Fired Combined Cycle IGCC w/o sequestration Conventional Coal Gas Combined Cycle SMUD y2005 Generation Avg lbs CO2/MWh
7 GHG 2020 & 2050 GOALS 80% Reduction below state s 1990 levels (2050) Based on Climate Change Science 1600 Comparison of Emissions Output Rates Emissions Rate (lbsco2/mwh) US 2004 Avg Emis Rate 2004 CA Avg Emis Rate SMUD Fossil Emis Rate SMUD Total Emis Rate Expected Target 2020 CA Rate Expected Target 2050 CA Rate
8 CALIFORNIA POLICY Governor s Executive Order (2005) 1990 Levels by 2020; 80% below 1990 by 2050 SB CO2 Limit for Utility Investments in Baseload PPs (2006) SB 1078 & SB 107 Renewables Portfolio Standard (RPS) (2006) AB 2021 Energy Efficiency Standard (2006)
9 CALIFORNIA POLICY AB 32 (2006) 1990 Levels by 2020 (29% less than BAU) California Air Resources Board = Lead Agency Direct Regulations - - Multi Sector Market-based Cap and Trade CEC&CPUC Recommendations- Utility Sector CARB Adoption: 2008 = Scoping Plan; 2011 = Comprehensive GhG Regs; 2012 = Enforceable
10 REDUCTION OPTIONS Carbon Sequestration Permanent Storage in Spent Gas/Oil Wells, EOR, Deep Saline Aquifers, Deep Ocean Performance? Cost? Offsets Preserve a Forest & Get Credit for Emissions What will be Eligible & How Much Credit???
11 ENERGY EFFICIENCY SMUD s Board adopted most aggressive energy efficiency goals in CA 15% over ten years 10-YEAR ENERGY EFFICIENCY TARGETS ADPOTED BY THE SMUD BOARD OF DIRECTORS Total 10-Yr Avg GWh MW Budget ($millions) $ 25 $ 34 $ 40 $ 45 $ 45 $ 46 $ 46 $ 47 $ 48 $ 49 $ 50 $ 450 $ 45 The 10-year goals ( ) were adopted by the SMUD Board of Directors on May 17,2007
12 ENERGY EFFICIENCY SMUD Residential Programs - Residential Services - Equipment Efficiency - Appliance Efficiency - Solar DHW - Shade Trees - New Construction - - Energy Star Lighting, Pool & Spa Efficiency
13 ENERGY EFICIENCY SMUD Commercial/Industrial New Construction (Savings By Design) Retrofit Programs Lighting and HVAC rebates Small C/I HVAC Tune-Up Retrocommissioning Building Operator Certification Process/industrial rebates
14 ENERGY EFFICIENCY SMUD Energy Efficiency Loans Program Averages $25-30 million in loans per year loans/yr 99% residential $42 million portfolio 7 ½% interest rate Terms up to 10 years Program has operated for 28 years $389 million over life of program 127,500 loans
15 ENERGY EFFICIENCY SMUD LOCAL GOVT. PROGRAM - 7 local governments: 6 cities & County of Sacramento Incorporate energy efficiency in general plans and developer agreements Eliminate permit fees for retrofit photovoltaic installations, Streamline application process, over the counter review, & final inspection in 24 hours Started the Build It Green Public Agency Council with local city managers, building officials, planning directors


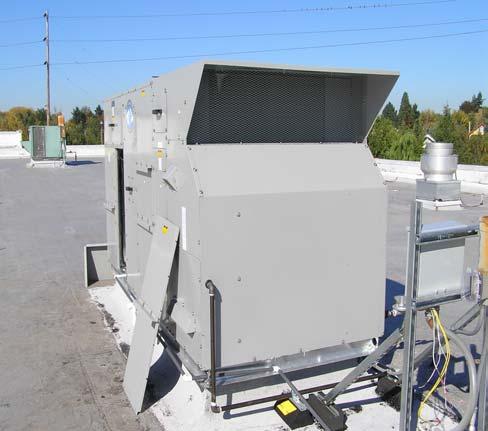
16 ENERGY EFFICIENCY CHP - SMUD JPAs Owns 3 Large Cogen Plants DG Cooling Heating & Power Current Program Fuel Cell Energy 300 kw MCFC Define Market, Feasibility Studies, Own/Operate or Provide Incentives? -Railyards, Blue Diamond, Airport -Terminal B Rebuild, Others Capstone 30 kw Microturbine

17 8,964 homes 1,000 hotel rooms 1,370,000 ft 2 retail 1.478,000 ft 2 office 416,690 ft 2 Historical

18 EFFICIENCY RD&D Emerging Technologies Focus Demand Side


19 Supply Side SUPPLY SIDE RD&D

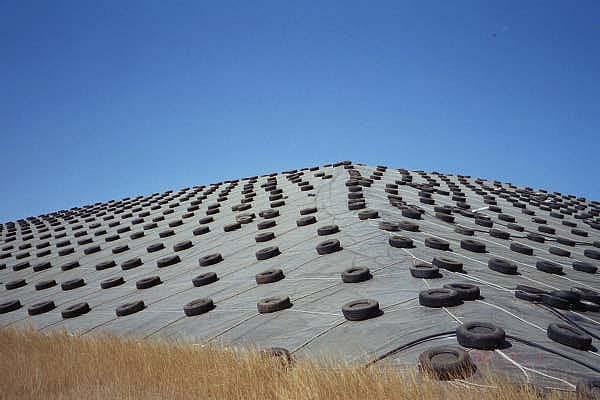
20 RD&D - LANDFILLS Problems 10-40% of methane produced at a landfill (with collection) is lost Smaller landfills are not required to collect gas and release all their gas to atmosphere Opportunities Controlled bioreactor landfills capture 95% of methane New landfills are difficult to site - diverting organic wastes from landfills can extend their life
21 Relative Generation Rate RD&D - BIOGAS PRODUCTION Anaerobic Bioreactor Landfill Conventional Landfill 2 1 Time (Years)
22 RENEWABLE ENERGY Green Pricing Program (97) called Greenergy RPS (2001) Renewable Energy Programs 2007 Supply Goal 2007 Actual Supply* (Estimate) 2011 Supply Goal RPS 12% 14.6% 20% Greenergy 2.2% 2.2% 3% Total 14.2% 16.8% 23% * Accounts for sales of surplus RECs in The final percentage could be lower due to sale of addtitional RECs.
23 SMUD's RENEWABLE ENERGY MIX 2007 TOTAL BIOMASS 45% TOTAL WIND 27% TOTAL PV < 1% TOTAL SMALL HYDRO 6% TOTAL GEOTHERMAL 22%
24 3500 Renew ables Demand Reduction due to Board EE Target ENERGY NEEDED TO MEET GOAL (w ith Board EE Target) SB-1 Estimated Solar Energy to be Added to SMUD's RPS Solano Wind 3 (128 35% CF = 392 GWh) EXISTING RENEWABLES Goal (w ith Board EE Target) Goal (w ithout Board EE Target) SMUD's Renewable Energy Supply (As of March 18, 2008) Renewable Energy (GWh) Year
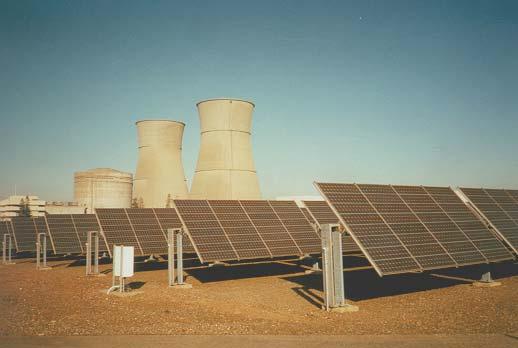
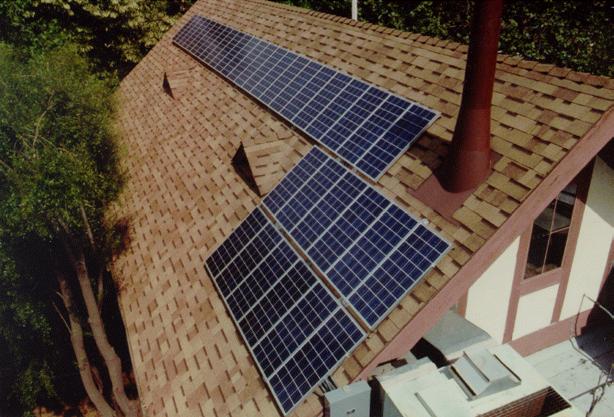
25 RENEWABLES PV FLAT PLATE
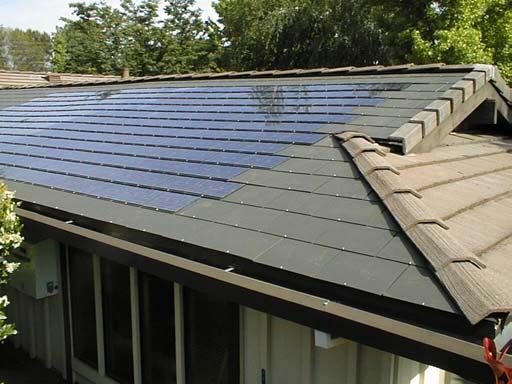
26 RENEWABLE ENERGY SMUD Solar Program 25 yrs = 11 MW; 125 MW Goal Next 10 yrs. New Homes = Solar Smart Builders include: Lennar Homes, Tim Lewis Communities, Homes by Towne, Centex Homes, DR Horton and Standard Pacific Homes. Combines energy efficiency with integrated PV Over 4,000 homes either approved or in the approval process

27 RENEWABLE ENERGY

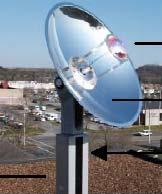
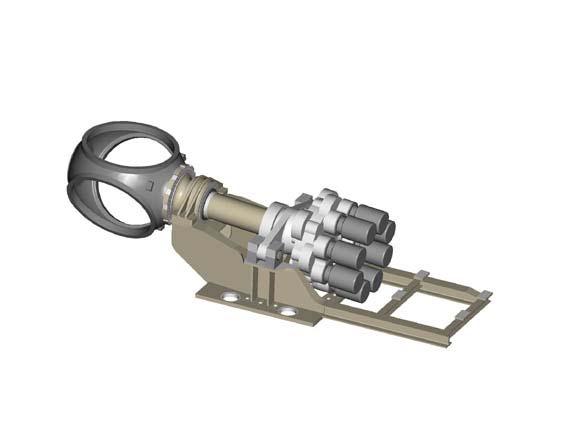
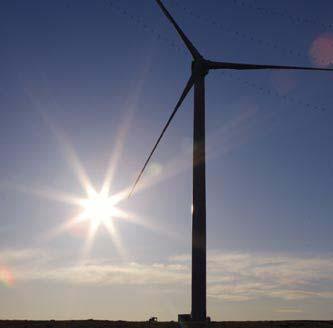
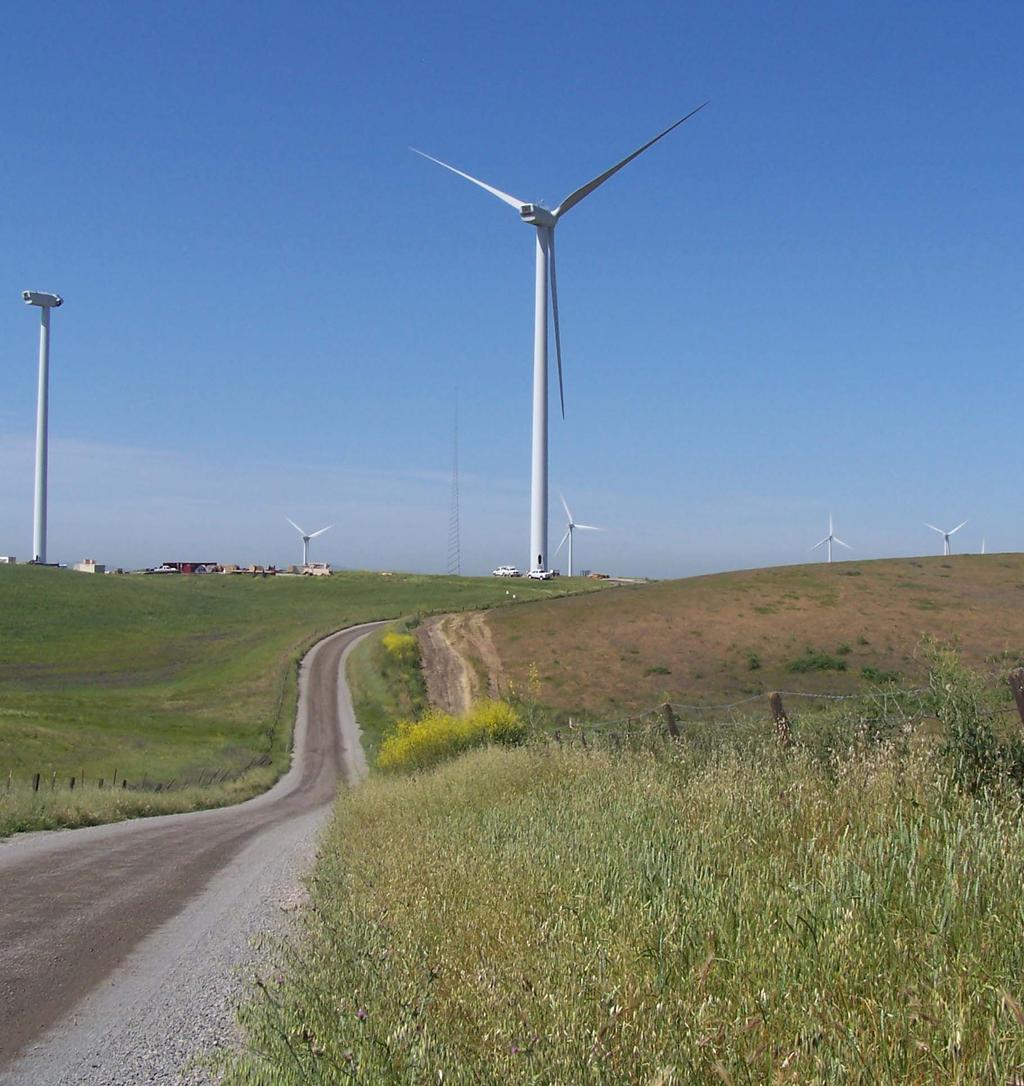
28 SMUD RENEWABLES SMUD-Owned Solano Wind Project
29
30 RENEWABLE ENERGY Solano 102 MW Build-Out Completed Land Purchase = another 128 MW by 2011 Preparing for Future Growth Wind Integration Study How much intermittency for a small control area? Operating impacts? Balancing generation costs? Evaluating New Wind Sites & Transmission

31 RENEWABLE ENERGY
32 RENEWABLE ENERGY SMUD Local Problem Wastes to Green Electricity Board Emphasizes Local Environmental Benefits Over Global Benefits SMUD Renewables in Service Territory = Solar and Biomass How Does Society Currently Dispose of Wastes? Can Local Problem Wastes be Converted to Electricity & Mitigate Problem? YES!!!
33 TARGETED LOCAL WASTES/PROBLEMS GhG Local AQ Water Qual. Odor Ot her Dairy Waste Grease Waste Food Waste Landfills Fuel-Loaded Forests


34 RENEWABLES ANAEROBIC DIGEST. RCM Covered Lagoon W. Sac. WWTP Dranco - OWS

35 RENEWABLES - DIGESTERS 2 Dairy Digesters in S. Sac in Next Year USDA, CEC, SMUD Providing Incentives Net Metered 1 Lagoon; 1 Complete Mix Digester Regulatory Issues
36 RENEWABLES - DIGESTERS Dairy Environmental Benefits Location of Dairy Number of Animals *Total VOC Reduction (Lbs/Year) **Methane Reduction (Tons/Year) CO2 Equivalent (Ton/Year) Elk Grove Galt #1 Galt #2 TOTAL 1,435 8, ,738 1,100 6, ,776 1,020 6, ,489 3,555 21, ,003 *Based on SMAQMD Title V Emissions estimate; VOC reduction from the dairy planning addition of food waste, is based on manure only. **Assuming the biogas produced contains 60% methane

37 RENEWABLES-GREASE WASTE Sac Regional Wastewater Plant Benefits of approach Existing excess capacity Technically proven with grease and food waste Existing permits Existing trained personnel Existing use for biogas at Carson Energy cogen Project status SMUD sponsored feasibility study in progress
38 RENEWABLES - GREASE WASTE Avg. Daily Gas Production 400, ,000 Cubic Feet of Gas 300, , , , ,000 50,000 Dig#1 Dig#2 - Mar 06 Apr 06 May 06 June 06 July 06 Month/yr City of Riverside Grease to Digester Tests

39 RENEWABLES-FOOD WASTE S.F. Food Collection Program SMUD/UCD Survey Leftovers to Lights Add to Sac RWTP Distributed Digesters Tollenaar Dairy Folsom Prison Demo