Cogeneration with District Heating and Cooling
|
|
|
- Beryl Dixon
- 5 years ago
- Views:
Transcription
1 Cogeneration with District Heating and Cooling Henri Safa CEA Nuclear Energy Division Scientific Direction H. Safa 1
 Total space heating and cooling demand 20000 TWh World District")
2 Energy and Heat Heat has always been an issue for mankind In 2008, the total world energy production amounted to Mtoe Approximately one third of it (4000 Mtoe) was used as heat. 50% of this heat was for residential homes, commercial businesses and public services (hospitals, schools, universities, offices) Total space heating and cooling demand TWh World District Heating and Cooling 2500 TWh The potential of DHC increase is very large H. Safa 2
3 Iceland Latvia Denmark Lithuania Estonia Poland Finland Sweden Slovakia Czech Republic Romania Austria Slovenia Germany Korea Croatia France Italy Norway District Heating 100% 90% 80% 70% 60% 50% 40% 30% 20% 10% 0% Percentage of citizens having access to district heating Source: Euroheat and Power, 2009 District Heating is developed in northern European countries H. Safa 3

4 District Heating Source: D. Magnusson, Linköping University, Sweden District Heating networks are expanding H. Safa 4

5 District Heating in large cities District Heating network in Paris is the largest in France: 2 x 440 km 5700 GWh 25% of total heating 8 production sites Source: CPCU at H. Safa 5


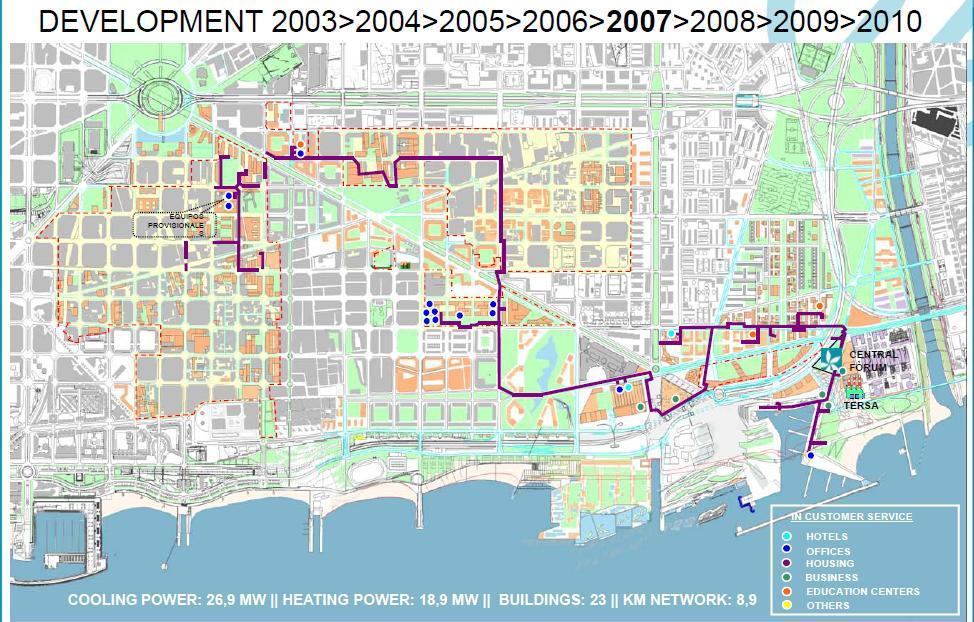
6 District Cooling City of Barcelona, Spain Source: R. Sagarra, District Cooling Workshop, May 2010 District Cooling networks in warm areas H. Safa 6
7 Recovery of Nuclear Heat Nuclear Power Plant Primary circuit Primary Pump Pressurizer Control Rod mechanism Steam Generator vapor liquid Secundary circuit Generator 1/3 of the fission energy is converted into electricity Reactor Core Vessel Reheat Water pump Condenser 2/3 of the fission energy is lost in heat H. Safa 7
8 Exergy Ambient temperature heat is of no use The Exergy concept allows to also valuate the temperature at which the heat is produced. E = H - T 0.S Exergy of a quantity of heat Q at a temperature T E = Q.(1 - T0 T ) T hot Case of 1300 MWe Nuclear Power Plant T cold Wp Qi W HP W BP W gross Qs h carnot ( C) ( C) (MW) (MW) (MW) (MW) (MWe) (MW) (%) (%) % 34.3% h H. Safa 8
9 Exergy: Electrical Efficiency h W W Q i W HP BP P = W BP on the Low Pressure Turbine decreases with increasing temperature Q out Q i W HP W BP T0 Eout = Qout.(1 - ) T The output exergy increases with increasing temperature H. Safa 9
10 Electric Efficiency h (%) Exergy: Electrical Efficiency Exergy (MW) 40% % % 25% 20% Efficiency Exergy % 10% 5% 0% Temperature ( C) Trade-off between electric output and Exergy H. Safa 10
11 Temperature ( C) Thermodynamics: The Rankine cycle A B C Boiling Expanding (1) Condensing D E Reheating G F Expanding (2) Entropy S (J/g/K) Modify the low pressure turbine: outlet at 2 bars H. Safa 11

12 Thermodynamics: The secondary circuit HP TURBINE STEAM STEAM GENERATOR REHEATER WATER LP TURBINE LP TURBINE SEPARATOR PUMP CONDENSER PRIMARY CIRCUIT Feedwater TANK COLD SOURCE HEAT EXCHANGER Switch between two low pressure turbines H. Safa 12


13 Nuclear Power Plant Nuclear District Heating Buildings Pressurizer Steam Generator vapor liquid Primarycircuit Secundary circuit District Heating Network Primary Pump Control Rod mechanism Generator Substation Reactor Core Vessel Water pump Reheat Condenser Hot Fluid Forward Return Pumping Station Pumping Station Connection to the Heat Network length ~ 150 km H. Safa 13 Main Transport Line
14 Example of Substations Source: Janne Lavanti, PÖYRY, Finland Oy Energy, May 2011 H. Safa 14


15 The Main Transport Line In a Tunnel (may be used as a common utility) Copenhagen District Heating Bore Tunnel, 2010 In a Trench H. Safa 15
 (T-T 0 ) < 120 W/m Total heat loss 2% of the transported power! H.")
16 The Main Transport Line: Thermal Losses soil pipe T e insulator T 0 Diameter Insulator thickness e Insulator conductivity < 0.04 W/m.K dq dz = 2 Ln (1 2e ) (T-T 0 ) < 120 W/m Total heat loss 2% of the transported power! H. Safa 16

17 The Main Transport Line: Hydraulics dh dz = C. 2 U 2 Diameter Water velocity U Water density Friction coefficient C Moody s Diagram for straight pipes H. Safa 17
18 Loviisa 3 Nuclear Power Plant Project in Finland Source: Harri Tuomisto, FORTUM, Finland, October 2010 H. Safa 18


19 Loviisa 3 Nuclear Power Plant Project in Finland Source: Harri Tuomisto, FORTUM, Finland, October 2010 H. Safa 19
20 The Main Transport Line : Pumping Power Pressure drop along the pipe 2 dh 8 P = C. 2 2 dz c T 2 p 5 Diameter Heat power P Loviisa 3 Nuclear Power Plant Project in Finland Source: N. Bergroth, Large-Scale Combined Heat and Power (CHP) Generation at Loviisa Nuclear Power Plant Unit 3, Proceedings of the 8th International Conference on Nuclear Option in Countries with Small and Medium Electricity Grids, Dubrovnik, Croatia, (16-20 May 2010) Install pumping stations every 20 km H. Safa 20

21 The Nogent-sur-Seine Power Plant Two 1300 MWe reactors with cooling towers H. Safa 21


22 The Main Transport Line: An example Nogent-sur-Seine Nuclear Power Plant Main Heat Transport Line 10 km H. Safa 22
23 Economics Two main parameters 1. The Temperature T of the fluid Electric Efficiency, Heat Losses 2. The Piping Size Pumping Power Assumptions: Operation time: 1/3 cogeneration, 2/3 electric Value of 1 MW thermal = 50% of 1 MW electric 2 lines of 1500 MW capacity each H. Safa 23
24 Electric or Thermal Energy (MW) Economics: Optimal Temperature Loss in Electric Energy Thermal Energy Delivered Global Energetic Balance Temperature ( C) A gain equivalent to 920 MWe (+70%) can be achieved!! H. Safa 24
25 Cost of Thermal Energy ( /MWh) Economics : Optimal Piping Size Average heat price (2008, exc. tax) Piping Diameter (mm) A target of 30 /MWh can be set for the recovered heat H. Safa 25
26 Main primary line parameters Main Transport Line Characteristics Transported heat power MW Total line length 150 km Forward Temperature 120 C Return Temperature 60 C Insulation Thermal Conductivity 0.05 W/m.K Insulation thickness 300 mm Piping size mm Max. pressure 20 bars Water flow 6.34 m 3 /s Total heat loss 32.3 MW Hydraulic pressure drop bar/km Total pumping power 43 MW Cost of delivered MWh 29.8 /MWh Single line should be doubled to get a capacity of 3000 MWth H. Safa 26
27 Economics: Balance Implementation on Nogent-sur-Seine reactor (1300 MWe) 150 km long main heat transport line Additional heat production of 9 TWh Gain of +540 M /year Reduction of electric production -1.8 TWhe Loss of -180 M /year Total gain of +360 M /year H. Safa 27
28 CO 2 emissions CO 2 emissions from district heating in Paris 60% fossil fuels (gas boilers, coal, oil) 40% waste incineration Average of 195 gco 2 /kwh Large reduction in CO 2 emissions Avoid 1.7 Million tons of CO 2 /year Huge savings in CO 2 emissions H. Safa 28
29 Conclusions The recovery of nuclear heat from present NPP is technically feasible The primary heat transport line can be designed with low thermal losses (a few percents) even for long distances (> 100 km) Heat recovery enhances the plant efficiency and provides a high energetic gain (+70%) The recovered heat is economically competitive Nuclear heat recovery allows large reduction in CO 2 emissions H. Safa 29
30 The Sustainable Nuclear Energy Technology Platform Strategic Energy Technology (SET) - plan Wind Nuclear Fission Solar Smart Grid SNE-TP Hydrogen CCS Bio-energy GenII/III Reactors GenII/III working Group Fast Neutron Reactors ESNII ESNII Task force Heat & Cogeneration Applications NC2I Nuclear Cogen working group Nuclear Cogeneration Industrial Initiative H. Safa 30
31 The NC2I Task Force Mission: NC2I TF shall comply with the SNETP mandate and shall launch a Nuclear Cogeneration Industrial Initiative (NC2I) and any other tools required for successful prototype project in the 2020 time frame Vision: The NC2I vision is to unlock and use the potential of nuclear cogeneration for considerable savings of fossil resources in the short to medium term NC2I shall thus develop, demonstrate and stimulate nuclear cogeneration systems compatible with large-scale industry applications and SET Plan targets Support cogeneration applications for all nuclear systems Extend cogeneration potential by accelerated HTR development Initiate prototype project(s) Possibly prepare/participate in international industrial initiative(s) Source: Sander De Groot, NRG, SNETP/NC2I, October 2011 H. Safa 31