7.0 RECOMMENDED INVESTMENT STRATEGY
|
|
|
- Horatio Mosley
- 5 years ago
- Views:
Transcription
1 7.0 RECOMMENDED INVESTMENT STRATEGY The Watsonville Junction to Downtown Santa Cruz to UCSC Campus Major Transportation Investment Strategy (MTIS) technical efforts have been completed. This chapter presents a summary re-definition of the challenges seeking to be solved and an assessment of the investment strategies performance of how they solve these challenges and meet the study goals and objectives set at the beginning of the study process. The chapter concludes with the consultant team s recommendations in terms of the recommended investment strategy to be pursued by the SCCRTC. 7.1 Summary of Problem Definition and Study Goals Working Paper Number 1, Study Goals and Objectives, Purpose and Need, and Evaluation Criteria (December 2, 1994) was the first identification of the transportation challenges and an identification of the study goals. Presented in this section is a summary of the transportation challenges and the adopted study goals. Appendix A presents a detailed list of the study goals. The initial identification of the transportation challenges was reinforced and clarified by the MTIS process along with the identification of an additional challenge. The existing and future transportation challenge in Santa Cruz County related to four (4) distinct, but somewhat interrelated challenges. Two of these challenges exist today and are anticipated to increase over time. The third challenge exists today at certain times and is forecasted to worsen over time. And the fourth challenge has to do with funding solutions to resolve the first three. In summary, the transportation challenges include: As shown in the Transportation Analysis report (Task 10), the projected increase in traffic for the Highway 1 corridor between Highway 17 and State Park Drive is projected to be operating at level-of-service (LOS) F during the peak periods by the year The projected volume is expected to exceed 170% of the available capacity -- thus concluding that by the year 2015, Santa Cruz residents will experience a 1 1/2 to 2 -- hour commute period operating at LOS E or worse (highly congested). Increased traffic congestion and spillover neighborhood parking impacts are projected as a result of the large number of weekend and beach-going users, so key to the local economy. As the population within the County and in surrounding counties continue to grow, along with the general growth in recreational travel, this problem will increase. The existing link between the Santa Cruz Community and the UCSC campus for both students and staff is a predominant transit link which is over capacity, resulting in standing room or crush loadings during peak periods on existing bus services. In addition, UCSC is in the process of increasing the student population from 10,000 to 15,000, which will force more students to live farther from campus and more students to take transit as the only viable (non-bicycle) mode. If this occurs, the transit overcrowding will only worsen. And finally, to overcome these transportation challenges, the financial analysis concludes that any major new transportation projects (either rail, bus or roadway Parsons Brinckerhoff 65 December 10, 1998
2 widening) cannot be funded for capital and/or operating & maintenance purposes without new local resources. The challenge in addressing these transportation issues in the Santa Cruz region is that they are the function of different travel markets -- peak commuters, student and staff travel, and weekend/recreational travel -- plus inadequate funding. In response to these challenges, three study goals were developed by working with the Rail Oversight Committee and reviewing the study goals with the public in the Spring of The three study goals were intended to generally guide the study process and are summarized as follows: Study Goal #1 -- Undertake a transportation planning analysis of the study corridor which is multimodal and intermodal. The objectives associated with this goal included focusing on alternate modes (as opposed to widening roads for single occupant vehicles); assessing investment strategies such as fixed guideways, busways, high occupancy vehicle lanes, and expanded bus transit; providing intermodal linkages for auto, bus, rail, bicycle, and pedestrian modes; as feasible, expanding linkages to regional corridors and other communities; and focusing linkages on meeting work, recreational, personal business, and transit-dependent trip needs. Study Goal #2 -- Undertake a transportation planning analysis which maximizes public input, recognizes the environmental sensitivity of the study corridor, is responsive to federal requirements, and presents information in understandable formats. The objectives associated with this goal included developing and implementing a public involvement program; assessing the effects of the investment strategies on the natural and human environment; a Peer Review assessments of the technical tools and studies; using graphic and visual elements to communicate; and remaining open and flexible on issues as they arise in the study process. Study Goal #3 -- Provide an analysis of the alternative strategies recognizing the need for the most efficient use of the limited financial resources. The objectives associated with this goal included assessing the capital and operating costs of each investment strategy; and assessing the cost effectiveness, operating efficiencies, and mobility improvements of each investment strategy studied. In addition to the three study goals, four evaluation goals were developed to assist in the evaluation of the investment strategies and lead to the selection of a Preferred Investment Strategy for the Santa Cruz region and the study corridor. The four evaluation goals are summarized as follows: Evaluation Goal #1 -- Provide a transportation system that is consistent with the needs and desires of the residents of the region and promotes the efficient use of land consistent with the planning policies contained in the various General Plans of the county. The objectives associated with this goal included developing strategies that support the economic and social vitality of neighborhoods and the community; reducing auto usage and increasing transit usage for residents and visitors; developing strategies consistent with the UCSC requirements; and developing strategies consistent with local and regional plans. Evaluation Goal #2 -- Develop a transportation system that is appropriate to the physical, cultural, and natural environment of Santa Cruz County. The objectives associated with this Parsons Brinckerhoff 66 December 10, 1998
3 goal included limiting impacts on parks, recreation areas, historic sites, and on cultural, biological and scenic resources; contributing to improved air quality in the region; reducing energy consumption; being sensitive to residential neighborhoods and commercial districts; limit noise and vibration effects on adjacent areas; limiting visual effects in sensitive areas. Evaluation Goal #3 -- Provide a well-integrated, efficient, and multimodal transportation system which meets the needs of all Santa Cruz County residents. The objectives associated with this goal included developing a strategy for serving intra-county and intercounty needs; developing a strategy that serves major activity centers, developing a strategy that minimizes vehicular delay, the number of single-occupant vehicles, and transit travel times; developing a strategy that best achieves the SCCRTC s goal of transit usage in the County; developing a system that is responsive to the mobility needs of all users in the community including the physically impaired and transit dependent; developing a strategy that is intermodal; and developing a strategy that allows for and anticipates future system expansions. Evaluation Goal #4 -- Provide a transportation strategy that represents the most efficient use of limited financial resources. The objectives associated with this goal included developing a strategy that balances the capital and operating costs with community benefits; and developing a strategy that addresses federal requirements. These seven goals have guided the study and are used in the evaluation process along with the definition of transportation challenges. 7.2 Evaluation of the Investment Strategies The investment strategies studied in the MTIS process were evaluated by the consultant team compared to the definition of transportation challenges and the study goals. Table 7-1 is a matrix which provides a summary of the relationship between the Study Goals and the eight investment strategies studied in the MTIS process. Table 7-2 provides a matrix summary of the definition of transportation challenges and the alternatives studied in the MTIS. Following this, Table 7-3 is a matrix which provides a summary of the relationship between the Evaluation Goals and the alternatives studied in the MTIS. Parsons Brinckerhoff 67 December 10, 1998
4 TABLE 7-1 MATRIX ANALYSIS OF THE STUDY GOALS AND THE INVESTMENT STRATEGIES Study Goal 1. Study alternatives that are multimodal and intermodal by design. 2. Maximize public input, recognize environmental sensitivity of the corridor, and is responsive to federal requirements. 3. Provide an analysis of the strategies and recognize the need to for efficient use of limited financial resources. Achieved? And Explanation Yes; The alternative investment strategies studied in the MTIS included a baseline or no build alternative, a roadway alternative that assessed widening Highway 1 for carpool lanes, a busway alternative, two bus transit expansion alternatives, and three rail-related alternatives. Yes; Public meetings (general public, neighborhood, Rail Oversight Committee, and special interest) to date number 47 and additional meetings will occur in the Fall of 1998; Task 11, Environmental Screening documents in detail the environmental effects of the proposed strategies; and the study process and tools have been reviewed by a Peer Review and the required federal analyses have been undertaken. Yes; The Task 12 Capital and Operating & Maintenance Costs document the costs of each strategy studied and the Task 13, Financial Analysis report documents the financial ability of the region to undertake each strategy with existing and/or new funding sources. As developed by the community and the Rail Oversight Committee, the investment strategies studied and the process undertaken in the MTIS have been responsive to the study goals set at the beginning of the MTIS process. Table 7-2 presents a matrix analysis of how the investment strategies respond to the problem definition that was identified early in the study process (Working Paper # 1, Study Goals and Objectives, Purpose and Need, and Evaluation Criteria (December 2, 1994) and clarified further based on the analyses conducted in the MTIS. Parsons Brinckerhoff 68 December 10, 1998
5 TABLE 7-2 MTIS Final Report/Selection of MATRIX ANALYSIS OF INVESTMENT STRATEGIES & PROBLEM DEFINITIONS Investment Strategy Reduces Hwy. 1 Congestion in 2015? Provides Direct Link to UCSC? Accommodates Weekend & Beach Traffic? Requires New Revenue Sources? 1- Baseline No Yes (buses go there now) No No 2 - TSM No Yes - Bus Access No Yes -- 1/4 Cent Sales Tax 3 - Widen Hwy. 1 for Carpool s Increases Capacity and Attracts More Trips; But Decreases Travel Time by 2-4 Minutes Yes - Bus Access No Yes -- More Than 1/2 Cent Sales Tax 4 - Rail from Watsonville to UCSC Campus No Reductions in Congestion vs Baseline Yes - Direct Rail Access Yes Yes -- More Than 1/2 Cent Sales Tax 5 - Rail from Watsonville to Harvey West & Natural Bridges No Reductions in Congestion vs Baseline No - Not Direct Link, Requires Bus Connection to UCSC Yes Yes -- More Than 1/2 Cent Sales Tax 6 - Busway from Park Avenue to Natural Bridges No Reductions in Congestion vs Baseline Yes; Buses Access UCSC via Local Streets Yes Yes -- 1/4 Cent Sales Tax to Implement 7 - Rail from Watsonville to Harvey West No Reductions in Congestion vs Baseline No - Not Direct Link, Requires Bus Connection to UCSC Yes Yes -- More Than 1/2 Cent Sales Tax 8 - Improved Bus System No Reductions in Congestion vs Baseline Yes - Buses Access UCSC via Local Streets Yes Yes -- 1/2 Cent Sales Tax As presented in Table 7-2, none of the build alternatives, as originally envisioned, will fully address the transportation challenges by themselves. Moreover, the resolution of the transportation challenges--either in part or fully--will require new sources of revenue to raise significant funding for construction and/or operation & maintenance of the proposed alternatives. The third evaluation of the MTIS investment strategies involved the Evaluation Goals as discussed previously. Table 7-3 presents a matrix analysis of the relationship between the Study Goals and the eight investment strategies studied in the MTIS process. This evaluation is based on the technical information presented to date (where noted) or a qualitative Parsons Brinckerhoff 69 December 10, 1998
6 Evaluation Matrix Table 7-3 Alternative Strategies Note: This matrix reflects the Consultant team evaluation of the alternative investment strategies studied in the MTIS as compared to the "Evaluation Goals" presented in Working Paper #1 and discussed in Section 7.1 of this document. 1 No Build/Baseline 2 TSM 3 Widen w/carpool Lanes 4 Rail to UCSC via the Pogonip 5 Rai l t o Harvey and West Nat u ral Bridges 6 Busway 7 Rail to Harvey West 8 Improved Bus Note: Source of information noted is from tables in this document unless noted otherwise. Assumes a ranking of "1" scores "poorest" and a ranking of "5" scores the "best" (unless none of the alternative strategies meet the objective noted). Goal #1 -- Consistency with Local/Regional Plans Supports Social/Economic Vitality of Communities and Region Qualitative;Intro of Rail & Rail at Nat Bridges Issues Reduces Auto Impacts & Increases Transit Opportunities # of Transit Trips (Table 4-2) and VMT (Table 4-5) Consistency with UCSC Plans Qualitative Assessment based on Task 11 Consistency with Local/Reg. Plans (1.4) Qualitative Assessment based on Task 11 Goal #2 -- System Appropriate for Santa Cruz Limit Impact on Parks, Recreation & Biological Resources Based on Task 11 Analysis & Summary Contributes to Improved Air Quality Based on Task 11,Table 4-15 AQ Analysis Reduces Energy Consumption Based on Task 11, Tables 4-17 & 4-18 Sensitive to Established Neighborhoods & Commercial Districts Qualitative Assessment based on Task 11 Limits Noise & Vibration Based on Task 11, 4-4 and Analysis Limits Visual Effects in Sensitive Areas Based on Task 11 Visual Analysis Goal #3 -- Integrated, Efficient, Multi-Modal System Serves Intra-County & Inter-County Travel Needs Qualitative Assessment based on Task 10 Serves Major Activity Centers Qualitative Assessment based on Tasks 8 & 10 Minimizes VHD, # of SOVs, and Transit Travel Times Based on Tables 4-5, 4-11, & 4-4 respectively Best Achieves SCCRTC's Stated Transit Goal Based on Table 4-2; None close to 10% Goal Serves the Transit Dependent, E&H & Intermodal Users Qualitative Assessment based on Tasks 8 & 10 Provides Intermodal Connections to Existing/Planned Facilities Qualitative Assessment based on Tasks 10 & 11 Allows For & Anticipates Future Expansion Qualitative Assessment based on Tasks 8 & 10 Goal #4 -- Most Efficient Use of Financial Resources Financially Feasible Based on Task 13 Analysis and Chapter 6 Cost Effectiveness, Mobility & Operating Efficiencies Based on Federal Analysis Parsons Brinckerhoff October 1,
7 assessment conducted by the Consultant (where noted) as applicable. This table is discussed later in this section. 7.3 Federal Transit Administration Evaluation Criteria The final evaluation consideration involved a review of the federal criteria for Fixed Guideway New Starts as required by the Federal Transit Administration (FTA). The criteria has developed over the past 15 years in response to an ever-increasing caseload of communities requesting discretionary federal moneys for fixed guideways (usually light rail, commuter rail, or busways). The Fixed Guideway New Starts Criteria must be developed for approval by the FTA to fund an initiation of Preliminary Engineering and preparation of an Environmental Impact Statement (PE/EIS) and, ultimately for a Full Funding grant Agreement (FFGA). An annual report is prepared by the FTA and submitted to Congress which identifies the FTA s recommendations for PE/EIS and/or FFGA s projects and these projects are subjected to the annual Appropriations process for funding. As there are more projects than available moneys, the FTA s Annual Report on Funding Levels and Allocations of Funds for Transit Major Capital Investments report (known as the 3j Report ) becomes a key report in the decision-making process. The 3j Report provides Congress with a comparison of criteria for most (not all) of the Transit Major Capital Investment projects nationwide proposed for federal funding. The most recent 3j Report identifies almost 50 major projects around the country. Most, but not all, of the projects provide the Cost per new Rider in the 3j Report plus additional information. It should be noted that there is both a technical process for receiving federal moneys and a political process. The efforts undertaken in the MTIS respond to the technical process and the technical requirements to move to the next phase of study (PE/EIS) and ultimately obtain an FFGA. If the Santa Cruz community so desires to move forward with a Transit Major Capital Investment using partial federal moneys, the criteria should be developed to the greatest extent possible and be the most favorable as technically feasible. The cost per new rider is a key FTA calculation that compares the annualized cost of a project to the new users that are attracted to that project. Table 7-4 presents the results of this calculation for each of the investment strategies tested in the MTIS. The calculation of the cost per new rider is completed using the annual operating costs plus the capital costs from the Task 12 report and applying industry - standard annualization factors to determine the annualized capital cost of each investment strategy. Following this, the average daily ridership for each investment strategy is taken from the Task 10 report and annualized to determine the annual projected ridership. The annualized costs and annualized riders for each investment strategy are then compared to the Baseline and the TSM strategies to determine the (additional annualized) cost per new rider. Table 7-4 presents this information. Parsons Brinckerhoff 71 December 10, 1998
8 TABLE 7-4 SUMMARY OF COSTS PER NEW RIDER BY ALTERNATIVE MTIS Final Report/Selection of Cost per New Rider Alternative Compared to Compared to TSM Baseline 1. Baseline N/A N/A 2. Transportation Systems $ N/A Management 3. Widen Highway 1 for $ $ Carpool/Bus Lanes 4. Rail Transit From Watsonville $ $ Transit Center to UCSC via Harvey West 5. Rail Transit From Watsonville $ $ Transit Center to Harvey West & Natural Bridges 6. Busway $ $ Rail Transit From Downtown $ $ Watsonville to Harvey West 8. Improved Bus Service $ $ Source: Parsons Brinckerhoff, Inc. 1998; FTA calculation methodology applied. As presented in Table 7-4, the range of total annualized costs for the investment strategies varies from a low of $5.6 million (Baseline) to a high of $31.9 million (Alternative 4, Rail to UCSC). The annual users range from 5.6 million to 7.4 million (Alternative 8, Improved Bus). As a result, the cost per new rider ranges from $25.72 (Alternative 8) to a high of $59.64 (Alternative 6, Busway) when compared to the Baseline strategy. When compared to the TSM strategy, the cost per rider ranges from $20.15 (Alternative 8, Improved Bus) to $72.98 (Alternative 6, Busway). The variance between strategies in cost per new rider is a function of more or less expensive strategies which carry more or less forecasted riders in the year It is important for the reader to understand that based on the investment strategies as presently defined, the cost per new rider for all of the strategies is well above the threshold that most (not all) federal transit projects meet to be considered for federal funding. According to the most recent 3j report, the cost per new rider for projects around the nation ranges from a high of $44.80 (for the New York City/Long Island Railroad East Side Access project) to a low of $2.40 (for the Memphis--Medical Center Light Rail Transit Extension). Most of the projects identified fall into the under $15 per new rider category; although some of the projects do not identify the cost per new rider. Re-definition of the investment strategies, such as developing a rail minimal operating segment, reducing the number of feeder busses, re-focusing the bus transit components to better serve the major activity centers, and/or shortening the length of the Carpool lane or busway, will affect the cost component of the calculation. Such re-definition would also affect transit/carpool ridership, and will change the cost per new rider calculation. It is impossible to state, at this time, whether these efforts would significantly alter the costs per rider shown in Table Overall Evaluation of the Performance of the Investment Strategies Parsons Brinckerhoff 72 December 10, 1998
9 An overall evaluation of the MTIS investment strategies studied is discussed in this section. Because of the similarities of some of the alternatives, they have been generally grouped into five categories -- Baseline/No-Build, Bus Transit Expansion, Road Widening, Busway, and Rail Services. For each of these categories, the consultant s summary assessment is provided Baseline/No-Build Alternative As defined in the MTIS process, the Baseline strategy would consist of a 10% reduction in transit services and the construction of already-programmed roadway projects. The benefits of this strategy include: The strategy is financially viable with existing revenues -- and, in fact, moneys appear to be available over the long-term which would not require the 10% reduction in transit services. The strategy (in the Consultant s opinion) has some environmental benefits in terms of not adding noise, vibration, visual effects or additional transit vehicles to existing and established neighborhoods and commercial centers. The strategy is the adopted local/regional plan. The drawbacks of this strategy include: The strategy solves none of the transportation challenges facing the region. Further, the strategy projects the poorest roadway operations in the year 2015 and projects that the transit mode share in the region will not even keep pace with the growth in population. As a result of the above, the strategy has negative environmental effects on regional air quality, the transit dependent and transit choice riders, and does not adequately provide for an alternate means of travel in the region. The consultant overall assessment of this strategy is that it does not meet the long-term mobility needs of the community and implementation of this strategy would be detrimental to the region Bus Transit Expansion Alternative As defined in the MTIS, the two Bus Transit Expansion alternatives (Alternative 2, TSM and Alternative 8, Improved Bus) would consist of increasing the number and buses and level of bus service in the community by approximately 50% and 100%, respectively. It is assumed in the analysis that the SCMTD will make a significant commitment to non diesel-powered transit vehicles (compressed natural gas is assumed for the MTIS) over time as buses are replaced. The benefits of these strategies include: The strategies contribute environmentally to the community by reducing air quality effects, energy consumption, limiting noise, vibration and visual impacts to more or less of a degree. The strategies are relatively consistent with regional and local plans in that bus transit is a focus of those plans. Parsons Brinckerhoff 73 December 10, 1998
10 The strategies are flexible and can be expanded over time. Overall, Alternative 8, Improved Bus performs the best of all the strategies in terms of capturing transit trips, decreasing vehicular usage, and increasing transit opportunities. Overall, Alternative 8 is the most cost-effective of the strategies studied. The drawbacks of this strategy include: The strategies require existing roadways to operate. Adding to or providing only a road-based transportation system means that the transit system will be affected by the forecasted severe congestion. This is putting all the eggs into one basket and the capacity roadway system is forecasted to deteriorate considerably as traffic congestion increases. The strategies, especially Alternative 8, are not financially feasible without new revenue sources such as a sales tax. Even with a 1/2-cent sales tax, Alternative 8 is not financially feasible. This is assumed to be a fatal flaw of that strategy. Alternative 2, TSM requires an additional 1/4-cent sales tax to be financially viable. The consultant overall assessment of these strategies is that while Alternative 8 clearly performs the best in terms of mobility improvements and cost-effectiveness, it is financially unfeasible given the funding assumptions made by the consultant team. Alternative 2, TSM does not perform as effectively in meeting the long-term mobility and travel needs of the region; however, it is more financially feasible and begins to address the transportation challenges of the region Roadway Widening for Carpool Lanes Alternative As defined in the MTIS, the roadway alternative assumed that an Carpool lane would be constructed between the Highway 17/Highway 1 interchange and east to State Park Drive. The Carpool lane would operate in the peak periods and would require two or more people per vehicle to be used. Buses would also use the Carpool lane. The benefits of these strategies include: This strategy provides the best interconnectivity of all the strategies tested as it expands the roadway system. The strategy is relatively cost-effective (partly because vehicle costs are borne by the user) as presently defined and based on Caltrans cost estimates reviewed by the Consultant, but not independently developed. The strategy provides a Carpool lane for buses to use in the corridor, which removes them from the most congested traffic lanes in the peak. The drawbacks of this strategy include: The strategy is not financially feasible without new revenue sources such as a sales tax. Moreover, even with a 1/2-cent sales tax the strategy (as defined) is not financially feasible. This is assumed (by the consultant) to be a fatal flaw of the strategy. The strategy does little to serve or enhance transit overall in the region. Parsons Brinckerhoff 74 December 10, 1998
11 The strategy has potential environmental impacts associated with community disruption, air quality, consistency with local and regional plans, and -- to a lesser extent -- potential noise, vibration, and visual effects. The consultant overall assessment of this strategy is that, as presently defined, the strategy is not financially feasible, does not agree with the policy orientation of the local transportation plans, and has the potential for environmental impacts. It is acknowledged that this strategy may be perceived to provide some relief to the roadway/freeway system and that some 89% of all the trips in the County are auto-oriented in the year Busway Alternative As presently defined in the MTIS, the busway alternative would consist of a new bus-only facility plus a bikeway constructed in the Santa Cruz Branch Line right-of-way between Natural Bridges and Park Avenue in Capitola. There would also be new bus services feeding into and operating in this alignment. The existing freight service would remain operating during the daytime hours. The benefits of these strategies include: The strategy is a step towards meeting three of the transportation challenges facing the region -- weekend/beach travel, link to UCSC, and Highway 1 congestion and is somewhat consistent with local and regional plans. The strategy provides an alternative east-west means of travel between UCSC and the mid-county area and uses a highly flexible vehicle (buses); the buses are removed from the forecasted congestion impacts on Highway 1 and the parallel arterial streets. The strategy provides opportunities for interconnectivity and longer-term expansion. The strategy is financially feasible with a 1/4-cent new sales tax and may be a project of greater interest to the Federal Transit Administration (FTA) to fund, thereby potentially increasing the federal commitment to the project. The drawbacks of this strategy include: The strategy is not financially feasible without a new a 1/4-cent sales tax (or other new revenue generator). As presently defined and tested, the strategy performed the least well in terms of transit usage, cost-effectiveness, and effect on the overall transportation system. The alternative has potential environmental impacts including impacts to biological resources, visual impacts, effects on established neighborhoods and commercial districts. The alternative adds more buses to the UCSC - serving roads. The strategy, as tested in the MTIS, has the lowest cost-effectiveness of all the alternatives. The consultant overall assessment of this strategy is that, as presently defined, the strategy is potentially financially feasible, generally agrees with the policy orientation of the local transportation plans, but has the potential for environmental impacts. It is acknowledged that this strategy, as tested, performed less effectively in terms of transit ridership and costeffectiveness. Parsons Brinckerhoff 75 December 10, 1998
12 7.4.5 Rail Transit Alternatives As defined in the MTIS, the three Rail Transit Alternatives (Alternative 4, Rail from Watsonville to UCSC, Alternative 5, Rail from Watsonville to Harvey West and Natural Bridges, and Alternative 7, Rail from Watsonville to Harvey West) would consist of the upgrade and reconstruction of the Santa Cruz Branch Line railroad and the provision of diesel-powered railcar vehicles. Alternative 4 would entail a customized vehicle that would be able to ascend the 20%+ grades from Harvey West to the UCSC Bookstore Plaza via the Pogonip area. The alternatives also include a bikepath in some of the rail right-of-way plus feeder buses in the corridor. The existing freight service would remain operating during the daytime hours. The benefits of these strategies include: Of all alternatives, only Alternative 4 responds directly to provide a new direct connection to the UCSC campus. The rail alternatives would provide an alternative means of travel along the east-west corridor and would be an alternative for serving the Beach/Weekend travel market plus (with Alternative 4) a direct and strong linkage to the UCSC campus. The rail alternatives perform moderately well in terms of capturing transit trips and reducing auto travel and transit travel times between major activity centers in the region. The rail alternatives are fairly consistent with local transportation plans in concept. The drawbacks of this strategy include: As presently defined, the strategies are not financially feasible without new revenue sources such as a sales tax. Moreover, even with a 1/2-cent sales tax the strategies as presently defined are not financially feasible. This is assumed (by the Consultant) to be a fatal flaw of the strategies. The strategies have potential environmental impacts associated with community disruption, air quality, noise, and visual effects along with potential effects on biological resources. The strategies have costs per new rider that are higher than most of the present new start projects on the FTA 3j report. The strategies are less flexible than the bus-oriented transit strategies. The consultant overall assessment of the rail strategies is that, as presently defined, the strategies are not financially feasible, and have a high cost per new rider. While the strategies provide an alternate east-west route in the community that is essentially insulated from the projected congestion, the strategies are fairly inflexible. The strategies generally agree with the policy orientation of the local transportation plans, but have the potential for environmental impacts. It is acknowledged that these strategies, as tested, performed better than the busway and less well than the bus transit strategies -- in terms of transit ridership and costeffectiveness. 7.5 Recommended Investment Strategy Parsons Brinckerhoff 76 December 10, 1998
13 The recommended investment strategy for the Watsonville-Downtown Santa Cruz-UCSC corridor is presented in this section. The recommended investment strategy takes into account the complexity of the challenge, the lack of adequate funding, and a conservative approach to implementing new systems. It also recognizes the present lack of public consensus towards a single alternative in the corridor, as well as the transit, bicycle, and pedestrian orientation of a large segment of the population. The recommended investment strategy proposes an approach of promoting both continuation of programmed improvements and a transit-based solution utilizing the UP Santa Cruz Branch Line right-of-way. While the recommended strategies will not solve the transportation challenges in the corridor on their own, they do provide an alternative corridor and an alternate means of mobility for Santa Cruz County residents and visitors and addresses many of the transportation challenges in the County. The recommended investment strategy for the Watsonville--Downtown Santa Cruz--UCSC corridor consists of the following elements: 1. Explore new funding mechanisms to provide a long-term and stable source of capital and operating & maintenance funding for transportation needs in Santa Cruz County. Several items must be stressed with regard to this strategy. First, irrespective of one s perspective on bus, roadway, or rail, it needs to be recognized that Santa Cruz County does not have the financial resources to build or operate any additional major transportation facilities to keep pace with the forecasted growth in travel between now and The County has two choices--implement an aggressive strategy to develop new revenue sources to generate funds that can be leveraged with local sources; or, alternatively rely on existing revenues that can only modestly slow the growth in travel congestion over time. Second, an additional sales tax is the best mechanism presently available to raise a significant level of new funds required for either the widening of Highway 1 or a rail or busway option on the Santa Cruz Branch Line. This is the best source of revenue because of the level of revenue that would be generated over the 17 year period. It should be recognized, however, that a sales tax increase would require voter approval. A onequarter cent increase would generate approximately $123.8 million, while a half-cent increase would produce nearly $247.7 million between FY 2003 and FY The continuation of the already programmed highway improvements including the Highway 1/Highway 17 interchange improvements, is also recommended. It needs to be acknowledged that a majority of trips in Santa Cruz County are auto-oriented and will continue to be into the future (absent a calamitous event affecting worldwide oil supplies or prices). Safety and operational improvements, as well as maintenance of the road system, has user and environmental benefits (less congestion and air pollution) for the region. Further, the Baseline Investment Strategy assumed a 10% reduction in bus transit service due to funding cutbacks and increasing costs. The region should strive to not have this occur and the cash flow analysis presented in Task 13, Financial Analysis Results and as summarized in Section 6.3 of this report suggests the cutback is not warranted due to a surplus of revenue to fund the Baseline strategy. Parsons Brinckerhoff 77 December 10, 1998
14 3. The key major transportation element recommended by the Consultant team is a two-phase approach which utilizes the Santa Cruz Branch Line and builds on increasing transit services as a long-term strategy to achieve an alternative route and means of travel. In Phase 1, the implementation of an Intercity Recreational (Weekend) Rail service (as described in the Task 15, Intercity Recreational Rail Service) is recommended. This would be followed in Phase 2 with the construction of a Busway between Natural Bridges in Santa Cruz and Park Avenue in Aptos as described in the Busway Investment Strategy (Alternative 6). Figure 7-1 illustrates the recommended investment strategy; Figure 7-2 provides a photo simulation of the Busway concept adjacent to Cliff Drive in Capitola. In the near-term (one to five years), the Intercity Recreational Rail service, as proposed, is a relatively low-cost opportunity Santa Cruz County can take advantage of without making a major long-term commitment to rail service in the corridor. The service could be implemented using existing funds (Proposition 116 funds and possibly other state funds) and would test market the viability of the service over the long-term. Such a service would begin to address the Weekend & Beach traffic challenge as well as provide an alternative means for residents to travel during the congested weekend. The service would also signal a near-term action supporting the joint Monterey and Santa Cruz County Around the Bay rail service. The SCCRTC has produced a Project Study Report (PSR) which details the operations, expenditures, and funding for this concept. If the service is deemed successful, it could be continued indefinitely--provided funding continued to be available. In the medium-term (six to 10 years), a busway is recommended for the Santa Cruz Branch Line corridor. The Busway concept with a routing from Park Avenue to Natural Bridges along the Santa Cruz Branch Line alignment provides the region with the following benefits: A flexible bus transit-based system that can be tailored to serve residential, employment and educational travel, as well as serve seasonal park facilities and changing peak weekend tourist needs. With a strong effort on marketing these services (including, but not limited to, maps, published and strict adherence to schedules, bikes on buses, etc.), the needs of residents, workers, students and visitors can be met among many of the destinations between Santa Cruz and at least Capitola. The busway escapes the congestion and event problems associated with Highway 1 which will become more predominant as traffic volumes grow over time. A service that, with direct bus routings to UCSC, can respond to the second challenge of serving the UCSC commuter and recognizes and responds to the anticipation that students will be forced to move to the east of Santa Cruz over time. The busway is less susceptible to the congestion and event problems associated with Highway 1. It should be noted that the bus connection to UCSC would be via Bay Street. Increased bus travel on Bay Street between California and Mission Streets may have an effect on the adjacent residential properties and may affect traffic patterns as well. Parsons Brinckerhoff 78 December 10, 1998
15 79

16
17 As tested in the MTIS, bus routings could also be extended to Watsonville and would provide a commuter/student alternative along the corridor from Watsonville to Cabrillo College to Downtown Santa Cruz to the UCSC campus. The busway can be utilized by SCMTD buses as alternative access to the proposed operations and maintenance facility in Natural Bridges. A key component of the busway concept is the development of a bikeway along the corridor between Natural Bridges and Park Avenue. The bikeway would also serve the commuter and recreational needs of the community. With the concept as defined in the MTIS, including a sophisticated freight train and bus signaling and control system, the freight service can be maintained in its present state and location. Design and environmental clearance for the Busway is an acceptable use of funds presently earmarked by the federal government for a Santa Cruz County fixed guideway project. Moreover, it is the Consultant s understanding that the Federal Transit Administration is attempting to identify busway opportunities to invest in. The development of the busway and the assumed use of compressed natural gas buses over the long-term would, in the Consultant s opinion, counterbalance many of the concerns raised about the rail investment strategies--including reduced noise, vibration, and emissions; safety concerns; inflexibility, the need for a freight window ; and with the bike lane, a multi-modal solution. On the downside, the busway would be more visually intrusive than doing nothing in the right-of-way and would require cuts and fills (some potentially significant ) within the corridor right-ofway. The Busway concept could be implemented with a 1/4-cent new sales tax and may be eligible for slightly greater federal participation due to an interest at FTA in busway projects. Utilizing a longer replacement cycle for buses could also assist the cash flow. If a 1/4-cent sales tax was dedicated to the busway with the attendant transit service improvements, it is conceivable that an additional 1/4-cent sales tax could be dedicated to other roadway and maintenance projects within the County. Thus, in our opinion, this scenario would address other pressing transportation needs in the region and possibly improve the chances of success in a public vote. It is noted that the recommended investment strategy, Busway, as presently defined performs less-well than the TSM (2) and Improved Bus (8) strategies for many of the Goals and Objectives as illustrated in Table 7-3 and for the FTA cost-effectiveness criteria. Furthermore, the busway has the highest cost per new rider as presented in Table 7-4. And finally, the UCSC linkage is served with additional buses and, at some point, road congestion will be a limiting factor. We are still recommending this strategy because we believe that the opportunity to have public use for transit and bicycles/pedestrians of another east-west corridor is a critical need for the long-term mobility of the region. Providing additional east-west capacity that is not dependent upon the existing congested freeway and arterial street system capacity is the value of the busway concept. Further, additional transit planning focusing more on Parsons Brinckerhoff 81 December 10, 1998
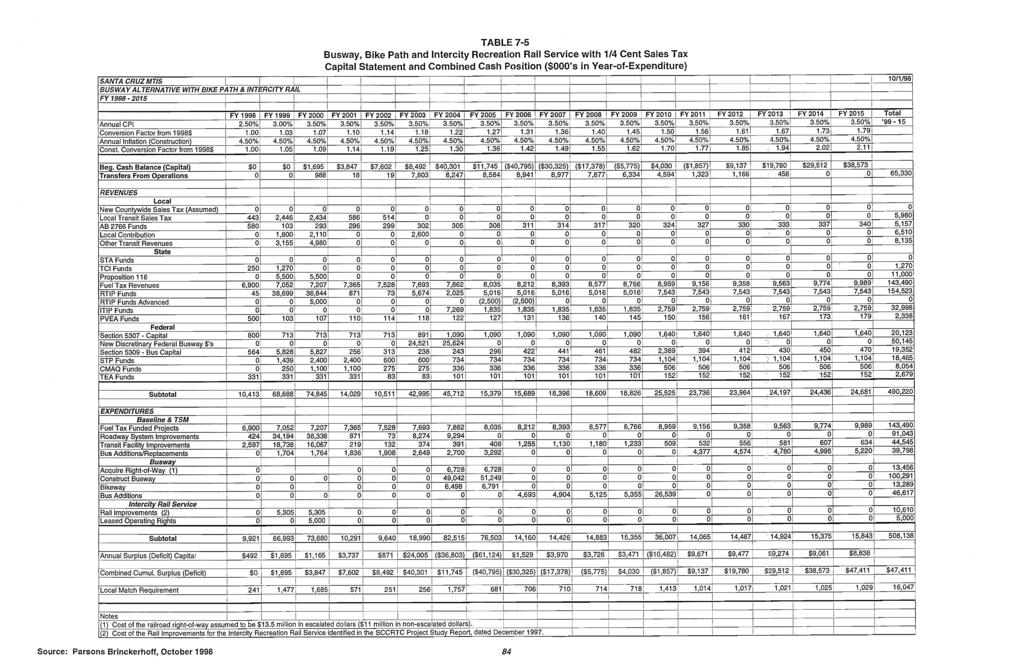
18 maximizing the use of the busway concept, possibly re-organizing the urban portion of the SCMTD bus system around the busway and providing a stronger linkage to downtown Santa Cruz and the UCSC campus (by interlining the routes) could result in increased annualized ridership. Thus, the cost per new rider indice could be lower. Given this and the previously stated reasons, we are recommending the Busway strategy to the community as a long-term mobility improvement strategy. In order to achieve the Busway concept, the following need to occur: Preliminary Engineering (PE), environmental documentation and clearance, and revisiting the MTIS key issues of: Model Enhancements to Reflect Santa Cruz Uniqueness Financial Feasibility and New Funding Sources; Station Location and Design; Engineering Design and Costs; Public Utilities Commission and Federal Railroad Administration Acceptance; and Public Acceptance; Purchase or lease and upgrade of the Santa Cruz Branch Line Construction Service Implementation Recommended Investment Strategy Cash Flow Analysis Table 7-5 presents the results of the cash flow analysis for a combined Intercity Recreational Rail (IRR), Busway, and Bikepath project with a new 1/4-cent sales tax plus a new 50% federal earmark for the Busway project. With a new 1/4-cent sales tax and the federal earmark, the County is forecasted to have a positive surplus of $47.4 million over the life of the analysis (year 2015). Again, these estimates are based on conservative forecasts of local, state, and federal funding levels. Greater federal participation and different phase-in or replacement cycles for transit vehicles could alter these forecasts in a positive manner. 7.6 Other Potential Strategies There are other potential investment strategies the Santa Cruz region could undertake to help meet the mobility needs long-term. While not recommended by the consultant team at this time, these strategies do have potential and, as such, are worth noting. 1. Santa Cruz County could explore the implications (financial, cost, environmental impact, and public acceptance) of a Minimal Operating Segment (MOS) rail concept. Because 80% of the rail boardings occur between UCSC and Capitola and because this is about one-third (1/3) of the length of the project evaluated in the MTIS (rail the entire distance between Santa Cruz and Watsonville), this strategy could be more cost effective. The strategy would be more affordable as the cost would be less than that studied in the MTIS. An MOS between Santa Cruz (and/or UCSC campus) and Capitola would provide an alternate route and means of travel in the most congested segment of the UCSC - Watsonville corridor. Further, this concept would serve the major beach/activity centers in the County. 2. As part of the Highway-based investment strategy (Alternative 3), Santa Cruz County could explore the feasibility and potential funding of a High Occupancy Toll (HOT) Lane Parsons Brinckerhoff 82 December 10, 1998
19 concept on Highway 1. The difference between this concept and the Carpool lane concept evaluated in the Alternative 3 Investment Strategy is that single-occupant vehicles can buy their way onto the lane--thus generating additional revenues for the project. This strategy is suggested because of the additional revenue tolls could generate, and the present strong interest in and availability of federal demonstration funds for HOT projects across the country. Moreover, the California Transportation Commission may be inclined to spend Interregional Funds for such a project if there is enough local support. With a potential federal match of up to 80%, the possibility of additional State funds, and toll-generated revenues, the financial feasibility of such a project increases significantly over the concept discussed in the MTIS Task 13, Financial Feasibility report. 7.7 Conclusion In conclusion, the MTIS developed eight investment strategies ranging from bus to rail to widening of Highway 1 based on public and decision-maker input and comments. The development of the travel forecasting model revealed areas where additional data would help to tailor travel forecast to the uniqueness of the Santa Cruz region and these are strongly recommended to occur with future model updates. The transportation forecasts revealed, as envisioned, that none of the investment strategies, alone, would meet the future travel needs of the community. The growth in population and employment, as well as growth in recreational and interregional travel, are expected to overwhelm the existing transportation system by the year 2015, resulting in significant increase in congestion and delay. When assessed at the environmental screening level of study, none of the proposed investment strategies were identified as having any fatal flaws --although there are expressed concerns about noise, vibration, other environmental concerns, and safety with both the roadway and rail strategies. And finally, the financial analysis revealed that a new form of revenue is required in Santa Cruz County to build, operate & maintain any major new transportation project to help address the forecasted travel needs. Parsons Brinckerhoff 83 December 10, 1998
20

21
22 As a result of the MTIS analysis, it is recommended that Santa Cruz consider the following implementation strategy: 1. Allocate $15.6 million for track upgrades and lease payments to Union Pacific to test market an Intercity Recreational (Weekend) Rail Service on the Santa Cruz Branch Line. Operating costs would total $1.1 million per year. 2. Move forward with the preliminary engineering and environmental clearance for a Busway to be built between Park Avenue and Natural Bridges in the Santa Cruz Branch Line right-of-way. 3. Continue to implement the already-programmed highway improvement projects including the Highway 1/Highway 17 interchange reconstruction and the Mission Street improvements. 4. Pursue a 1/2-cent new sales tax dedicated to transportation and utilize 50% to 60% for the busway and additional buses regionwide and the remainder for general roadway projects and road maintenance. It is recognized that the necessary funding requires a public vote. If the funding is secured and the Busway comes to fruition, the region will make strides to maintain its present level of mobility. If not, the County will experience varying levels of travel degradation, congestion, and delay--especially during the peak travel periods. Parsons Brinckerhoff 86 December 10, 1998
23 APPENDIX A STUDY GOALS AND OBJECTIVES
24 Appendix A Study Goals and Objectives Study Process Goals Study Process Goal No. 1 - Undertake a transportation planning analysis in the study corridor which is multimodal and intermodal. Objectives Focus on alternatives to the private automobile and, in particular, alternatives to the singleoccupant vehicle. Consider in the assessment of alternative strategies such options as fixed guideway, busways, Carpool lanes, expanded bus, transit services, and other modes as deemed relevant to local needs. Provide for intermodal opportunities including auto, bus transit, rail, bicycle and walking. Recognize and expand upon the rail linkages to the Highway 17 corridor, to Monterey, Salinas, and Gilroy, and to the Bay Area. Recognize and expand upon the linkages for primary work-related trips, recreational trips, and personal and transit-dependent trips. Study Process Goal No. 2 - Undertake a transportation planning analysis which maximizes public input, recognizes the environmental sensitivity of the study corridor, is responsive to federal requirements, and presents information in understandable formats. Objectives Develop and implement a public involvement program which consists of general, neighborhood, and special interest meetings, brochures, newsletters and other mechanisms. Recognize the unique environmental systems within the study corridor which are both natural and human-made and respect their needs during the process. Develop the necessary technical tools and analyses and undertake a Peer Review to ensure the consistency with federal requirements. Maximize the use of graphic and visual elements to communicate concepts. Remain open and flexible to study-related issues as they arise and work to incorporate them in to the process. Study Process Goal No. 3 - Provide an analysis of the alternatives strategies recognizing the need for the most efficient use of limited financial resources. Objectives Assess the capital and operating costs of the transportation strategy. Assess the cost effectiveness, operating efficiencies, and mobility improvements for the transportation strategy. Evaluation Goal No. 1 - Provide a transportation system that is consistent with the needs and desires of the residents of the region and promotes the efficient use of land consistent with the planning policies contained in the various General Plans of the county. Parsons Brinckerhoff A-1 December 10, 1998