DATA COLLECTION AND MANAGEMENT
|
|
|
- Elijah Cooper
- 5 years ago
- Views:
Transcription
1 ADOPT-A-RIVER INITIATIVE, Training of Trainers Workshop, National Museums of Kenya, 7 th July DATA COLLECTION AND MANAGEMENT Bonface Nduma, Vice President, WSCSD - Kenya
 in the river and is based on the sensitivity of the various animals to water quality.")

2 o This is a simplified version of the South African Scoring System (SASS), an aquatic bio-monitoring tool that has been used in South Africa for over 30 years. o It uses the composition of macro-invertebrates (small animals) in the river and is based on the sensitivity of the various animals to water quality. These animals are organized into groups, with each group having a specific sensitivity score. o The low cost, low technology environmental education tool was developed by reducing the 90+ traditional SASS aquatic macro-invertebrate classes that are used to derive river health classes into 13 simple groups. This promotes simpler understanding and identification to produce citizen science data.
3 o The toolkit itself consists of, among other things a simple net and a site information sheet to record samples found in the river and to give ecological information about the site. o High scores indicate high sensitivity to pollution and low scores indicate high tolerance of pollution. A quantitative score of the system is translated into health categories ranging from Natural to Seriously Modified. o Support tools, such as field guides and the dichotomous key, assist identification and understanding of the bugs and worms found in the water and form part of the minisass tool kit.
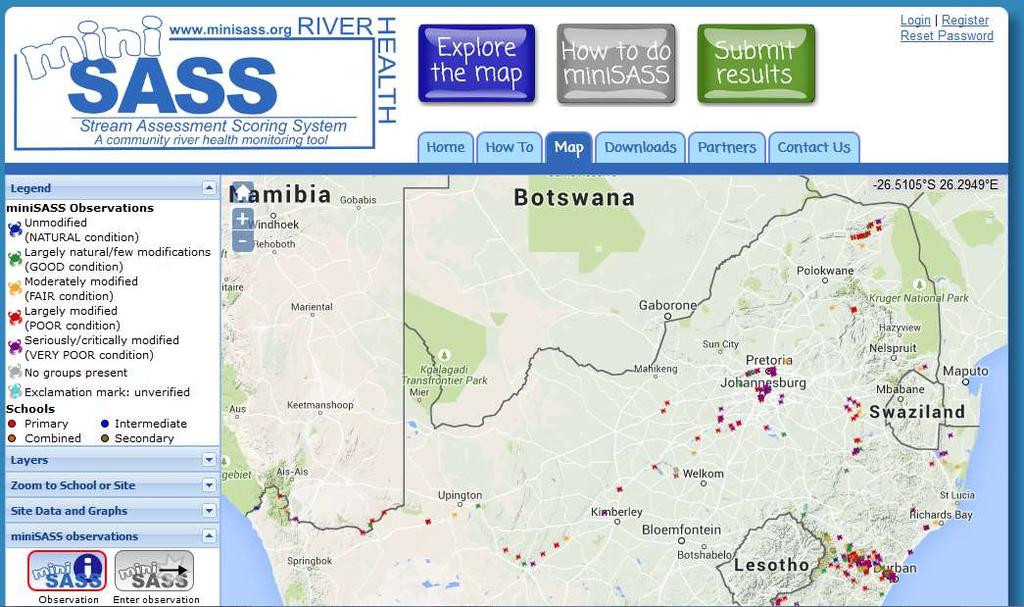
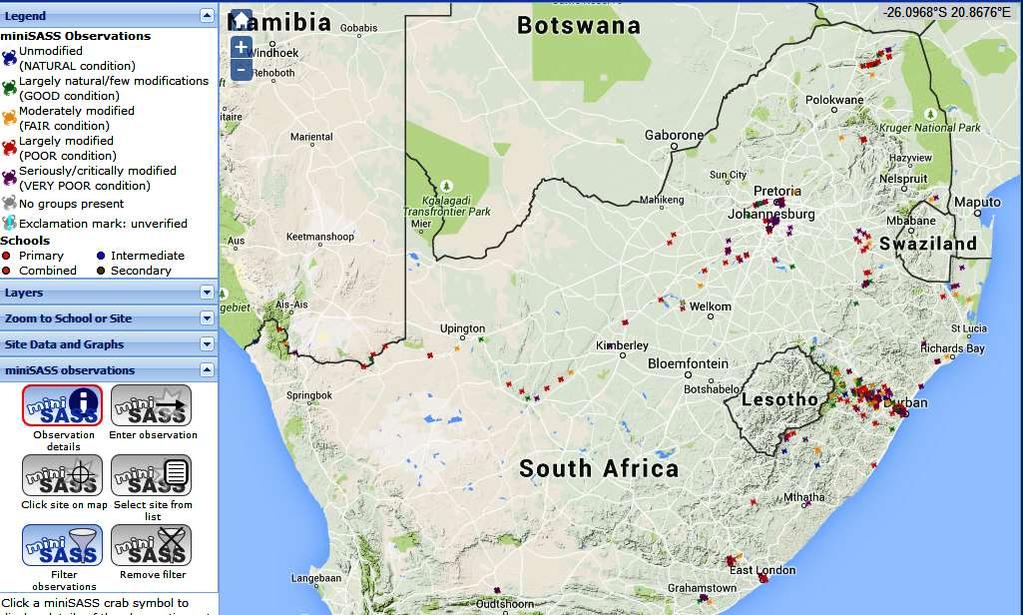
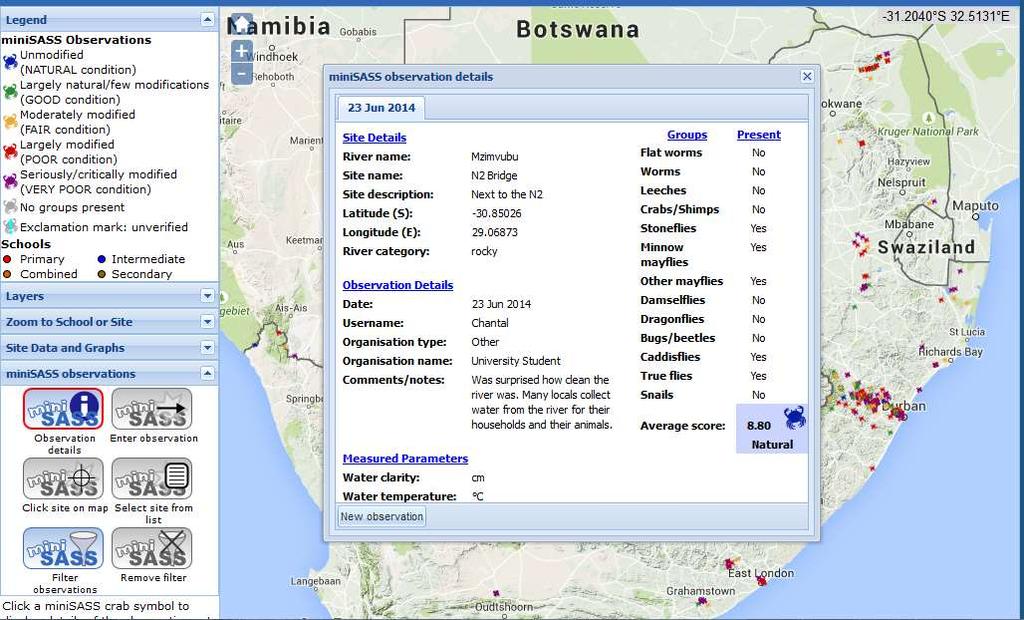
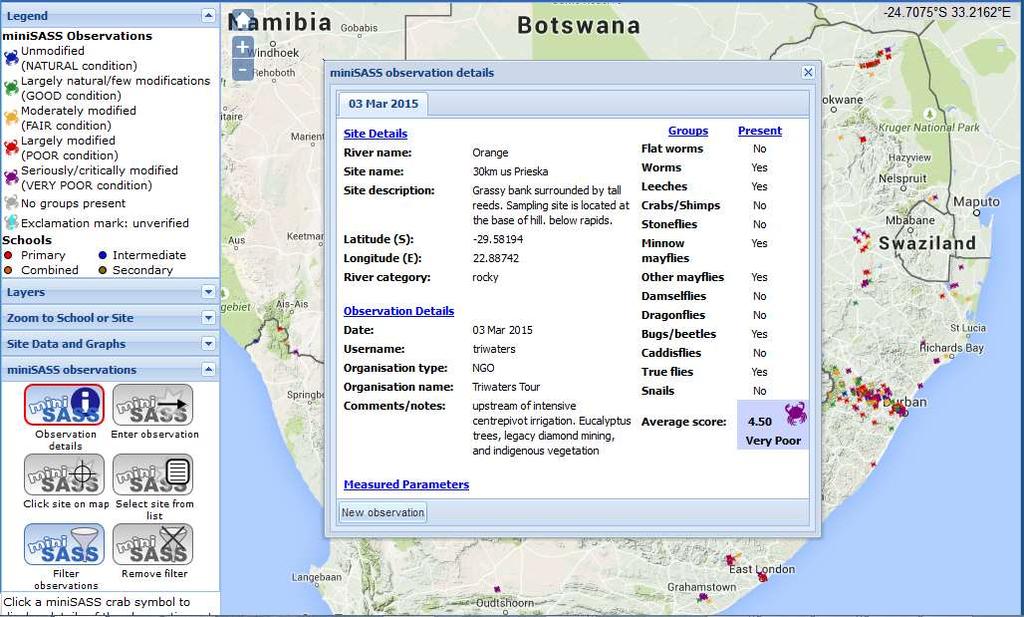
4 o minisass currently boosts a website, the most important feature of which is the Interactive Google Earth Map and database. The interactive map allows minisass users of all ages to explore their catchment, find their river and then upload their own minisass results. o This way, a public-access, interactive map of river health across a region or country can be developed, with results continuously contributed by users as citizen science. o Users can also explore all results, compare and contrast river health across catchments and in relation to land use activities, while connecting with others who are sampling rivers in their community.
5 minisas 1. S? It is low cost, low technology 2. Its simple and reliable 3. Its user-friendly to non-experts 4. It s very effective in promoting the level of understanding on the importance of river health and of the overall environment amongst learners. 5. Its an effective way of ensuring that the next generation of consumers, river health monitors and potential polluters, and the next generation of leaders have a greater appreciation and understanding of aquatic ecosystems. 6. The interactive nature of the Google Earth based minisass map promotes independent learning and information sharing among users/learners
6
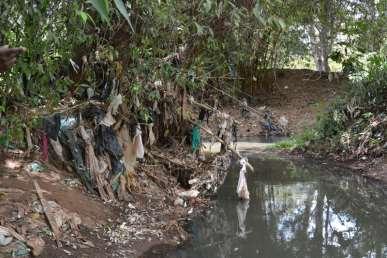
7 MiniSASS provides eyes and ears on the ground in terms of identifying water quality problems and raising red flags

8 o These are animals with no backbone and can be seen with the naked eye o Aquatic macro-invertebrates have different levels of sensitivity to change in the water conditions. o The more sensitive ones tend to either die or migrate when changes in the water conditions occur. Examples; Stone flies, Caddis flies and Mayflies. o Others are more resilient and can withstand negative changes in the water conditions and thus will be found even in streams and rivers that have poor water quality. Examples; snails, flat worms and true flies.
9 Why macroinvertebrates? 1. Different macroinvertebrates have different sensitivities to pollution. The higher their score, the more sensitive they are. 2. They are generally easy to collect and identify. 3. They are relatively sedentary which allows the source of pollution to be detected. 4. They integrate the water quality conditions at a site, providing an overall measure of the health of a river. 5. They can provide a picture of the historical water quality at a site.
10 Macro-invertebrate groups used in minisass? Flatworms, Leeches, Worms, Snails, Crabs and Shrimps, Stoneflies, Caddisflies, Damselflies, Dragonflies, Bugs and Beetles, Minnow Mayflies, Other mayflies and True flies.
, and when sampling,")
 o The two rivers score differently under the Ecological Category Table, due to the")
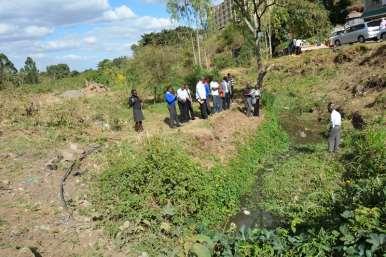
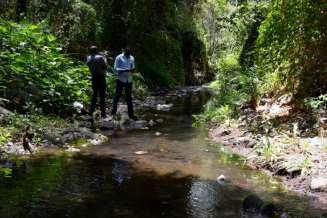
11 o Only 2 river types are recognized in minisass score interpretation i.e. Rocky and Sandy types. o On the other hand, each river type may have 3 biological habitat types (biotopes), and when sampling, macro-invertebrates should be searched within all the 3 biotopes; 1. Vegetation 2. Rock 3. Gravel/ Sand/Mud(GSM) o The two rivers score differently under the Ecological Category Table, due to the different variety of habitats available.
12 i. Disturb the stones, vegetation, sand e.t.c. with your feet or hands while holding the net in the current ii. You can also lift stones out of the current and pick insects off gently with your fingers or forceps iii. Do this for about 5 minutes while ranging across the river to different habitats (biotopes) iv. Rinse the net and turn the contents into a plastic tray v. Identify each group using the identification guide (chat showing different organisms inhabiting water bodies) given prior to the exercise. This can be used in combination with the dichotomous key.
13 vi. Mark the identified insects off on the identification guide vii. Fill in the site information (Table 1) and add up the sensitivity scores to determine the average score on the scoring sheet (Table 2). To get the average sensitivity score from a sampling point, the sensitivity scores of the identified groups are summed up. The total sensitivity score is then divided by the number of groups identified. viii. Wash hands when done
14 Table 1: Site Information Date (dd/mm/yr) Table Site Information Table Collectors Name Rivers Name Site description GPS co-ordinate * S E Comments/notes * Coordinates as Longitudes/Latitudes OR as decimal degrees
15 Table 2: Scoring Sheet Groups Sensitivity score Flat worms 3 Worms 2 Leeches 2 Crabs or shrimps 6 Stoneflies 17 Minnow mayflies 5 Other mayflies 11 Damselflies 4 Dragonflies 6 Bugs or beetles 5 Caddisflies (cased & uncased) 9 True flies 2 Snails 4 Total score Number of groups Average score NB: Average Score = Total Score Number of groups


16 o An ideal sampling site has rocky, sandy and vegetation habitats. However, not all habitats are present at any one given site. If a river lacks rocky habitats, the sandy type category is used to interpret the scores instead. o Based on the average score obtained for the sampled site, its health can be determined. As indicated in Table 3 above, the higher the score, the healthier the site. o Lastly, the groups will identify or suggest probable threats (physical, social or economic) to the river health and propose intervention measures.
17 Table 3: minisass Score Interpretation River category Ecological category (condition) Sandy Type Rocky Type Unmodified (NATURAL condition) Largely natural/few modifications (GOOD condition) Moderately modified (FAIR condition) Largely modified (POOR condition) Seriously/critically modified (VERY POOR condition) > 6.9 > to to to to to to 6.1 < 4.3 < 5.1
18 o Data Management The summarised data will be verified by the teacher or supervisor at school or community group leader and once deemed satisfactory send a copy to NEMA. o The results will be uploaded on minisass. The platform can tell the health of a river by indicating a clean river (good condition) as a green frog and a polluted one (bad condition) as a red frog. This map will be available to everyone.


19 Useful Links minisass: GroundTruth:
20
21
22

23
24
25 THANK YOU