The Effects of Hurricane Harvey on the US Winter Propane Outlook
|
|
|
- Morris Norton
- 5 years ago
- Views:
Transcription

1 Prepared for the National Propane Gas Association 217 Fall Board of Directors Meeting The Effects of Hurricane Harvey on the US Winter Propane Outlook October 1, 217 August, 216 Debnil Chowdhury, Director, IHS US NGL Research and Consulting Lead


2 2 About IHS Markit IHS Markit thinks about the world in a distinct way. We have the deepest source of information, analytics and solutions for the world s major industries, financial markets and governments. Our analytics and experts reveal interdependencies across complex industries to truly understand why things happen. By seeing the big picture and all the connections, we provide our customers with insights and perspective on what really matters. We call this The New Intelligence. By connecting data across variables, our analysts and industry specialists present our clients with a richer, highly integrated view of their world. That is the exponential benefit of The New Intelligence. We re able to isolate cause and effect, risk and opportunity in ways that empower our clients to make well-informed decisions with greater confidence. We partner with leaders in business, finance, and government so they can apply higherlevel thinking to daily tasks and strategic issues. We offer our clients solutions to make them more efficient and help them make more informed decisions to secure their future.
3 Key Propane Topics for Fall 217 Introduction Hurricane Harvey s Effects on the US Winter Propane Outlook Inventories: Where we are thus far this winter Supply: OPEC and crude prices, implications to US propane Res/Com Demand: Weather correlations to propane demand Chemical Demand: High prices leading to lower demand Exports: Why is the industry investing in propane exports? Projections of regional propane inventories Propane Price Forecast Conclusions 3

4 EIA Regions and Sub-Regions 4
5 Where are we today? Inventory: Inventory on a days of supply basis is lower to start the winter that the polar vortex winter of Initially, the market hoped that the hurricane would shut down export terminal capacity to allow inventory to grow in time for the winter. This happened for a week, but has now led to higher exports than originally expected due to Asian concerns of US supply Supply: Propane from gas plant production has started to grow as US crude and gas production recovers. The hurricane had a temporary impact (approximately less than two weeks) on supply in Mont Belvieu and the Permian. Demand: Residential/Commercial demand was low last year due to the warmer winter. We saw inventory draw down quickly anyways because of higher exports. We are modeling a normal winter in our current forecast Chemical demand Ethane has been as a feedstock as propane prices have been strong, putting pressure on chemical demand. The hurricane had a large effect on chemical demand of propane as crackers were shut down. Additionally, new ethane crackers under construction were heavily impacted by the storm leading to lower ethane prices temporarily. This may cause ethane to be favored over propane longer than forecasts prior to the storm. Agricultural demand is not expected to be strong this harvest season as soil moisture levels are at low levels Exports initially, the hurricane impacted export capacity allowing inventory to grow for a week. However, the hurricane increased the economic incentive to export to Asia and September exports are much higher now than originally expected prior to the hurricane. Prices: Prices versus crude have been one of the strongest years in recent memory. We expect propane prices in the US to face some pressure (in a ratio to crude basis) as supply recovers over the next several years. 5
6 6 How did Hurricane Harvey Impact the Trend Report Forecast? The latest September trend report shows lower inventory levels for the winter than the August report completed before Hurricane Harvey. Gas plant propane production was impacted by the hurricane leading to less supply making its way to Mont Belvieu inventory for approximately 1 week after the hurricane Refinery supply of propane was also impacted for almost one month Gulf coast export capacity was down for approximately 1 to 2 weeks after the hurricane Demand from propane crackers and PDH units was impacted by the storm for almost a month

7 Propane gas plant, fractionation, and storage capacity was impacted by Hurricane Harvey 7
8 BPD 8 Approximately 5, barrels per day of Texas gulf coast and inland propane production was brought down by Hurricane Harvey Propane production Texas Gulf Coast and Texas Inland /1/217 8/8/217 8/15/217 8/22/217 8/29/217 9/5/217 9/12/217 Source: IHS Markit Texas Gulf Coast Texas Inland 217 IHS Markit

9 Propane Prices Strengthened 9
10 8/1/217 8/3/217 8/5/217 8/7/217 8/9/217 8/11/217 8/13/217 8/15/217 8/17/217 8/19/217 8/21/217 8/23/217 8/25/217 8/27/217 8/29/217 8/31/217 9/2/217 9/4/217 9/6/217 9/8/217 9/1/217 9/12/217 9/14/217 9/16/217 9/18/217 Price $/ton differential $/ton 1 Harvey was the first Hurricane which had immediate pricing effects on NGLs outside of the US Japan and Mont Belvieu Propane Prices Source: IHS Markit Japan Propane Cargo Midpoint MtB Propane (NON-LST) midpoint Japan-Mont Belvieu differential 217 IHS Markit
11 BPD 11 Propane exports via the IHS Waterborne Report Propane Exports 1,2, 1,1, 1,, 9, 8, 7, 6, 5, Jan-17 Feb-17 Mar-17 Apr-17 May-17 Jun-17 Jul-17 Aug-17 Sep-17 Oct-17 Nov-17 Dec-17 Propane Exports Pre Hurricane Propane Exports Post Hurricane Source: IHS Markit 217 IHS Markit
12 BPD 12 Propane chemical demand via IHS Chemical North American Olefins Propane Chemical Demand 4, 38, 36, 34, 32, 3, 28, 26, 24, 22, 2, Jan-17 Mar-17 May-17 Jul-17 Sep-17 Nov-17 Jan-18 Mar-18 May-18 Jul-18 Sep-18 Nov-18 Propane Cracker Demand Pre Hurricane Propane Cracker Demand Post Hurricane Source: IHS Markit 217 IHS Markit
13 Days 13 Days of Implied Supply is now lower in the latest model versus the August pre-hurricane model Days of Implied Supply Jan-17 Feb-17 Mar-17 Apr-17 May-17 Jun-17 Jul-17 Aug-17 Sep-17 Oct-17 Nov-17 Dec-17 Propane Days of Supply Pre Hurricane Propane Days of Supply Post Hurricane Source: IHS Markit 217 IHS Markit
14 14 The temporary effects of Hurricane Harvey on demand and supply were not enough to overcome the effects of higher exports. IHS will perform the following if our forecast materializes and we face low days of supply Monitor exports and heating degree day values weekly. If major upward revisions are detected in weekly data, IHS modifies Trend Report model to determine if probability of critical days of supply is increasing. Communicate with key members of NPGA Propane and Supply Logistics Committee leadership if/when the need arises via and conference calls
15 Key Propane Topics for Fall 217 Introduction Hurricane Harvey s Effects on the US Winter Propane Outlook Inventories: Where we are thus far this winter Supply: OPEC and crude prices, implications to US propane Res/Com Demand: Weather correlations to propane demand Chemical Demand: High prices leading to lower demand Exports: Why is the industry investing in propane exports? Projections of regional propane inventories Propane Price Forecast Conclusions 15
16 16 The United States is starting the winter at low days of supply Beginning inventory September Inventory (thousand barrels) Implied Days of Supply (includes exports) United States Inventory for the fourth week of September (thousand barrels) ,741 13,264 79,56 75,584 78,4 67, , , , United States Days of Supply for the Fourth Week of September (Days) , , ,
17 EIA days of supply vs NPGA days of supply. Which is better correlated a tight market (high price)? 17
18 18 One Independent Variable Test Propane to WTI Ratio vs. Days of Implied Supply Level Propane to WTI Ratio vs. Days of Implied Supply Level Normal Critical Very Low Low High Very High Full Restricted Source: IHS Markit 217 IHS Markit
19 19 What is considered critical days of supply for the US? Rank Year Min Month Occurred Price movement? Feb Yes, large spike Feb Yes/elevated ratio Feb Yes, ratio rose Feb Yes, ratio elevated Feb No, ratio fell Feb Yes, large spike Mar ratio flat Mar ratio flat Dec Y, new terminal capacity Feb No, ratio fell Feb Feb Ratio fell Feb Ratio fell Y, ratio rose from Dec- Feb sharply. Terminal capacity


20 What is considered critical days of supply for the PADDs? 2
21 21 What is considered critical days of supply for the PADDs? Days of Supply Critical Inventory Level PADD 1 (Northeast) 8 PADD 2 (Central) 18 PADD 3 (Gulf Coast) 19 PADD 4 (Rockies) 12 PADD 5 (West Coast) 5 Total 19 Source: IHSMarkit, EIA

22 Build season started later than usual and draw season is starting earlier than usual due to exports 22
23 Days of demand are lowest in recent memory entering the winter 23

24 PADD I (East Coast) propane stocks are declining quickly 24

25 PADD II (Midwest) propane stocks are at normal levels but appear to be near peaks for the year 25
")
26 PADD III (Gulf Coast) stocks are starting winter at levels similar to last year (low) 26

27 PADDs IV (Rockies) and V (West Coast) propane stocks are high because of new storage capacity in PADD IV 27
28 Canadian propane inventories are starting the winter at high levels Cdn Propane Inventories gained another 2. million barrels in August Million barrels Jan-13 Jul-13 Jan-14 Jul-14 Jan-15 Jul-15 Jan-16 Jul-16 Jan-17 Jul-17 5 Year Range Canada Inventories Monthly 5-Yr Avg 28
29 Key Propane Topics for Fall 217 Introduction Hurricane Harvey s Effects on the US Winter Propane Outlook Inventories: Where we are thus far this winter Supply: OPEC and crude prices, implications to US propane Res/Com Demand: Weather correlations to propane demand Chemical Demand: High prices leading to lower demand Exports: Why is the industry investing in propane exports? Projections of regional propane inventories Propane Price Forecast Conclusions 29
30 3 Why is the crude oil market important for US propane? Most of the growth in propane production we have witnessed during the shale boom in the US is due to associated crude production The OPEC crude cut last year limited propane production in the Middle East and other OPEC member states. Because OPEC was not able to increase its crude (and propane) production, barrels available to be exported to Asia were limited. Japanese inventory reached critical levels, prices increased significantly there, and US traders exported from the US. Crude prices is still one of the most important factors in determining propane prices. US propane is being exported to Northeast Asia for both chemical and residential/commericial/and industrial demand. When crude prices are higher, naphtha prices are higher, lifting the cash cost ceiling on propane prices. Higher naphtha prices increases the economic benefit of running propane as a feedstock and demand increases in Asia and exports from the US increase to meet the demand.
31 Million metric tons 31 The US Propane industry needs to be aware of Japanese Inventory. If they are short, this may impact US Exports and US inventory as they have a minimum inventory requirement Japanese Propane Inventory Jan-13 Jul-13 Jan-14 Jul-14 Jan-15 Jul-15 Jan-16 Jul-16 Jan-17 Jul-17 Jan-18 Jul-18 Propane end-of-month stock Source: IHS, Japan LP gas association 217 IHS Markit
32 Thousand metric tons 32 Middle east propane exports fell sharply last winter due to the OPEC crude production cuts Middle East Propane Exports 2, 1,8 1,6 1,4 1,2 1, Jan-13 Jul-13 Jan-14 Jul-14 Jan-15 Jul-15 Jan-16 Jul-16 Jan-17 Jul-17 Propane 3 per. Mov. Avg. (Propane) Source: IHS Waterborne LPG 217 IHS Markit
33 Million barrels per day 33 Libya/Nigeria and US gains have been offsetting OPEC-12 and Russia cuts Change in crude production since October Nigeria and Libya United States Rest of the world Russia October 216 is the baseline for OPEC production cuts. OPEC- 12 Oct-16 Nov-16 Dec-16 Jan-17 Feb-17 Mar-17 Apr-17 May-17 Jun-17 Jul-17 Aug-17 Source: IHS Markit 217 IHS Markit
34 Million barrels per day 34 OPEC-12 assumed to restrain output through end- 218, limiting production gains of broader group OPEC-14 monthly crude production outlook average 217 average 218 average Jan-16 May-16 Sep-16 Jan-17 May-17 Sep-17 Jan-18 May-18 Sep-18 Notes: Annual averages are MMb/d for 216; MMb/d for 217; and MMb/d for 218. Source: IHS Markit 217 IHS Markit
35 Million barrels per day MMb/d 1Q 14 2Q 14 3Q 14 4Q 14 1Q 15 2Q 15 3Q 15 4Q 15 1Q 16 2Q 16 3Q 16 4Q 16 1Q 17 2Q 17 3Q 17 4Q 17 1Q 18 2Q 18 3Q 18 4Q A production surplus may re-emerge in 1H 218 unless OPEC cuts deeper World oil (liquids) demand and production by quarter Outlook Source: IHS Markit Demand Production 217 IHS Markit Implied change in global liquids inventories Q 14 2Q 14 3Q 14 4Q 14 1Q 15 2Q 15 3Q 15 4Q 15 1Q 16 2Q 16 3Q 16 4Q 16 1Q 17 2Q 17 3Q 17 4Q 17 1Q 18 2Q 18 3Q 18 4Q 18 Notes: A positive number for implied change in global liquids inventories indicates an implied stock build. A negative number indicates an implied stock draw. Source: IHS Markit 217 IHS Markit
36 US crude production is expected to increase substantially over the next several months 36
37 Implications of higher crude prices to propane supply United States Gas Plant Production MBPD 1,6 1,4 1,2 1, J F M A M J J A S O N D Source: IHS, US Department of Energy. 216 IHS 37
38 Jan-13 Mar-13 May-13 Jul-13 Sep-13 Nov-13 Jan-14 Mar-14 May-14 Jul-14 Sep-14 Nov-14 Jan-15 Mar-15 May-15 Jul-15 Sep-15 Nov-15 Jan-16 Mar-16 May-16 Jul-16 Sep-16 Nov-16 Jan-17 Mar-17 May-17 Jul-17 Sep-17 Barrels per day U.S. Propane Supply comes from: Refining, Gas Processing, Imports, Existing Inventory US Propane Supply 2,, 1,8, 1,6, 1,4, 1,2, 1,, 8, 5% 39% 5% 32% 6, 4, 2, 56% 63% Gas Plant Supply Refinery Supply Total Imports 38
39 % Million b/d US refinery operations Record US throughput in month of August, keeping utilization just below 95% US refinery runs set a new record last month, averaging 17.2 MMb/d in August. > This was the fifth consecutive month where US refinery throughput was above 17 MMb/d. However, this came to an abrupt end as Hurricane Harvey inundated the Gulf Coast refining industry. > August throughput declined 467, b/d from July but was about 194, b/d higher than the same period last year. The month throughput trended closer to five-year average, roughly 647, b/d above five-year average in August as compared to 93, b/d in July. US refinery throughput year min/max Average 13 Jan Feb Mar Apr May Jun Jul Aug Sep Oct Nov Dec Source: IHS Markit, EIA. 217 IHS Markit > Though an weak September refinery throughput is expected, IHS Markit estimates that throughput will return to above 216 levels in October as affected Gulf Coast refineries returned to normal operations and other refineries defer previously scheduled turnarounds. US refinery utilization rate averaged 94.7% in August, down by about 2% from July but 1% higher than a year ago, as cracking margins rose to the highest in the recent years. > Utilization will trend lower along with throughput in anticipation of moderate seasonal maintenance activities and resumption of affected Gulf Coast refineries. US refinery utilization Jan Feb Mar Apr May Jun Jul Aug Sep Oct Nov Dec 5 Year Max-Min Average Source: IHS Markit, EIA 217 IHS Markit 39
40 Thousands of Barrels per day Propane Production from Refineries were depressed in 215 despite the strong runs. Production has recovered in 216 due to stronger propane prices and less internal burning of propane for power generation. US Propane Production from Refining Jan Feb Mar Apr May Jun Jul Aug Sep Oct Nov Dec 4
41 Jan-13 Mar-13 May-13 Jul-13 Sep-13 Nov-13 Jan-14 Mar-14 May-14 Jul-14 Sep-14 Nov-14 Jan-15 Mar-15 May-15 Jul-15 Sep-15 Nov-15 Jan-16 Mar-16 May-16 Jul-16 Sep-16 Nov-16 Jan-17 Mar-17 May-17 Jul-17 Sep-17 Nov-17 Barrels per day Imports of propane have come from Canada in and waterborne imports have not been necessary US Imports of propane by type 25, 2, 15, 1, 5, Canadian Imports Waterborne Imports 41
42 Key Propane Topics for Fall 217 Introduction Hurricane Harvey s Effects on the US Winter Propane Outlook Inventories: Where we are thus far this winter Supply: OPEC and crude prices, implications to US propane Res/Com Demand: Weather correlations to propane demand Chemical Demand: High prices leading to lower demand Exports: Why is the industry investing in propane exports? Projections of regional propane inventories Propane Price Forecast Conclusions 42

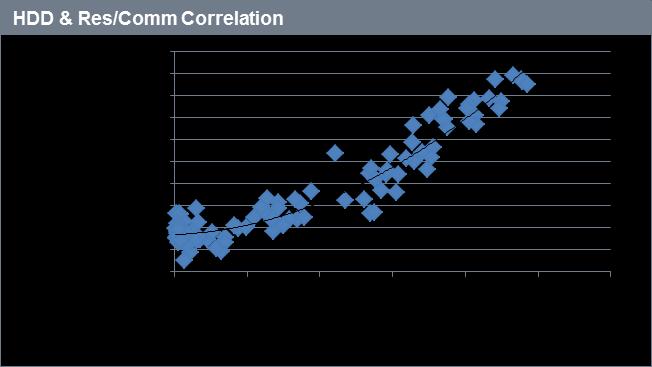
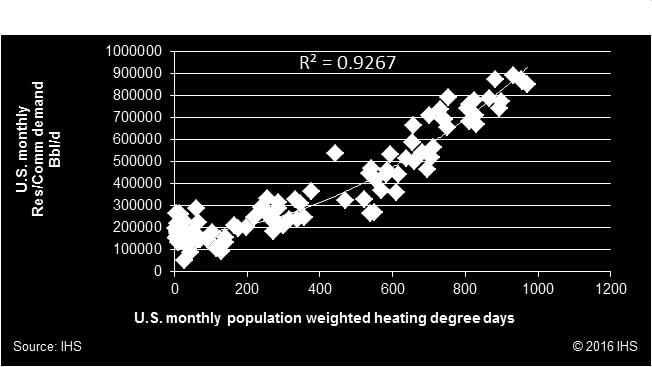
43 Heating degree day correlation to res com demand 43
44 Winter of is expected to be near average and cooler than last winter 4,5 4, 3,5 3, 2,5 2, 1,5 1, 5 Oct. March Heating Degree Days Actual Ten Year Average Est 44
45 Thousands bd US Propane Residential Commercial Demand is expected to be higher than last winter United States Propane Residential Commercial Demand Sep Oct Nov Dec Jan Feb Mar Apr 45
46 Thousands of Barrels per day Crop drying demand was relatively weak this past harvest season. We expect demand this season to be higher than last season US Agricultural Demand for Propane Jan Feb Mar Apr May Jun Jul Aug Sep Oct Nov Dec 46
47 Key Propane Topics for Fall 217 Introduction Hurricane Harvey s Effects on the US Winter Propane Outlook Inventories: Where we are thus far this winter Supply: OPEC and crude prices, implications to US propane Res/Com Demand: Weather correlations to propane demand Chemical Demand: High prices leading to lower demand Exports: Why is the industry investing in propane exports? Projections of regional propane inventories Propane Price Forecast Conclusions 47

48 US propane cracker demand has lost some market share to ethane 48
49 Jan-15 Mar-15 May-15 Jul-15 Sep-15 Nov-15 Jan-16 Mar-16 May-16 Jul-16 Sep-16 Nov-16 Jan-17 Mar-17 May-17 Jul-17 Sep-17 Nov-17 Jan-18 Mar-18 May-18 Jul-18 Sep-18 Nov-18 Barrels per day US Ethane Production via natural gas is expected to increase significantly as export ramp up over the next several quarters United States Ethane Ethane Production via Natural via natural Gas gas Production (barrels per day) 2,, 1,9, 1,8, 1,7, 1,6, 1,5, 1,4, 1,3, 1,2, 1,1, 1,, 49
50 Jan-15 Apr-15 Jul-15 Oct-15 Jan-16 Apr-16 Jul-16 Oct-16 Jan-17 Apr-17 Jul-17 Oct-17 Jan-18 Apr-18 Jul-18 Oct-18 barrels per day US Ethane Demand is expected to grow as new crackers are brought online United States Ethane Demand 1,7, 1,6, 1,5, 1,4, 1,3, 1,2, 1,1, 1,, 9, 8, 5
51 Jan-15 Apr-15 Jul-15 Oct-15 Jan-16 Apr-16 Jul-16 Oct-16 Jan-17 Apr-17 Jul-17 Oct-17 Jan-18 Apr-18 Jul-18 Oct-18 barrels per day US Ethane Exports are expected to ramp up over the next several months as Enterprise and Reliance commence operations United States Ethane Exports 35, 3, 25, 2, 15, 1, 5, 51
52 Thousand bd Days of Supply US Ethane Inventory has risen substantially to keep days of supply healthy ahead of future export and demand growth US Ethane Inventory US Ethane Days of Supply 11, 7 1, 65 9, 6 8, 55 7, 5 6, 45 5, 4 4, 35 3, 3 2, Source: IHS IHS year average 217 IHS 5 year average Source: IHS and EIA 52
53 Cents per lb 53 Ethane cash cost favorability fell when crude and LPG supply glut made propane cheap, but this has reversed USGC ethane and propane cash costs Ethane favored Propane mostly favored Jan-13 Jan-14 Jan-15 Jan-16 Jan-17 Jan-18 Ethane favored Ethane Propane Source: IHS Markit 217 IHS Markit Ethane became the cheapest cracker feedstock in April 213, and remained the cheapest feedstock through November 214 The plunge in global crude oil prices in 214 put downward pressure on refined products and LPG. Inadequate LPG export terminal capacity and a soft global propane market also contributed to very low LPG prices. Despite ethane rejection on a massive scale, LPG became so cheap that it pushed ethane out of the flexible crackers, and thereby kept ethane prices near thermal value Ethane has mostly regained its status as the preferred cracker feedstock. Crude oil price weakness and weaker propane prices challenge ethane s favorability over the short term but we expect ethane to be favored over the long term 53
54 Thousand bd 54 US propane cracker demand fell due to Hurricane Harvey US Propane Cracker Demand 45, 385, 365, 345, 325, 35, 285, 265, 245, 225, Source: IHS 216 IHS
55 Key Propane Topics for Fall 217 Introduction Hurricane Harvey s Effects on the US Winter Propane Outlook Inventories: Where we are thus far this winter Supply: OPEC and crude prices, implications to US propane Res/Com Demand: Weather correlations to propane demand Chemical Demand: High prices leading to lower demand Exports: Why is the industry investing in propane exports? Projections of regional propane inventories Propane Price Forecast Conclusions 55
56 Million metric tons per 56 Global LPG production growth is driven primarily driven by increases in US and the Middle East Global LPG production by major source Chart Title Source: IHS Markit Middle East gas US / Canada gas CIS gas Other gas China / India refinery Other refinery 217 IHS Markit Incremental waterborne exports are from gas-based sources
57 Million metric tonnes per 57 Global LPG consumption growth will continue to be led by Asia Global LPG demand by region Chart Title Asia / Pacific Middle East Europe / CIS Latin America US / Canada Africa Source: IHS Markit IHS Markit
58 Million metric tones per year 58 Residential / Commercial and chemicals will absorb most of the growth in LPG supply Global LPG demand by end-use 4 Chart Title Source: IHS Markit Res / Com Chemical Other Refinery Engine fuel Industrial 217 IHS Markit
59 Million metric tonnes per 59 Associated gas production in the US and Middle East will drive the increase in propane supply Global Propane production by major source 25 Chart Title 2 15 China / India refinery Middle East gas 1 CIS gas US / Canada gas 5 Other gas Other refinery 21 Source: IHS Markit IHS Markit Incremental waterborne exports are from gas-based sources
60 Million metric tons per year 6 Global propane demand growth will be led by Asia Global propane consumption by region Asia North America Middle East Europe Latin America CIS Africa Source: IHS Markit 217 IHS Markit
61 Million metric tons per year 61 Residential / Commercial propane demand is growing steadily but chemicals demand is growing faster Global propane demand by sector Source: IHS Energy Res/Com Chemical Other Industrial Engine fuel Manufactured gas Refinery 217 IHS Markit
62 Million barrels per day 62 US has become a major propane exporter US propane consumption and exports Exports Petrochemical feedstock Other Farm Utility gas Dehydrogenation Refinery propylene Ethylene Engine fuel Industrial Res/Com Source: IHS Markit 217 IHS Markit
63 Million metric tonnes per 63 Global butane production growth follows trends similar to propane, but overall volumes are lower due to content of US gas streams Global Butane production by major source 18 Chart Title China / India refinery Middle East gas CIS gas US / Canada gas Other gas Other refinery 2 21 Source: IHS Markit IHS Markit

64 Global butane demand growth will continue to be led by Asia and the Middle East 64
65 Million metric tones per year 65 Butane demand in the Residential / Commercial sector is expected to increase by more than 6% Global Butane demand by end-use Chart Title Other Refinery Chemical Engine fuel Industrial Res / Com Source: IHS Markit 217 IHS Markit
66 66 Dramatic increases in US exports have resulted in major changes in global LPG trade flows X X More Less Mostly Gone
67 Million metric tons 67 The US will remain the world s largest propane exporting country Global propane exports by major source Source: IHS Energy United States CIS Africa Middle East Oceania Southeast Asia China Europe Latin America Canada 217 IHS Markit
68 Million metric tons 68 Global propane surplus will move primarily to Asia Global propane imports by major destination Source: IHS Energy China Indian Sub. Oceania Southeast Asia Taiwan Korea Japan Middle East Africa CIS Europe Latin America Canada 217 IHS Markit
69 Million metric tons 69 US propane exports will move primarily to Northeast Asia (China) and Latin America United States propane exports by destination Source: IHS Energy China Europe Southeast Asia Taiwan Korea Japan Middle East Africa Latin America Canada 217 IHS Markit
70 Indonesia India Vietnam Philippines China Malaysia Japan Taiwan Thailand Singapore Australia S. Korea LPG demand 7 Demand profile varies significantly from one country to another LPG demand by sector 1% 8% 6% 4% 2% % Source: IHS Res / Com Chemical Engine Fuel Industrial Town Gas Other 217 IHS Markit
71 Kg per capita Kg per capita 71 Res/com sector drives the steady growth in base demand, with new markets continuing to emerge Per capita res/com consumption - India & Indonesia 3 Illustration of res/com LPG market penetration in Asia, Japan 2 4 Taiwan 15 3 S. Korea Thailand Indonesia 1 2 China 5 India Sri Lanka 1 Nepal Myanmar Bangladesh Indonesia India 217 IHS Markit Source: IHS 217 IHS

72 Chinese PDH projects drive the chemical demand growth of propane in Northeast Asia 72
73 Thousand metric tons per 73 Cracking demand shifted to PDH this summer in NEA NEA PDH and cracking demand PDH - Q2 PDH - Q3 Cracking - Q2 Cracking - Q Notes: Cracking demand mainly from Japan, S. Korea, and Taiwan Source: IHS Markit 217 IHS
74 Million metric tonnes Million metric tonnes 74 China: LPG supply China propane supply Refinery Natural gas processing Net imports Source: IHS Energy, IEA 217 IHS Markit China butane supply Refinery Natural gas processing Net imports Source: IHS Energy, IEA 217 IHS Markit Production of LPG in China is almost exclusively from refineries, as the country s current natural gas production is mostly too dry to require processing. China s main state-owned refiners, as well as independents, are increasing capacity in line with rising oil products demand so higher crude runs are expanding LPG production as well. However, propane demand is growing faster than supply leading to rising imports of propane. Though not at the same rate as propane, butane imports are also on the rise, due partly to increased demand for production of gasoline blend stocks. With production at 7.7 BCM in 216, China s shale gas has made steady progress over the last few years. However, its share in total domestic gas production is less than 6% in 216. BP and CNPC signed a PSC for shale gas development in the Sichuan Basin in March 216. However, both CBM and shale gas developments fall short of the government s 215 targets owing to geological difficulties as well as the lack of transparent legal frameworks, of a mature service sector, and of midstream access. IHS projects that shale gas production will reach only about 2 BCM by 22.
75 Million metric tonnes Million metric tonnes 75 China: LPG demand China propane consumption by sector Residential/Commercial Industrial Engine fuel Chemical Source: IHS Energy, IHS Chemical, IEA 217 IHS Markit China butane consumption by sector Residential/Commercial Industrial Engine fuel Chemical Refinery Source: IHS Energy, IHS Chemical, IEA 217 IHS Markit China has the world s largest residential/commercial LPG market. Increasing penetration of natural gas is seen in most of the urban markets, but large-scale use of biomass and coal in smaller cities and rural areas should provide ample remaining scope for fuel switching in favor of LPG. Natural gas is the primary fuel of choice for industrial applications, but the increased availability of low cost LPG has caused reverse-switching, where certain industrial users switched from natural gas to LPG, especially in Southeast China. Most of China s olefins production is linked to its refineries and relies on naphtha as a feedstock. While feedstock switching is currently not prevalent, LPG is expected to be increasingly competitive as a substitute feedstock going forward, leading to a large increase in demand. China is also adding propane dehydrogenation (PDH) units, which also contribute to demand. China has fleets of autogas vehicles in some cities, and policy support is expected to continue to facilitate slow growth. There are several hundred retail LPG companies. Most are municipal gas companies (owned by local governments) but many private companies started operations in the 199s. The fragmented nature of the LPG industry has caused inefficiencies in retail operations.
76 Million metric tonnes Million metric tonnes 76 Japan: LPG supply Japan propane supply Refinery Net imports Source: IHS Energy, Astomos, IEA 217 IHS Markit Japan butane supply The only domestic supply source in Japan is refineries and crude runs are declining. A small amount of LPG is produced in petrochemical plants but since they are integrated with refineries, the LPG is counted as refinery produced LPG. Demand is also expected to decline slowly, leading to no increase in imports. The structure of the Japanese LPG industry is complex with a large number of importers and marketers which operate with an extensive amount of government regulations. Japan is the world s 2nd largest LPG importing country (after China). The biggest three importers are Astomos Energy, Eneos Globe, and Gyxis, which in combination accounted for about 8% of total LPG imports. Source: IHS Energy, Astomos, IEA Refinery Net imports 217 IHS Markit
77 Million metric tonnes Million metric tonnes 77 Japan: LPG demand Japan propane consumption by sector Residential/Commercial Industrial Engine fuel Chemical Price Sensitive Demand Other Source: IHS Energy, IHS Chemical, Astomos, IEA 217 IHS Markit Japan butane consumption by sector The residential/commercial sector accounts for about 4% of Japan s LPG consumption. The sector is mature, and demand is expected to continue to decline slowly. After the shutdown of all of the country s nuclear power plants following the Fukushima disaster, LPG demand in the residential/commercial and power generation sectors saw a sharp increase as an emergency fuel. Japan has 42 operable reactors, and the country has restarted 5 reactors since the accident. The Japanese government has initiated a strategic national stockpile for emergency purposes. It plans to raise LPG stockpiles to full capacity (1.5 million metric tons) by March 218. The national stockpile currently holds 1.15 million metric tons of LPG (or 77% of capacity) Japan has an autogas market, but changing consumer tastes, less interest from car manufacturers and lack of strong policy support have led to declining demand. Declines are expected to continue. Japan has a sizable and growing demand for propane to enrich lean imported LNG to meet its natural gas pipeline specifications. Growth in this sector is expected to partially offset some of the declines elsewhere. Industrial Engine fuel Chemical Price Sensitive Demand Other Source: IHS Energy, IHS Chemical, Astomos, IEA 217 IHS Markit Olefins plants in Japan are estimated to have the flexibility to produce up to 15-2% of the ethylene from LPG.
78 Million metric tonnes Million metric tonnes 78 South Korea: LPG supply South Korea propane supply All of the LPG is recovered from refineries and no increase in supply from refineries is forecast. Butane recovery from refineries has declined since about 2 as increased amounts of butane were used to produce gasoline. An increase in price sensitive demand is causing imports of both propane and butane to increase. Refinery Other Net imports Source: IHS Energy, KEEI, IEA 217 IHS Markit South Korea butane supply Source: IHS Energy, KEEI, IEA Refinery Net imports 217 IHS Markit
79 Million metric tonnes Million metric tons 79 South Korea: LPG demand South Korea propane consumption by sector Residential/Commercial Industrial Engine fuel Chemical Price Sensitive Demand Other Source: IHS Energy, IHS Chemical, SK Gas, KEEI, IEA 217 IHS Markit South Korea butane consumption by sector Residential/Commercial Industrial Engine fuel Chemical Price Sensitive Demand Other Source: IHS Energy, IHS Chemical, SK Gas, KEEI, IEA 217 IHS Markit The South Korean residential/commercial sector is dominated by electricity and natural gas (imported as LNG), with most incremental demand met by electricity. Most areas of the country that can be connected to natural gas supply have already done so. LPG consumption in the sector has been in decline since the early 2s, and this trend is expected to continue, though more slowly. Engine fuel is the largest market for LPG (particularly butane), but demand growth has slowed dramatically due to a shift in tax rates to reduce the spread between LPG and gasoline. The sector is expected to continue a slow decline as vehicle stock ages and fewer new models are purchased. Most of the propane used in the chemical sector is in dehydrogenation (PDH) units to produce propylene. Butane is used to produce ammonia and maleic anhydride, and as a substitute for naphtha in ethylene crackers. Increased availability of low cost imported LPG will encourage increased use of LPG as petrochemical feedstock, at least on a seasonal basis. Like Japan, South Korea also uses some LPG in power generation as an alternative to gas and fuel oil, and this use will continue, though little growth is expected.
80 Million metric tonnes Million metric tonnes 8 India: LPG supply India propane supply Refinery Natural gas processing Net imports Source: IHS Energy, Indian Oil and Gas, IEA 217 IHS Markit India butane supply Refinery Natural gas processing Net imports Source: IHS Energy, Indian Oil and Gas, IEA 217 IHS Markit LPG production comes primarily from refineries. The country has 23 refineries at present with a total capacity of 4.8 million b/d. Since about 8% of LPG production in India is from diesel-optimized refineries, production is heavily weighted toward butane. LPG from refineries is expected to increase rapidly as there are plans to add significant greenfield and brownfield refining capacity. Mega refinery (1.2 million b/d) on the west coast of India is expected to come online by 222. Moreover, there are plans to bring two other refineries online one in North and one in the East. Simultaneously, significant brownfield refinery capacity expansion is taking place across the country. IOC is expected to add at least 24 million tons of capacity by 221. BPC and HPC are currently expanding their refining capacity as well. The country has four LPG pipelines with a rated capacity of 5.3 million TPA. The country is also making significant investment in the import and distribution infrastructure to serve the burgeoning demand. About 8 million tons of import terminal capacity is expected to come online in next 3-5 years. Similarly, about 1 million TPA of pipeline capacity is being added.
81 Million metric tonnes Million metric tonnes 81 India: LPG demand India propane consumption by sector Residential/Commercial Industrial Engine fuel Chemical Source: IHS Energy, IHS Chemical, Indian Oil and Gas, IEA 217 IHS Markit India butane consumption by sector About 9-95% of the demand is in the res/com sector as government subsidizes the fuel for the underprivileged section of the society. Most of the res/com demand is served by three state owned enterprises (SOEs). However, there is participation by private players in the non-subsidized domestic sector and in the auto gas and industrial sector. The LPG demand should increase significantly as the government attempts to convert 5 million households from the traditional chullahs (wood chips/cow dung) to LPG in next 3 years under the social welfare PMUY scheme. Additionally OMCs have plans to increase the national coverage of LPG from the current 72% to 82% by 218 and 95% by As the res/com demand growth slows after 221 (after PMUY scheme and national coverage plans are over), some chemical capacity addition (PDH/BDH plants) will help absorb some of the global LPG surplus. The LPG subsidy burden of the government has reduced dramatically over the last couple of years due to introduction of reforms PaHaL wherein the government has been able to save about $ 3.4 billion in subsidy by eradicating 69 million connections in last 2 years. Residential/Commercial Industrial Engine fuel Chemical Source: IHS Energy, IHS Chemical, Indian Oil and Gas, IEA 217 IHS Markit The Indian government has plans to reduce the subsidy burden further by restricting subsidies to the neediest of households i.e., households having income of less than USD 15,5 per year.
82 Million metric tonnes Million metric tonnes 82 Indonesia: LPG supply Indonesia propane supply Refinery Natural gas processing Net imports Source: IHS Energy, Pertamina, IEA 217 IHS Markit Indonesia butane supply Refinery Natural gas processing Net imports Source: IHS Energy, Pertamina, IEA 217 IHS Markit LPG from natural gas processing includes both domestic supply and plants linked to LNG export facilities The decline in production from 22 to 27 was primarily due to the decline in LNG production, particularly from the Arun plant Production rebounded with the start-up of Petrochina s Jabung FPSO in South Sumatra and the Belanak project in the South Natuna Sea, as well as several other LPG projects Despite these new projects, Indonesia has become a very large LPG importer as a result of a mandated shift from kerosene to LPG. Indonesia was a net exporter until 27 LPG recovery from refineries is very small and will not increase significantly. Indonesia has eight refineries with a total capacity of 1.1 million b/d, of which six refineries are operated by Pertamina Currently, there is only one refrigerated terminal in Indonesia at Tanjung Uban Batam and 4 VLGCs at two different locations are used as floating storage. There are plans to build two new refrigerated terminals one in East Java and one in West Java Pertamina currently imports LPG though its 24 import terminals spread across Indonesia. By end of 223 the number is expected to double. Storage capacity at present is about 2, tons and is expected to reach 7, tons by end of 223
83 Million metric tonne Million metric tonnes 83 Indonesia: LPG demand Indonesia propane consumption by sector and exports Residential/Commercial Industrial Engine fuel Chemical Net exports Source: IHS Energy, IHS Chemical, Pertamina, IEA 217 IHS Markit Indonesia butane consumption by sector and exports In 27, the Indonesian government embarked on a kerosene to LPG conversion program for households. Under this program 58 million LPG starter kits, which consisted of 3kg LPG cylinder, gas stove and regulator, were distributed between in 28 districts The conversion program is largely complete except in the eastern parts where Pertamina is developing LPG infrastructure In future, Pertamina would aid in conversion of fishing boats using gasoline to LPG. About 5 have been converted so far with 2, more to be converted The current high import demand of LPG has encouraged further growth and investment across the LPG value chain of Pertamina Engine fuel demand is not expected grow much as the Energy ministry recently issued a ministerial decree that requires all retail stations in the country to provide at least 1 CNG pump a move seems to be favoring CNG over autogas and accelerating shift away from oil derived fuels. Pertamina plans to have 53 CNG stations up from 34 at present by end of this year Residential/Commercial Industrial Engine fuel Chemical Net exports Source: IHS Energy, IHS Chemical, Pertamina, IEA 217 IHS Markit
84 84 Price drivers for LPG the big picture Crude Oil Pricing Refinery Utilization/ Economics Petrochemi cal Prices Refined Products Prices Competitive Feedstock (Naphtha) Prices Competitive Feedstock Economics IMPORTANT NOTE: Prices Also Affect Supply/Demand Demand Growth Competitive Fuel Economics NGL Prices Freight Costs Supply Availability NGL Supply/Demand Pressures Weather NGL Imports/Exports
85 85 LPG Global Prices: 2 to 225, Four distinct eras of pricing Pre shale 2-28: US LPG production was flat. Demand flat, US pricing in line with other regions Shale boom : US LPG production grew faster than export oriented logistics. US prices weakened significantly to other regions Production Reset : US LPG production growth paused. Export oriented logistics caught up to supply. Prices in US strengthened. Resumption of growth : US LPG production growth expected to resume. Pressure once again on US pricing as new export and ship capacity will need to be built in
86 Constant 215 dollars per tonne Ratio weight % 86 US propane prices and ratios to crude are expected to weaken annually over the next several years as production resumes growth International Propane Prices Propane / Brent Crude Oil Price Relationship 1,2 1, Pre shale Mt. Belvieu, Spot Propane Mideast, Contract FOB Source: IHS, OPIS, & Argus (Historical) Northwest Europe, C&F Japan, Spot C&F 217 IHS Markit.7 Shale boom Resumption of growth NW Europe Propane/Brent Mont Belvieu Propane/Brent Source: IHS, OPIS, & Argus (Historical) Shale Reset Japan Propane/Brent 217 IHS Markit

87 87 IHS LPG Price Forecasting Mechanism 3. Freight differential s to NE Asia* 5. Freight differentials from various regions 2. Contract freight differentials to NE Asia 1. Cash cost vs naphtha and winter fuel competition 4. Freight differential from US * Adjusted for winter heating demand spike
88 Constant $/metric ton 88 Japan Feedstock Economics: LPG cash costs in Asia will need to remain competitive with naphtha to balance the global market Japan feedstock economics 1,6 1,4 LPG Unfavorable 1,2 Significant length in LPG market requiring consumption in the chemicals market to balance the world 1, LPG Favorable Propane Cash Cost Butane Cash Cost Naphtha Cash Cost Source: IHS Energy, IHS Chemical, Argus 217 IHS Markit
89 Constant 216 dollars per tonne 89 LPG prices in Asia are projected to remain below naphtha prices over the long term. As exports grow, US LPG prices will increasingly be set by netbacks from Asia and other distant markets. Naphtha will continue to reflect crude oil and refined products Asia LPG and Naphtha Prices 1,2 1, Propane Butane Naphtha Source: IHS, OPIS, & Argus (Historical) 217 IHS Markit
90 Constant $/metric ton 9 Middle East and US Prices will be influenced by freight costs to Japan Waterborne freight costs to Japan Arab Gulf to Japan: 75, cbm USGC to Japan: 75, cbm Source: IHS Energy Australia to Japan: 75, cbm USGC to Japan: 75, cbm (via Panama Canal) 217 IHS Markit
91 Constant $/metric ton Differential ($/metric ton) Constant $/metric ton 91 Cost of freight is expected to rise over the next several years as US production grows Middle East and Asia propane prices and differentials US and Asia propane prices and differentials 1, 1 1, Japan spot CIF less Mideast contract FOB propane Mideast contract propane FOB Japan spot propane CIF Source: IHS Energy, Argus 217 IHS Markit Source: IHS Energy, Argus Japan spot CIF less USGC spot propane USGC spot propane Japan spot propane CIF 217 IHS Markit
92 Million metric tons 92 The US will remain the world s largest propane exporting country Global propane exports by major source Source: IHS Energy United States CIS Africa Middle East Oceania Southeast Asia China Europe Latin America Canada 217 IHS Markit
93 Million metric tons 93 Global propane surplus will move primarily to Asia Global propane imports by major destination Source: IHS Energy China Indian Sub. Oceania Southeast Asia Taiwan Korea Japan Middle East Africa CIS Europe Latin America Canada 217 IHS Markit
94 Million metric tons 94 US propane exports will move primarily to Northeast Asia (China) and Latin America United States propane exports by destination Source: IHS Energy China Europe Southeast Asia Taiwan Korea Japan Middle East Africa Latin America Canada 217 IHS Markit
95 Jan-9 Jan-1 Jan-11 Jan-12 Jan-13 Jan-14 Jan-15 Jan-16 Jan-17 Jan-18 Thousand bd Thousand bd 95 We expect exports remain strong in September and the fall due to delayed exports as a result of Hurricane Harvey US Propane Exports 1,3 1,2 US Propane Exports 1,2 1, Annual Average 1,1 8 1, Jan Mar May Jul Sep Nov Source: IHSMarkit, EIA 217 IHSMarkit
96 Key Propane Topics for Fall 217 Introduction Hurricane Harvey s Effects on the US Winter Propane Outlook Inventories: Where we are thus far this winter Supply: OPEC and crude prices, implications to US propane Res/Com Demand: Weather correlations to propane demand Chemical Demand: High prices leading to lower demand Exports: Why is the industry investing in propane exports? Projections of regional propane inventories Propane Price Forecast Conclusions 96

97 East Coast propane stocks are expected to remain at average levels. Propane production from gas processing continues at high levels as Marcellus and Utica production continue to grow. However, certain sub PADDs such as PADD IC, lower Atlantic are at levels much lower than the past several years 97
98 Mid-Continent propane stocks may face some pressure if we have an average winter and inter-padd transfers are limited due to high exports 98

99 U.S. Gulf Coast propane stocks levels are starting the winter at levels much lower than last year 99

100 Days of supply in PADD 3 are much lower than the inventory constrained winter of
101 Propane stocks in the Rocky Mountain region are expected to remain high due to new storage capacity 11
102 Propane stocks in the West Coast region should remain near the average Around 8% of PADD 5 propane supply is from refining. Also, no propane based crackers are in PADD 5, which makes cracking economics and chemical demand irrelevant. 12

103 Export contracts signed in an oversupplied market are now commencing. Due to lower crude prices and weaker propane gas plant production growth, the expected supply for exports do not exist and the market is drawing down inventory to meet the contracts 13

104 If exports remain similar to levels seen last winter, we risk reaching critical days of supply, primarily due to low inventory in PADD 3. 14
105 Key Propane Topics for Fall 217 Introduction Hurricane Harvey s Effects on the US Winter Propane Outlook Inventories: Where we are thus far this winter Supply: OPEC and crude prices, implications to US propane Res/Com Demand: Weather correlations to propane demand Chemical Demand: High prices leading to lower demand Exports: Why is the industry investing in propane exports? Projections of regional propane inventories Propane Price Forecast Conclusions 15
106 16 The propane to crude ratio was extremely weak in 215. Due to flatter production, higher exports, length in terminal/shipping capacity, and low days of supply US propane prices have been able to recover versus crude Mont Belvieu Propane Ratio to WTI Jan Feb Mar Apr May Jun Jul Aug Sep Oct Nov Dec
107 $ per metric ton 17 The Japan Mont Belvieu Propane differential is expected to increase over the winter months Mont Belvieu and Japan propane prices 1,2 1, Jan-13 Jul-13 Jan-14 Jul-14 Jan-15 Jul-15 Jan-16 Jul-16 Jan-17 Jul-17 Jan-18 Jul-18 Japan - MB differential Forecast differential Mont Belvieu spot propane Japan spot propane MB propane forecast Japan propane forecast Source: IHS Energy 216 IHS
108 Key Propane Topics for Fall 217 Introduction Hurricane Harvey s Effects on the US Winter Propane Outlook Inventories: Where we are thus far this winter Supply: OPEC and crude prices, implications to US propane Res/Com Demand: Weather correlations to propane demand Chemical Demand: High prices leading to lower demand Exports: Why is the industry investing in propane exports? Projections of regional propane inventories Propane Price Forecast Conclusions 18
109 Conclusions US inventories of propane: Build season started later than usual and draw season starting earlier than usual due to exports. Expected to reach low days of supply in Feb/March. Exit winter with low days of supply US supply: Potential for resumption of growth as new rigs come online US demand: Res/com demand expected to be greater than last two warm years. Chemical demand for propane expected to be capped during the winter as it is not favored to ethane with higher crude prices US exports: Global demand continues to increase as India/China grows demand US price: Ratio of crude is already high. Expect it to go higher if we reach critical inventory. Risk does exist to this idea. Is the low inventory situation already built into the price? 19