Expanding data collection
|
|
|
- Clyde York
- 5 years ago
- Views:
Transcription

1 EXPANDING DATA COLLECTION33
2 Expanding data collection The WHO/UNICEF Joint Monitoring Programme for Water Supply and Sanitation has played an increasingly important role in improving the indicators and methods used for monitoring national and global drinking water supply and sanitation. In 2004, work began on developing a series of questions related to this topic that are recommended for inclusion in all national household surveys. The dual aims of this exercise are to increase coherence among surveys over time and the comparability of estimates among countries. This set of questions has already been adopted by two of the major household survey programmes in the developing world that is, the UNICEF-supported Multiple Indicator Cluster Surveys and the USAID-supported Demographic and Health Surveys. The work was carried out in collaboration with national and international authorities on household surveys as well as academics and sector specialists. This set of Core Questions can be found on the JMP website ( Work in this area will continue as other indicators are developed and adopted at national and international levels. Household water treatment Unhygienic handling of water during transport or within the home can contaminate previously safe water. A high percentage of people could therefore benefit from effective household water treatment and safe storage practices. Such household-level interventions can be very effective in preventing disease if they are used correctly and consistently. Two main household surveys used by the JMP now include questions on household water treatment. Results from recent surveys conducted in 35 countries show that a variety of treatment methods are used. Additional evidence can be obtained and a trend analysis carried out as more surveys become available over time. The JMP is currently undertaking an investigation to explore issues related to household water treatment technologies, with a view to evaluating their potential role in providing measurable access to a safe and sustainable drinking water supply. The set of Core Questions includes questions related to household drinking water treatment practices and on the gender aspects of drinking water collection. The latest round of MICS, conducted in 2005 and 2006, and a series of DHS carried out since 2005 have enabled the JMP to include the findings from these questions in this report. The inclusion of a question on household water treatment was particularly timely since it provides national baseline data for over 70 countries, now that household water treatment is being more widely promoted. Table 12 Percentage of households using different water treatment methods Drinking water treatment practices vary greatly among countries Country No treatment Boil Add bleach/ chlorine Use water filter Let it stand and settle Strain through a cloth Solar disinfection Other Don't know Mongolia Viet Nam Guinea-Bissau Lao PDR Cambodia Jamaica Guyana Honduras Thailand Uganda India Haiti Somalia Gambia Malawi Algeria Iraq Nepal Note: Multiple responses were possible, so totals do not add up to 100 per cent. Source: MICS and DHS surveys in 2005 and

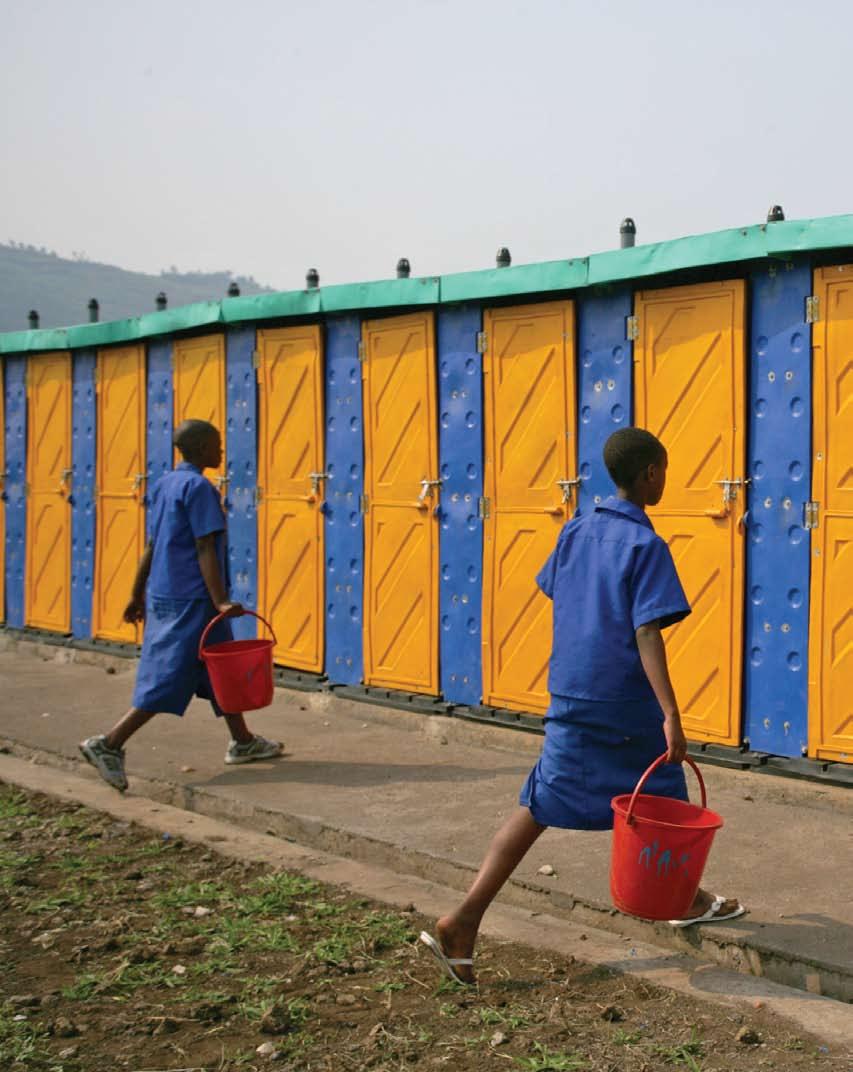
3 Gender dimensions of hauling water Some recent household surveys included the question, Who usually goes to the source to fetch water for the household? The findings, presented in Figure 33, confirm the anecdotal evidence that women shoulder the bulk of the watercollecting responsibility when drinking water is not available on premises. Women are more than twice as likely as men to go and fetch drinking water. Interestingly, the findings also suggest that children (boys and girls) play a relatively small role in water collection (only 11 per cent of households report that children are the main water haulers). Moreover, men appear to play a larger role in collecting water than they were previously given credit for: 1 out of 4 households report that men are usually responsible for collecting water. Table 13 Distribution of those usually responsible for collecting water, by percentage of women, men, girls and boys Collecting water is predominantly a woman s responsibility Women Men Girls Boys (highest) Guinea-Bissau Bangladesh Djibouti Malawi Côte d'ivoire Burkina Faso Nepal Gambia Lao People's Democratic Republic Ethiopia India (lowest) Cameroon Cambodia Guyana Algeria Jamaica Mongolia Syrian Arab Republic Trinidad and Tobago Source: MICS and DHS surveys from 35 developing countries in 2005 and 2006 Women shoulder the largest burden in collecting water Girls 7% Boys 4% Men 25% Women 64% Figure 33 Distribution of those who usually collect water Source: MICS and DHS surveys from 35 developing countries in 2005 and

4 Expanding data collection Safe disposal of children s faeces In many developing countries, young children defecate either in or close to home, or in diapers and potties. Infant and child excreta often ends up contaminating soil, drains and water bodies, either through direct disposal or defecation, or through the washing of diapers, potties and children in areas without safe wastewater disposal. As with open defecation, unsafe disposal of child excreta poses a health risk to anyone living or playing nearby. When left in the open in the yard or direct vicinity of the household, child faeces, which may carry a higher pathogen load than adult faeces, pose a particular risk for young children, whose play areas frequently overlap with disposal areas. Safe disposal of children s faeces is therefore at least as important as stopping open defecation. Table 14 Practices of disposing the faeces of young children (less than 36 months of age), by selected developing countries Practices for disposing of children s faeces are often unsafe Country Used toilet or rinsed in toilet Adequate Buried Adequacy depends on solid waste collection Thrown into garbage/with solid waste Inadequate Put/rinsed in drain or ditch Left in the open Sao Tome and Principe Bangladesh Guinea-Bissau Burkina Faso Somalia Mongolia Togo Viet Nam Cameroon Côte d'ivoire Iraq Thailand Burundi Central African Republic Guyana Ghana Malawi Gambia Jamaica Sierra Leone Suriname Source: MICS surveys in 21 countries in 2005 and 2006 Other 36

5 Table 15 Percentage of urban and rural populations using improved drinking water sources over 30 minutes away (round-trip) Collecting water is a time-consuming task in many African countries People who use an improved Country drinking water source more than 30 minutes away* Urban Rural Total Uganda Burundi Burkina Faso Malawi Mauritania Rwanda Mauritius Lesotho Central African Republic Gambia Namibia Zimbabwe Nigeria Cameroon United Republic of Tanzania Chad Ethiopia Ghana Congo Kenya Swaziland Sao Tome and Principe Côte d'ivoire Guinea Togo Guinea-Bissau South Africa Senegal Madagascar Niger Zambia Mali Sierra Leone Somalia Comoros *According to data from the latest household survey on file. Time spent to go to the source, collect water and come back When drinking water is not available in the home or close to it, the time taken to collect water (that is, to go to the source, stand in line, fill water containers and return home) is critical in determining whether a household can obtain enough water for drinking, food preparation and personal hygiene. Studies have found that if the time spent collecting drinking water is between 3 and 30 minutes, the amount collected is fairly constant and suitable to meet basic needs defined as between 15 and 25 litres per person per day. However, if the total time taken per round trip exceeds 30 minutes, people tend to collect less water, thus compromising their basic drinking water needs. The MDG indicator does not include a measure for time taken to collect water. However, some argue that, because it is a factor in drinking water use, the time needed to collect water should be considered when determining whether a source is improved or not. Data from 35 recent household surveys show that 18 per cent of the population in sub-saharan Africa relies on an improved drinking water source that is more than 30 minutes away. 37
6 JMP methodology The JMP The WHO/UNICEF Joint Monitoring Programme for Water Supply and Sanitation is the official United Nations mechanism tasked with monitoring progress towards the MDG drinking water and sanitation target. In fulfilling this mandate, the JMP publishes updated estimates every two years on the various types of drinking water sources and sanitation facilities being used worldwide. This JMP report presents global, regional and national estimates of the use of improved drinking water sources and improved sanitation facilities in These coverage estimates show what proportion of the population remained without improved drinking water sources and improved sanitation in 2006 and what the increase in use has been since the MDG baseline in In addition, the changes in coverage between 1990 and 2006 are used to assess progress towards the 2015 MDG targets for drinking water and sanitation. In line with the MDG indicator definition, which stipulates use of improved facilities as a proxy for access to improved facilities, the JMP measures and reports on the actual use of facilities. It is worth noting that the household surveys on which the JMP relies also measure use and not access since access involves many additional criteria other than use. Measurability of many of these other criteria at the national scale, which is the scale required by the JMP, poses a huge challenge. Data sources and the JMP database The water supply and sanitation coverage estimates presented in this report originate from data collected by national statistics offices and other relevant institutions through nationally representative household surveys and national censuses. The survey data used were mainly drawn from Demographic and Health Surveys, Multiple Indicator Cluster Surveys, World Health Surveys, Living Standards Measurement Surveys, Core Welfare Indicator Questionnaires, Health and Nutrition Surveys, Household Budget Surveys, Pan Arab Project for Family Health surveys and Reproductive Health Surveys. The JMP assembles, reviews and assesses these household survey and census data. The JMP database currently comprises data from over 600 surveys and censuses. Population estimates The population estimates in this report, including the proportion of people living in urban and rural areas, are those published by the United Nations Population Division (2006 revision). These estimates may differ from national estimates. Methodology to derive MDG progress estimates For each country, survey and census data are plotted on a time scale from 1980 to the present. A linear trend line, based on the least-squares method, is drawn through these data points to estimate coverage for 1990 and The total coverage estimates are based on the aggregate of the population-weighted urban and rural coverage numbers, divided by the total population. Trend analysis at the country level has been carried out for the following categories: Drinking water: - Piped water into dwelling, plot or yard - Improved drinking water sources Sanitation: - Improved sanitation facilities - Open defecation The coverage estimates for improved sanitation facilities presented in this report are discounted by the proportion of the population that shared an improved type of sanitation facility. The ratio (the proportion of the population that shares a sanitation facility of an otherwise adequate type among two or more households) derived from the latest household survey/census is subtracted from the trend estimates of improved sanitation facilities. This results in the estimates for shared sanitation facilities. Regional averages Regional coverage estimates are calculated when the available data cover at least 50 per cent of the population in a region. For this report, insufficient data were available to disaggregate each of the rungs of the sanitation ladder for the developed regions, the Commonwealth of Independent States and Oceania. The MDG regional groupings (see map on the inside back cover) have been used in all regional analyses and tabulations. Differences in national coverage estimates Indicator definitions and population estimates used by the JMP sometimes differ from those used by national governments. Coverage estimates in this report may therefore differ from national estimates. Data comparability between JMP reports For each report published by JMP, the country, regional and global estimates on water and sanitation are revised. For this reason, the data published in successive JMP reports are not comparable. 38
7 Definitions and indicators Millennium Development Goal 7 calls on countries to halve, by 2015, the proportion of people without sustainable access to safe drinking water and basic sanitation. This report assesses the proportion of people with access to safe drinking water and basic sanitation using the following MDG indicators: - The proportion of the population that uses an improved drinking water source, urban and rural. - The proportion of the population that uses an improved sanitation facility, urban and rural. An improved drinking water source is defined as a drinking water source or delivery point that, by nature of its construction and design, is likely to protect the water source from outside contamination, in particular from faecal matter. The JMP uses the following classifications to differentiate improved from unimproved drinking water sources. Improved drinking water sources Piped water into dwelling, plot or yard Public tap/stand pipe Tube well/borehole Protected dug well Protected spring Rainwater collection Unimproved drinking water sources Unprotected dug well Unprotected spring Cart with small tank/drum Tanker truck Surface water (river, dam, lake, pond, stream, canal, irrigation channel) Bottled water 3 An improved sanitation facility is defined as one that hygienically separates human excreta from human contact. The JMP uses the following classifications to differentiate improved from unimproved sanitation facilities. However, sanitation facilities are not considered improved when shared with other households, or open for public use. Improved sanitation facilities Flush or pour-flush to: - piped sewer system - septic tank - pit latrine Ventilated improved pit latrine Pit latrine with slab Composting toilet Unimproved sanitation facilities 4 Flush or pour-flush to elsewhere 5 Pit latrine without slab or open pit Bucket Hanging toilet or hanging latrine No facilities or bush or field (open defecation) Since the last report, the JMP database has been updated with data from over 120 new surveys and censuses covering 84 countries: Albania, Algeria, Angola, Argentina, Armenia, Bangladesh, Belarus, Bhutan, Bosnia and Herzegovina, Bulgaria, Burkina Faso, Burundi, Cambodia, Cameroon, Central African Republic, Chad, China, Colombia, Congo, Costa Rica, Côte d Ivoire, Djibouti, Dominican Republic, Egypt, El Salvador, Ethiopia, Gambia, Georgia, Ghana, Greece, Guinea, Guinea-Bissau, Guyana, Haiti, Honduras, India, Indonesia, Iraq, Israel, Jamaica, Kazakhstan, Kyrgyzstan, Lao People s Democratic Republic, Lesotho, Malawi, Mexico, Moldova (Republic of), Mongolia, Montenegro, Morocco, Namibia, Nepal, Niger, Pakistan, Panama, Peru, Portugal, Romania, Rwanda, Sao Tome and Principe, Senegal, Serbia, Sierra Leone, Somalia, South Africa, Spain, Suriname, Swaziland, Syrian Arab Republic, Tajikistan, Thailand, The former Yugoslav Republic of Macedonia, Togo, Trinidad and Tobago, Uganda, Ukraine, United Republic of Tanzania, Uzbekistan, Venezuela, Viet Nam, Zambia, Zimbabwe 3 Bottled water is considered to be improved only when the household uses water from an improved source for cooking and personal hygiene; where this information is not available, bottled water is classified on a case-by- case basis. 4 Shared or public facilities are not considered improved. 5 Excreta are flushed into the street, yard or plot, open sewer, a ditch, a drainage way or other location. 39
8 40