Cover slide option 1 Title
|
|
|
- George Banks
- 5 years ago
- Views:
Transcription
 International Water Management Institute, Nepal 2016 International SWAT Conference,")
1 Hydrological Modeling of Koshi basin and Climate Cover slide option 1 Title Change analysis (Nepal) Ambika Khadka (Dr. Luna Bharati, Utsav Bhattarai, Pabitra Gurung) International Water Management Institute, Nepal 2016 International SWAT Conference, Beijing, China
 Currently development plans at individual project levels without focusing on downstream impacts,")
2 INTRODUCTION OBJECTIVES River basins in Himalayas are still considered data and information vaccuum Koshi basin is perceived as having high potential for hydropower and irrigation development To assess the spatial and temporal water balances in the Koshi basin (China, Nepal and India) Currently development plans at individual project levels without focusing on downstream impacts, environmental flows, impact on local livelihoods. So there is a need to carry out accurate physical resource assessments, which quantifies both spatial and temporal water availability in the basin Also impacts of climate change is important in future planning (infrastructural planning) Assess the impacts of CC in the hydrology of Koshi basin using SWAT

3 STUDY BASIN Koshi Basin (87,311 km 2 ): Transboundary basin, covering 4 physiographic regions. 5 districts in China, 27 districts in Nepal and 16 districts in Bihar, India Largest contributor to the Ganges river


 interventions Others LULC Map Results")
4 METHODS AND SPATIAL DATA Spatial Data DEM Soil LULC DEM Time-series Data Precipitation Temperature Relative humidity Wind speed Solar radiation SWAT model setup Model Reset Observed Flow Data Model Calibration and validation Scenario Scenario Runs Runs With/without built Reference period (1998- infrastructure 2008) CC scenario RCP45 ( ) With adaptation RCP85 ( ) interventions Others LULC Map Results Analysis and Reporting


5 HYDRO-MET AND CALIBRATION STATIONS
6 ODEL CALIBRATION Sensitivity analysis Auto calibration Manual calibration Arnold et al. 2011
7 VALIDATION CALIBRATION Calibration and Validation of flow at Chatara #695
8 CALIBRATION AND VALIDATION (CONTD..) River Station (Index no.) Index Daily Monthly Calibration Validation Calibration Validation Arun Turkeghat (#604.5) R NSE *Performance Very Good Satisfactory Tamor Majhitar (#684) R NSE *Performance Very Good Very Good Sunkoshi Pachuwarghat (#630) R NSE *Performance Very Good Very Good Bagmati Padherodovan (#589) R NSE *Performance Very Good Good Saptakoshi Chatara (#695) R NSE *Performance Very Good Good *Guidelines proposed by Moriasi et al. (2007)
 200")


9 400 WATER BALANCE ( ) Jan Feb Mar Apr May Jun Jul Aug Sep Oct Nov Dec Precipitation Actual ET Net Water Yield Storage
10 PHYSIOGRAPHIC REGION WISE WATER BALANCE TM= Trans-mountain; M=Mountain; H=Hills; IGP=Indo-Gangetic Plains; error bars show the maximum-minimum range
11 FUTURE CLIMATE SCENARIOS A new set of scenarios, the Representative Concentration Pathways (RCPs), was used for the new climate model simulations carried out under the framework of the Coupled Model Intercomparison Project Phase5 (CMIP5) of the World Climate Research Programme RCPs are identified by their approximate total radiative forcing in year 2100 relative to 1750: 2.6 W/m 2 for RCP2.6, 4.5 W/m 2 for RCP4.5, 6.0 W/m 2 for RCP6.0 and 8.5W/m 2 for RCP8.5 RCP2.6 : mitigation scenario leading to a very low forcing level Radiative forcing peaks and declines by 2100 RCP4.5 and RCP6.0 : stabilization scenario Radiative forcing stabilizes by 2100 RCP8.5 : very high GHG emissions Radiative forcing does not peak by 2100 Source: IPCC, 2013
 and RCP85 (right 43 GCMs) model runs Note: GCM data provided by")
12 Climate change downscaling method Selection of GCM Projected changes in P and T for RCP45 (left- 41 GCMs) and RCP85 (right 43 GCMs) model runs Note: GCM data provided by ICIMOD
13 Climate change downscaling method (Contd ) Delta Change Approach Grids with monthly delta change data for the future was provided (Immerzeel et al. 2012) Daily future time series climate data (precipitation, maximum temperature and minimum temperature) for 2021 to 2050 was generated by applying monthly delta change value in random years in reference period ( ). Specifications of provided dataset Extent (WGS 1984) Long: to E Lat: to N Spatial Resolution 0.25 x 0.25 T units Kelvin (K) P units Percent (%) Format ASCII grid Total no of grids 192

14 Future Water Balance (Seasonal) Absolute change in annual average water balance components from reference period Premonsoon Winter Postmonsoon Monsoon Precipitation IPSL_CM5A_rcp GISS_E2_rcp CCSM4_rcp CanESM2_rcp IPSL_CM5A_rcp GFDL_ESM2G_rcp CSIRO_rcp CanESM2_rcp Net Water Yield IPSL_CM5A_rcp GISS_E2_rcp CCSM4_rcp CanESM2_rcp IPSL_CM5A_rcp GFDL_ESM2G_rcp CSIRO_rcp CanESM2_rcp Actual ET IPSL_CM5A_rcp GISS_E2_rcp CCSM4_rcp CanESM2_rcp IPSL_CM5A_rcp GFDL_ESM2G_rcp CSIRO_rcp CanESM2_rcp

15 Change in Future Precipitation RCP45 RCP85


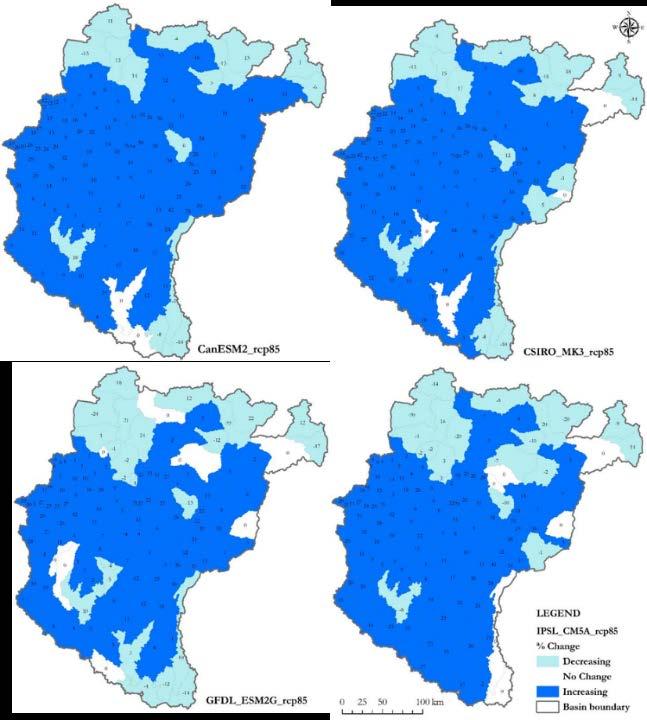
16 Change in Future Water Yield RCP45 RCP85


17 RCP45 Change in Future Actual ET RCP85
18 CHANGE IN FUTURE DISCHARGE RCP4.5 RCP8.5
19 CONCLUSION - SWAT can be used as an important tool to assess current and future water resources to aid in future development plans and decision making - Due to unavailability of the precipitation data and accurate information on snow and glacier in the high mountainous areas of Tibet and Nepal, results from the model have shown a low confidence level for this region - Remotely sensed data can be used to meet up for the lack of data in the mountainous region however they have to be bias corrected before they can be used - This model can be used for quantification of irrigation potential (DoI- Irrigation Master Plan) - If snow/glacier or groundwater need to be analyzed in detail, Snow/glacier models and groundwater models is recommended

20 THANK YOU ANY QUESTIONS?