Why We Should Support Nuclear Power. Chuck Edwards
|
|
|
- Sherman Barnett
- 5 years ago
- Views:
Transcription
1 Why We Should Support Nuclear Power Chuck Edwards

2 Microsoft PowerPoint Warning: Side effects include drowsiness, nausea, light-headedness, and, in rare instances, a diminished will to live.

3
4 Nuclear power is Safe Clean Cost competitive (and stable) Sustainable A proven base load option
5
6 Tonnes CO2 per person (2005) Quebec Yukon BC Ontario PEI Manitoba Nfld. & Lab. NWT & Nunavut Nova Scotia New Brunswick Alberta Saskatchewan
7 SaskPower Generation 3 X coal 4 x natural gas 7 x hydro 3 x wind 1664 MW 327 MW 853 MW 172 MW
8 Alternative Energy Alternative energy = cleaner energy Cleaner = lower CO2 emissions
9
10 Prudent & Judicious Solar Wind Biomass Hydro Nuclear

11 Solar Power Clouds? Night? Site area? Expensive Utility Home

12 ?

13 Solar Power Clouds? Night? Site area? Expensive Utility Home


14

15
16 Wind Power Discontinuous NIMBY Site area?
17 Biomass Land usage?

18 Biomass NPP (Net Primary Production)


19 YEARS

20 ?
21 10 Terawatts


22 10 Terawatts = 100% of agricultural land


23 Hydro Weather NIMBY


24 Role of Renewables in the United States

25 Role of Renewables in the United States
26 Role of Renewables COST? Solar Wind Biomass

27 Role of Renewables COST?

28 Role of Renewables COST?


29 Role of Renewables COST?


30 Role of Renewables COST?

31 Role of Renewables COST?

32 Role of Renewables COST?
33 Royal Academy of Engineering Electricity Generating Costs (pence/kwh) Nuclear 2.3 Onshore wind farm 3.7 Offshore wind farm 5.5 Wave and marine 6.6
34 Royal Academy of Engineering Electricity Generating Costs (pence/kwh) Nuclear 2.3 Onshore wind farm - With stand by capacity Offshore wind farm - With standby capacity Wave and marine
35 Role of Renewables Solar Wind Biomass

36 Prudent & Judicious Nuclear
37 Life Cycle CO2 Emissions (gram CO2 per kwh) Coal thermal 975 Oil thermal LNG thermal Photovoltaic Wind Hydro 29 11
38 Range of Life Cycle CO2 Emissions (gram CO2 per kwh) Lignite Coal Oil Natural Gas Photovoltaic Hydro Biomass 31 Wind
39 Range of Life Cycle CO2 Emissions (gram CO2 per kwh) Coal Photovoltaic Natural Gas Wind Biomass Nuclear Hydro
40 Relative CO2 Emissions (Life Cycle of Fuels) IC, clean gasoline Electrical/IC, clean gasoline Fuel cell, clean gasoline Fuel cell, methanol from NG Fuel cell, H2 from NG Fuel cell, H2 from biomass Fuel cell, H2 from nuclear
41 Nuclear power is Safe Clean Cost competitive (and stable) Sustainable A proven base load option
42
43 US Electricity Production in 2002 Fuel Cost ( /kwh) Natural Gas 3.44 Nuclear 0.45
44 Royal Academy of Engineering Electricity Generating Costs (pence/kwh) Nuclear 2.3 Gas-fired CCGT 2.2 Coal-fired pulverized-fuel 2.5 Coal-fired circulating fluid bed 2.6
45 Royal Academy of Engineering Electricity Generating Costs (pence/kwh) Nuclear 2.3 Gas-fired CCGT (with carbon tax) Coal-fired pulverized-fuel (with carbon tax) Coal-fired circulating fluid bed (with carbon tax)
46 University of Chicago Study Cost of Electricity, /kwh Coal-fired (no carbon tax) Gas-fired (no carbon tax) Nuclear (first-of-kind engineering) 3.3 to to to 7.1
47 University of Chicago Study Cost of Electricity, /kwh Coal-fired (greenhouse gas or carbon tax) Gas-fired (greenhouse gas or carbon tax) Nuclear (series engineering) up to 9.1 up to to 4.6
48 Nuclear power is Safe Clean Cost competitive (and stable) Sustainable A proven base load option
49

50
51

52
53 Nuclear power is Safe Clean Cost competitive (and stable) Sustainable A proven base load option
54
55 Replace Fossil Fuels in Base Load Supply? Wind no Solar Biomass Clean coal no no no
56 Range of Life Cycle CO2 Emissions (gram CO2 per kwh) Coal Natural Gas CCS Solar Hydro Wind Nuclear
57 Nuclear power is Safe Clean Cost competitive (and stable) Sustainable A proven base load option

58 Nuclear Power Reactor Safety 10,000 reactor-years 32 countries 2 significant accidents

59 Nuclear Power Reactor Accidents Chernobyl 25 April 1986 Flawed reactor design Inadequate training Procedure violation Steam explosion Graphite fire 5% of core released 31 immediate deaths ~10 deaths since

60 Nuclear Power Reactor Accidents Three Mile Island 28 March 1979 Equipment failure Inadequate instruments Operator confusion Cooling water leak Heat build up in core Fuel assemblies melted Small radiation release No deaths No injuries No health effects
61
62 Accident Statistics in Primary Electricity Production Fuel Coal Immediate Fatalities ( ) 6400 Who? Workers Natural Gas Hydro Workers & Public Public Nuclear 31 Workers
63 Comparative Radiation Doses and Their Effects Comparative Dose Source/Effect 1 msv/year cosmic rays/none 2 msv/year natural background/none 3 msv/year inhaled radon/none 9 msv/year polar route/slight to none 100 msv/year total/cancer risk increase 1,000 msv single dose total/radiation sickness (but not death)

64
65 Comparative Radiation Doses and Their Effects Comparative Dose Source/Effect 1 msv/year cosmic rays/none 0.5 msv 2 msv/year natural background/none 3 msv/year inhaled radon/none 9 msv/year polar route/slight to none 100 msv/year total/cancer risk increase 1,000 msv single dose total/radiation sickness (but not death)
66 Comparative Radiation Doses and Their Effects Comparative Dose Source/Effect 1 msv/year cosmic rays/none 1.4 msv 2 msv/year natural background/none 3 msv/year inhaled radon/none 9 msv/year polar route/slight to none 100 msv/year total/cancer risk increase 1,000 msv single dose total/radiation sickness (but not death)
67 Comparative Radiation Doses and Their Effects Comparative Dose Source/Effect 1 msv/year cosmic rays/none 2 msv/year natural background/none 3 msv/year 3.1 msv inhaled radon/none 9 msv/year polar route/slight to none 100 msv/year total/cancer risk increase 1,000 msv single dose total/radiation sickness (but not death)
68 Comparative Radiation Doses and Their Effects Comparative Dose Source/Effect 1 msv/year cosmic rays/none 2 msv/year natural background/none 3 msv/year inhaled radon/none 9 msv/year 9.3 msv polar route/slight to none 100 msv/year total/cancer risk increase 1,000 msv single dose total/radiation sickness (but not death)


69 McArthur River Key Lake Rabbit Lake McClean Lake


70

71
72
73

74

75

76 Public Exposure to Radon


77
78 Natural Uranium U-238 U-235 U % 0.720% 0.005%
79 Uses for Depleted Uranium - aircraft counter weights - yacht keels - radiation shielding
80 Uses for Depleted Uranium - aircraft counter weights yacht keels radiation shielding armour-piercing shells
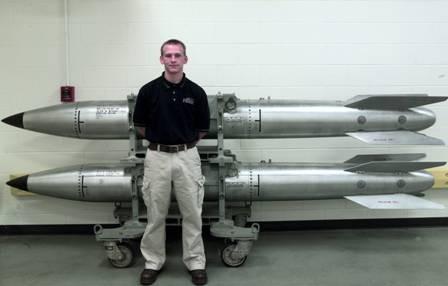
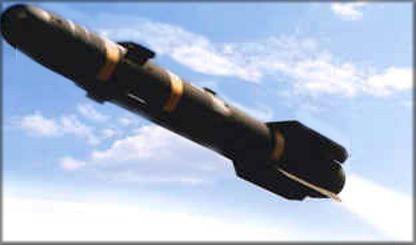
81 Depleted Uranium Projectiles Gulf War - Kosovo -
82 Exposure to Depleted Uranium External - Ingestion - Inhalation -


83

84
85 Nuclear Materials Uranium - power reactor fuel = 3% to 4% U weapons grade = >90% U-235
86 Nuclear Materials Plutonium - weapons grade = >93% Pu spent power reactor fuel = ~60% Pu-239 ~40% Pu-240


87
88 Uranium Perspective 1 nuclear weapon = 5 t Annual electricity production = 66,000 t
89

90 HEU Agreement
91 HEU Agreement Between Russia and the United States Russia blends HEU down to LEU Cameco purchases LEU Cameco sells LEU as reactor fuel

92 8000 decommissioned
93 Nuclear power is Safe Clean Cost competitive (and stable) Sustainable A proven base load option
94 We should support nuclear power because it is Safe Clean Cost competitive (and stable) Sustainable A proven base load option
95 EMTF END Chuck Edwards