Stormwater Data Characterization Results from Phase I Monitoring
|
|
|
- Osborne Barrett
- 5 years ago
- Views:
Transcription
1 Stormwater Data Characterization Results from Phase I Monitoring Brandi Lubliner, PE Co-authors: Will Hobbs, Nat Kale, Evan Newell Bellingham Bay Symposium, January 22, 2015
 New Permit")
2 Stormwater Monitoring: Old Permit ( ) New Permit ( )
3 2007 Phase I NPDES Municipal Stormwater Permit Purpose to gather actual stormwater discharge data as a status assessment for western Washington Characterize stormwater concentrations by land uses Phase I Municipal Permittees Counties: Snohomish, King, Pierce, Clark Cities: Seattle, Tacoma Co-permittees: Ports of Seattle and Tacoma
 Industrial (Ind) High Density Residential (HDR) Low Density Residential (LDR) Stormwater sampling")
4 Section S8.D Monitoring Requirements Location Drain basins with a predominant land use Commercial (Com) Industrial (Ind) High Density Residential (HDR) Low Density Residential (LDR) Stormwater sampling Storm events 11 storms/yr >0.2 /hr Hydrograph capture 75% using flow-weighted compositor Seasons Wet (Oct-Apr) 60-80% of the sampling effort Dry (May-Sept) 20-40% of sampling effort

5 S8.D Monitoring Requirements Stormwater sediment monitoring Single annual in-line sediment trap. Norton upright bottle Catch basin grab samples
6 Monitored Parameters Stormwater Conventionals Nutrients Metals (dissolved and total) Organics Pesticides Petroleum Stormwater sediments Conventionals Nutrients Metals (total) Organics Pesticides Petroleum fecal coliform, TSS, turbidity, cond., chloride, BOD5, ph, hardness, particle size, MBAS (surfactant) total phosphorus, orthophosphate, TKN, nitrite-nitrate cadmium, copper, lead, mercury, zinc PAHs, Phthalates prometon, diazinon, 2,4-D, MCPP, triclopyr, dichlbenil, pentachlorophenol NWTPH-Dx, NWTPH-Gx Grain size, total solids, total volatile solids, TOC total phosphorus cadmium, copper, lead, mercury, zinc PAHs, phthalates, phenolics, PCB aroclors diazinon, pentachlorophenol, chlorpyrifos, malathion NWTPH-Dx
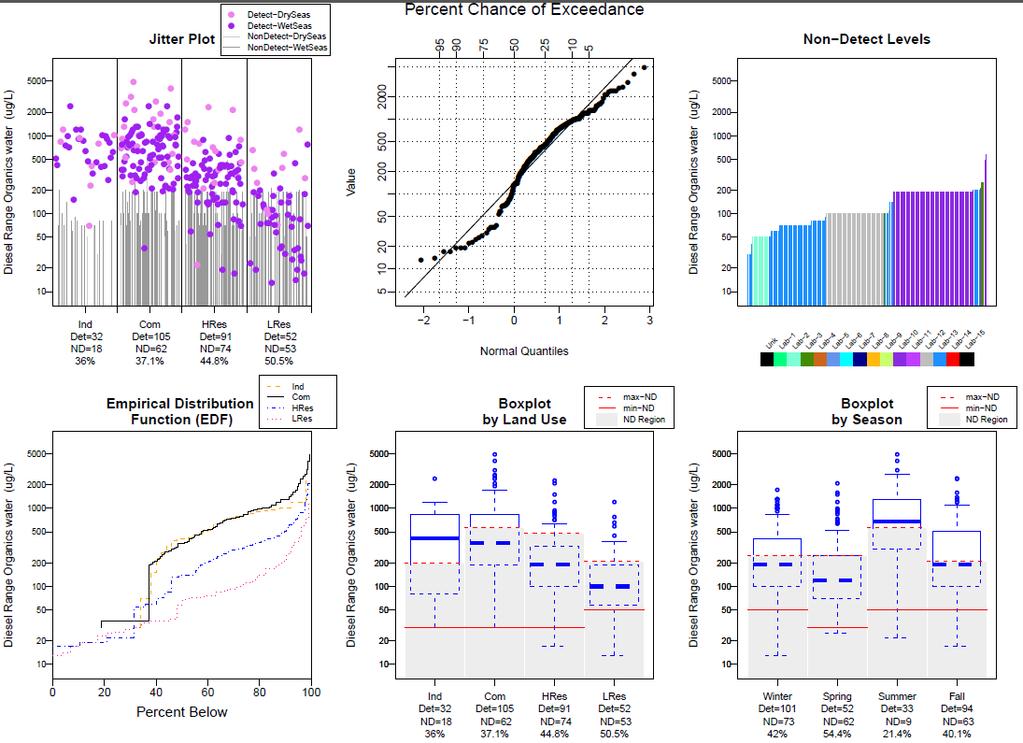
7 Stormwater Outfall Monitoring Results
8 Compiled dataset is representative Robust Stormwater dataset is large and based on composite samples representing storm event Approximately 600 storms sampled Storm hydrograph sampled (>75%) 85 chemicals analyzed in stormwater 67 chemicals analyzed in stormwater sediments Statistical analysis doesn t bias results for non-detections which are represented in summary statistics Results are presented overall, and by land use and season Local Results representative western Washington stormwater from municipal areas in Precipitation records compare well to SeaTac No apparent bias for storm size
9 Statistical Considerations Undetected concentrations Stormwater sampling produces many nondetects (below RL or MDL), flagged as U or UJ Statistics No substitution for non-detects Multiple reporting limits Primarily nonparametric Amount of Data by Parameter Case Percent non-detect <50 Observations > 50 Observations A < 50 % non-detects Kaplan-Meier Kaplan-Meier B % non-detects Kaplan-Meier Kaplan-Meier Robust MLE, robust ROS MLE C > 80% non-detects Adapted from Helsel, 2012 Report ranges or % above a meaningful threshold Report ranges and high percentile concentrations
10 Context & Comparison of Results Ecology compared results to other large studies National Urban Runoff Program (NURP) EPA,1983 Compositor samples from urban areas nationwide National Stormwater Quality Database (NSQD) Review Maestre et al and 2005 Database query and review of stormwater data across cities nationally Puget Sound Toxics Loading Study (Herrera, 2011) Major local study to estimate loading from stormwater to Puget Sound Grab samples on local area rivers and streams under storm flows
11 Summary of S8.D median stormwater concentrations relative to other studies. The Y- axis units are the differences (multiples) of the S8.D stormwater median concentrations reported in the other studies. Bars show the magnitude of difference as less than (negative) or more than (positive) the S8.D results. Many parameters were not measured in previous studies
12 WQ Criteria Summary Parameters ranked in order of percent of samples in excess of the aquatic life water quality criteria. Acute aquatic life criteria Chronic aquatic life criteria Parameter Exceeds Samples Parameter Exceeds Samples (%) (total) (%) (total) Dissolved Copper Dissolved Copper Dissolved Zinc Total PCBs Dissolved Lead Dissolved Zinc Dissolved Dissolved Lead Cadmium Diazinon Total Mercury Chloride Chloride Total PCBs Dissolved Cadmium Pentachlorophenol Diazinon Chlorpyrifos Pentachlorophenol Dissolved Arsenic Chlorpyrifos Dissolved Mercury Dissolved arsenic
13 Sediment Criteria Comparisons Highest # of samples exceeding the WA State Sediment Clean-up Objectives (SCOs) proposed for freshwater sediment Phthalates 82% of the samples for bis(2-ethylhexyl) phthalate 29% of the samples for di-n-octyl phthalate PAHs 34% of the samples Phenolics 20% Metals From zinc 1% to lead 18%
14 Key Results Land Uses COM/IND land uses - higher concentrations of: Metals Hydrocarbons Phthalates Total N and P PCBs and pentachlorophenol Metals, diesel, nutrients build-up and are highest in Com/Ind areas in dry seasons storms. Similar land use pattern found in receiving water concentrations in PS Toxics Loading Study Residential land uses discharge the highest dissolved nutrient concentrations
15 Key Results - Metals Metals were most likely to exceed water quality criteria for aquatic life Copper, zinc and lead most frequent Cadmium occasionally COM/IND areas highest stormwater concentrations for metals Metals are statistically higher in the dry season storms indicating they build-up with dry periods.


16 Copper, dissolved median commercial and industrial lands significantly higher than low-density residential
17 Zinc, dissolved median commercial and industrial lands significantly higher than residential high-density residential lands can have concentrations greater than high industrial concentrations (~ 90 th percentile)
18 Key Results - Organics PAHs, phthalates and PCBs did not buildup in dry periods Sources are likely constant PAHs, NWTPH-Dx and BEHP were found in all samples (water or sediment) Diesel much higher in Com/Ind basins Motor oil higher from residential basins
19 PAHs individual PAHs very similar trends PAHs, phthalates, PCBs and the few detected pesticides did not exhibit a significant seasonal difference in concentration
20 Key Results - Nutrients Water quality criteria for ammonia were not exceeded Dry season concentrations were higher for all nutrients Nutrients showed strong and different land use associations Total N & P highest in COM/IND areas Dissolved nutrients were significantly greater from residential land uses*
21 Nutrients total nutrients greatest from Industrial land uses dissolved nutrients greatest from lowdensity residential and industrial lands.
22 Summary This stormwater outfall dataset: Robust, representative of urban stormwater discharges in western WA. Reflects 4 land uses and two seasons Fills a knowldeg gap - useful to scientists, managers, modelers, etc. Concur with national and local studies on land use patterns All land uses contribute metals, hydrocarbons and nutrients to stormwater Commercial Industrial>High Density Res> Low Density Res Exception of dissolved nutrients which are highest in stormwater from residential areas**
23 Recommendations Stormwater Management Discharges from basins with predominantly commercial and industrial land uses are a priority for housekeeping and treatment BMPs Hydrocarbons, metals, total nutrients Build-up during the dry season does occur for metals, hydrocarbons and total nutrients Housekeeping BMPs such as street sweeping useful prior to fall rains Further analysis Future monitoring and modeling
24 New Permit Monitoring RSMP 101
25 Regional Stormwater Monitoring 2013 (new) Permit Program (RSMP) Shift from outfall monitoring to receiving water monitoring Coordinated monitoring program (RSMP) has 3 monitoring components Status and Trends in streams and marine nearshore Effectiveness studies for stormwater treatment and management Source identification and diagnostic repository Lead by Stormwater Work Group Administered by Ecology, but work done by wide variety of stakeholders


26 RSMP S&T Sites Bellingham Bay sites 6 small streams sites
 final report corresponding author Will Hobbs (whob461@ecy.wa.gov) data analysis and report author Nat Kale (nkal461@ecy.wa.gov) permit writer and report author")
27 Questions? Report and Dataset available soon!! (Next Month) Contact report authors Author contact info: Brandi Lubliner final report corresponding author Will Hobbs data analysis and report author Nat Kale permit writer and report author
28 Parameter Detection Parameters divided by frequency of detection in stormwater Case A Most frequently and exhibited a significantly higher land use Conventionals > 98%, except surfactants > 60% Metals > 90%, except mercury Nutrients 90% PCB Aroclor 1254 PAHs 73% Bis(2-ethylhexyl) phthalate (BEHP) >62% Case C poorly detected parameters (<10%) Gasoline (NWTPH-Gx), BTEX, mercury Chlorpyrifos, diazinon, malathion, prometon

29
30


31
32 Vertical grey bars are concentrations that do not exceed targets and vertical red bars exceed the target. The range of targets calculated for parameters with ph or hardness dependent criteria is highlighted by the black bar.