ASSESSMENTS FOR STORMWATER MONITORING AND MANAGEMENT
|
|
|
- Jennifer Young
- 5 years ago
- Views:
Transcription
1 ASSESSMENTS FOR STORMWATER MONITORING AND MANAGEMENT Eric Stein Biology Departments Southern California Coastal Water Research Project (SCCWRP)
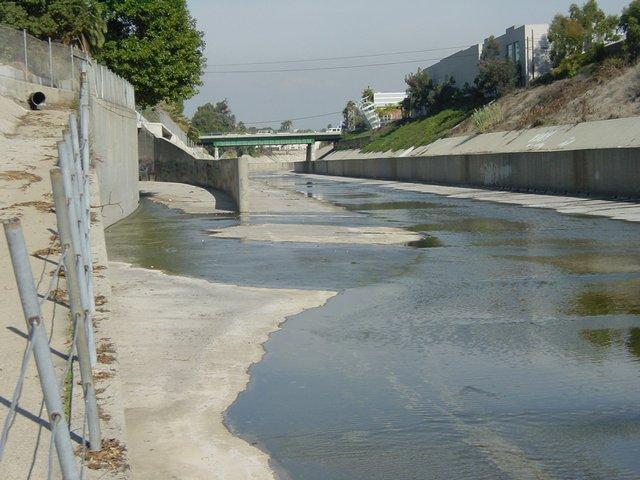
2 Effects of Stormwater Runoff

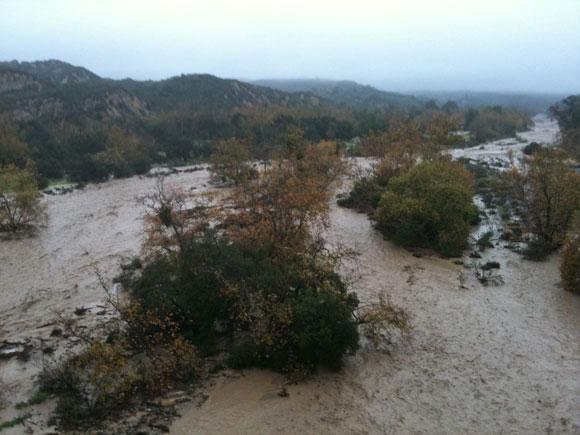

3 Stormwater Assessment is Complex
4 Monitoring and Assessment Framework 2 Conditions Monitoring and Assessment (M1) Unsatisfactory conditions Satisfactory conditions Stressor Identification Monitoring (M2) Implement management actions Source Identification Monitoring (M3) Performance Monitoring (M4)
5 Hydromodification Bioobjectives Nutrient Criteria Water Quality


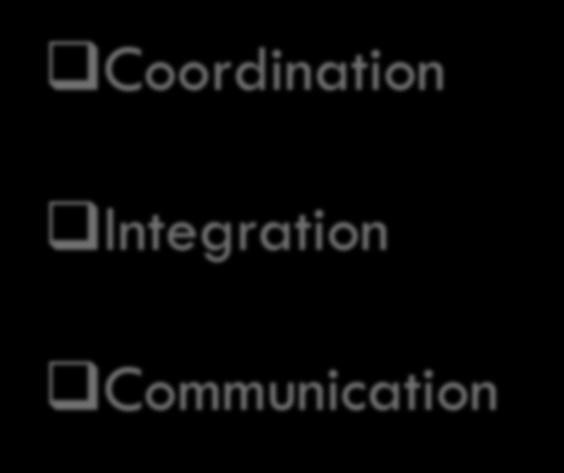
6 Don t Freak Out! Coordination Integration Communication

7 Monitoring Philosophy Monitoring data should answer real questions No data collection for data s sake Answered questions should result in management action Not enough $$ to answer all questions, so will need to prioritize the most important Provide regional context for sitespecific monitoring Identify mutual beneficial special studies

8 Need for Cooperative Monitoring Leverage resources, knowledge and experience Answer regional questions and fulfill mandates Provide relevant information that can be readily shared Provide a platform for more in-depth studies Standard tools and monitoring design Shared information management. Nested design to allow local intensification


9 Watershed Based Monitoring Start with watershed analysis Informs development of monitoring questions Priority locations Opportunities to leverage off existing programs Ability to monitor process indicators over time

10 Regional Monitoring Coalitions Ventura Co WPD Los Angeles Co DPW Los Angeles Co SD Orange County RDMD Riverside County FCD San Bernardino FCD San Diego Co DEH City of Long Beach City of Los Angeles CalTrans US EPA CA Dept. of Fish & Game SCCWRP San Diego RWQCB Santa Ana RWQCB Los Angeles RWQCB State Water Resources Control Board
 5000 500 0 18:00 20:00 22:00 00:00 02:00 04:00 06:00 08:00 10:00 12:00 14:00 16:00 18:00 20:00 22:00 0")
11 Wet vs Dry Weather Monitoring Flow (cf/s) Total PAHs (ppb) :00 20:00 22:00 00:00 02:00 04:00 06:00 08:00 10:00 12:00 14:00 16:00 18:00 20:00 22:00 0 Time (hr)


12 California s Stream Ecological Indicators Instream Biology California Stream Condition Index (CSCI) Algal IBI Physical habitat PHAB MMI Hydromodification General stream condition CRAM
13 Multiple Indicator Approach Benthic Inverts Stream Algae PHAB CRAM Chemistry Toxicity


14 Robust Statewide Monitoring Programs Algae Benthic Invertebrates Physical Habitat CRAM

15 Why use Biossessment? Use species composition to measure overall ecological integrity Integrate effects of different stresses... But... exact source of stress may be hard to identify Provide a measure of fluctuations of environmental conditions over time. Relatively inexpensive Direct measure of biological endpoint


16 Diverse Reference Network Screened > 2400 candidate reference sites Selected 586 sites Objectives: 1. Reference pool represents CA stream diversity 2. Biological at reference sites is minimally influenced by stress
17 Reference Sites Cover Key Gradients Large sheds Shed size Arid sheds Temp Conductivity High cond. sheds Rainfall Rainy sheds

18 Converting Taxa to a Score Stoneflies Mayflies Dragonflies Beetles Midges Caddisflies 1 inch

19 California Stream Condition Index (CSCI) Part A: Ecological Structure Component (pmmi) Part B: Taxonomic Loss Component (O/E) BMI Species List from Sample Taxon Mayfly species 1 Mayfly species 2 Mayfly species 3 Beetle species 1 Beetle species 2 Midge genus 1 Midge species 1 Midge species 2 Midge genus 2 Dragonfly species 1 Stonefly species 1 Stonefly species 2 Worm species 1 Worm species 2 Count Ecological Function Metrics # mayfly taxa # predator taxa % sediment tolerant taxa % non-insect taxa Species Loss Component Scores are adjusted to account for major natural gradients Elevation Latitude Longitude Conductivity PPT, Temp Mineral Content Both components adjust for environmental setting CSCI is a simple average of the two scores 19
20 How does the CSCI Compare to Previous Indices? Much better reference data set Bigger, broader, and more rigorously screened More comprehensive assessment of biological integrity Statewide applicability, without regionalization Nearly all perennial wadeable streams can be assessed Formal tests of applicability are possible More lines of evidence than most indices Site-specific expectations means that your site is held to appropriate standards


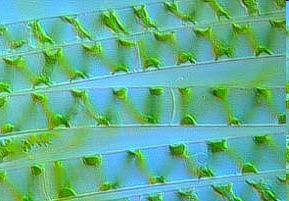
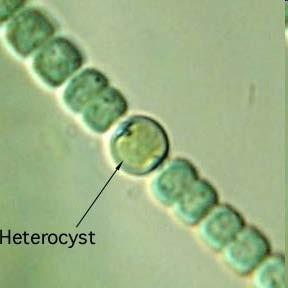
21 Benthic Algae IBIs soft-bodied algae (& cyanobacteria) diatoms
22 Why Add Algae to Bioassessment? Information complementary to bugs Response to different stressors Strongest responses evident over different ranges of disturbance Weight of evidence Potential for broader range/flexibility in interpretation of results Applicability on different substrate types


23 Diagnostic Assessments Soft-bodied Diatoms

24 Hydromodification Field Screening Tool Classify streams by: Likely severity of response Likely direction of response Decision trees Clear endpoints very high, high, medium, low Simple to apply field metrics Does not rely on complex field measures Locally calibrated Rapid - < 1 day in office + 1 day in field
 2 1 0 30 40 50 60 70 80 90 Bank Angle (degrees)")
25 Field Indicators + Empirical Relationships Stable 10% Risk 50% Risk 90% Risk Unstable 4 3 Bank Height (m) Bank Angle (degrees)


26 Physical Habitat (PHAB) MMI
27 PHAB MMI Metrics Condition Categories Riparian condition Substrate condition Productivity Channel equilibrium Riparian condition Index under development Candidate Metrics Percent Presence of Macroalgae Percent Stable Banks Percent Fast Water of Reach Natural Shelter cover - SWAMP Mean Mid-Channel Shade Canopy cover Riparian Vegetation All 3 Layers CPOM Presence Particle Size Median (d50) Percent Substrate <2 mm

28 California Rapid Assessment Method (CRAM) Field-based, rapid tool to assess condition Applicable to all wetland types, including streams Based on readily observable field indicators Evaluates broad suite of conditions Validated with more intensive measures of condition
29 CRAM Attributes Wetland Condition Landscape Context Hydrology Physical Structure Biotic Structure CRAM recognizes four attributes of wetland condition Each attribute is represented by 2-3 metrics, some of which have sub-metrics.
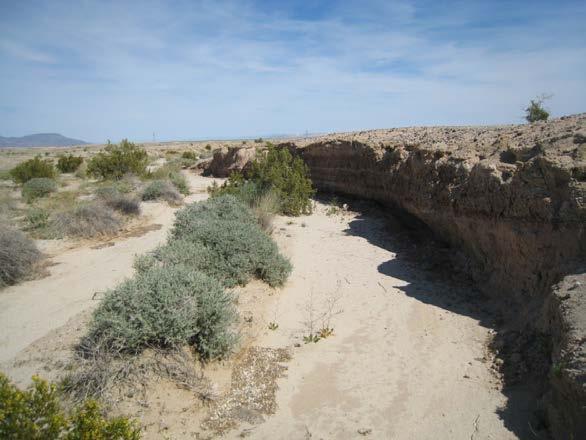
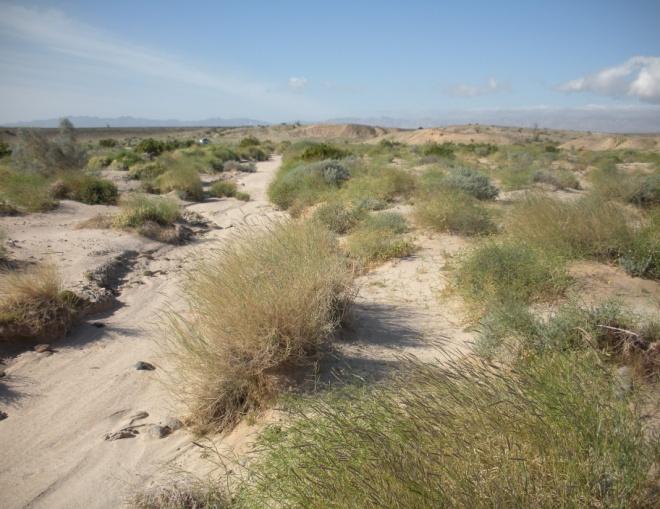
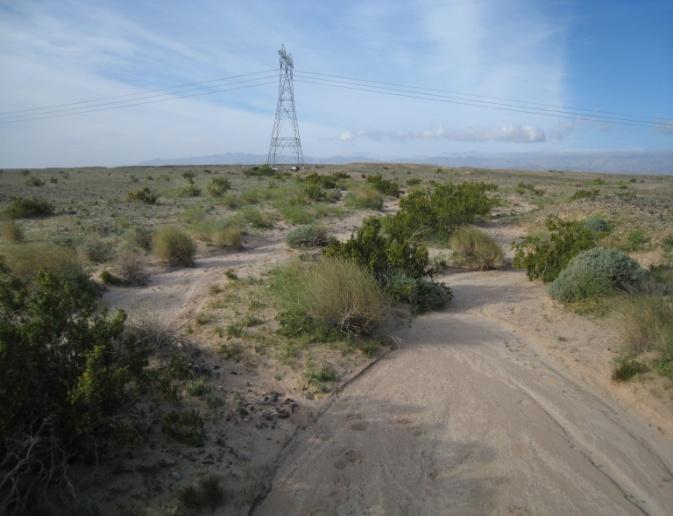
30 Emerging Indicators for Nonperennial Streams


31 What About Stress? Benthic Inverts Stream Algae PHAB CRAM Chemistry Toxicity

32 100 Reproduction 80 Survival % Stream Length Toxic to reproduction 20 0Non-toxic Region Agricultural Open Urban
33 Risk Factors Higher risk: Habitat degradation High nutrients Lower risk Conventional toxicants Analysis show correlation, not causation Working on integrated assessment

34 Common Data Platforms Benthic invertebrates, Algae, Chemistry, Toxicity CRAM, Chemistry, Toxicity, + Project info


35 Communication SWRCB-USEPA Healthy Watersheds Initiative

36 Hydromodification Bioobjectives Nutrient Criteria Water Quality


37 Coordination Bioobjectives Integration Water Quality Communication Nutrient Criteria
38 Final Thoughts Questions drive monitoring True benefits will only be realized over the long-term Need long-term implementation mechanisms Monitoring data contributes to new knowledge Data must be made broadly available


39 Thank You Eric Stein