Effects of Stormwater
|
|
|
- Marilynn Cannon
- 5 years ago
- Views:
Transcription


 Treatment (particle size characteristics and")


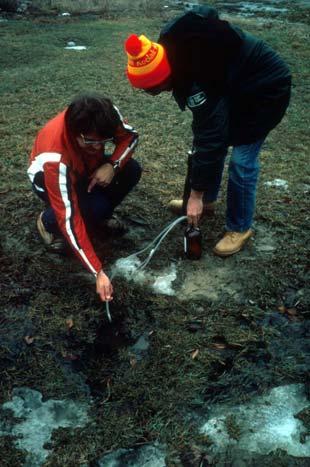
1 The Science of Stormwater - Effects - Sources and Characterization -Control Robert Pitt Department of Civil, Construction and Environmental Engineering The University of Alabama Tuscaloosa, AL Issues to be Addresses as Part of a Stormwater Management Program Receiving water problems (objectives and uses, fate and transport, toxicology, etc.) Pollutant and flow sources (exposure and movement, soil processes, contamination processes, etc.) Treatment (particle size characteristics and quality, filtered fraction, chemicalassisted treatment, disinfection, pollution prevention, etc.) Photo by Lovena, Harrisburg, PA Effects of Stormwater Evaluation Monitoring What is going on in the receiving water? What are natural conditions? What conditions should be expected for your specific conditions? What is a good control for comparison? Monitoring guidance book published by CRC Press, August pgs. Contains many evaluation monitoring case studies. Is the receiving water responding to improved stormwater management? book%2by%2%2burton%2and%2pitt%2book/mainedfs_book.html 1


 1.")
 9 3")
 38 34 Exceedence for Ultimate")
2 Figure and Table from Center for Watershed Protection Urban Steam Classification Channel Stability Aquatic Life Biodiversity Sensitive 1% Imperviousness Stable Good/Excellent Impacted 11 25% Imperviousness Unstable Fair/Good Damaged 26 1% Imperviousness Highly Unstable Poor Rv Volumetric Runoff Coefficients and Expected Biological Conditions Good Directly Connected Impervious Area (%) Sandy Soil Rv Silty Soil Rv Clayey Soil Rv Based on modeling several hundred neighborhoods representing many land uses in Jefferson Co, AL. Can now calculate the expected effects and magnitude of needed changes to achieve targeted conditions. Fair Poor Hours of Exceedence of Developed Conditions with Zero Runoff Increase Controls Compared to Predevelopment Conditions (MacRae (1997) Recurrence Interval (yrs) 1.1 (critical mid-bankfull conditions) 1.5 (bankfull conditions) Existing Flowrate (m 3 /s) Exceedence for Predevelopme nt Conditions (hrs per 5 yrs) 9 3 Exceedence for Existing Development Conditions, with ZRI Controls (hrs per 5 yrs) Exceedence for Ultimate Development Conditions, with ZRI Controls (hrs per 5 yrs) 9 12 Can calculate the hours of exceedence of various flow targets for different development scenarios 2
 Habitat destruction (mostly through high flows and sedimentation)")
 Pathogens (mostly from municipal wastewater and agricultural")

 Biological (community tolerance) Physical/habitat (ecological")

3 Receiving Water Effects of Water Pollutant Discharges Sediment (amount and quality) Habitat destruction (mostly through high flows and sedimentation) Eutrophication (nutrient enrichment) Low dissolved oxygen (from organic materials) Pathogens (mostly from municipal wastewater and agricultural runoff) Toxicants (heavy metals and organic toxicants) Temperature Debris and unsafe conditions etc. Major Components of Receiving Water Assessments Chemical (major impairments and uses) Biological (community tolerance) Physical/habitat (ecological integrity) Toxicity (availability of chemical contaminants) The complexities of ecosystems require that these assessment tools be used in an integrated manner. Sources and Characteristics of Stormwater Contaminants 3


4 Toronto Industrial Area (monitored data) (Pitt and McLean 1986) 4
5 Street Dirt Chemical Quality (mg/kg) (Milwaukee, WI; San Jose, CA; Bellevue, WA; Toronto, Canada; Reno, NV; Champaign, IL) Phosphorus (P) Total Kjeldahl Nitrogen Chemical Oxygen Demand , 34, Copper (Cu) Lead (Pb) Zinc (Zn) Cadmium (Cd) Chromium (Cr) < Pitt, Bannerman, and others Total Particulate Loading, Keyes Good Asphalt Test Area Field Observations of Particulate Removal Using Street Sweeping 6 6 Percentage of Particle Sizes Removed by Street Sweeping < Very Rough Streets Particle Sizes Ranges (microns) >637 Overall Percentage of Particle Sizes Removed by Street Sweeping < Smooth Streets Particle Sizes Ranges (microns) >637 Overall Pitt
6 Washoff of Street Dirt during about 5 Rain Events, Bellevue, WA Particle Resuspension Rates Caused by Vehicle Passage for an Asphalt Road Pitt 1985 Bedload in corrugated stormdrain and mound of settleable material at discharge into wet detention pond after many years of operation at ski resort at Snowmass, CO (drain from several acre resort parking area having sand applications for traction control). Pollutant Accumulations in 2+ Bellevue, WA, Residential/Commercial Area Catchbasins (kg/ha/yr) (Pitt 1985) Total Solids COD TKN.7.17 TP.7.25 Lead.7.49 Zinc.2.1 Baseflow total solids discharge: 11 kg/ha/yr (outfall) Stormwater: 21 kg/ha/yr (outfall) Captured at inlet sump: 1 to 147 kg/ha/yr (inlet) Coarse material that can be captured in catchbasin sumps may be a sizeable fraction of total annual discharges to inlet. 6


 Measured Particle Sizes,")
7 Coulter Counter analysis Before Pre-Sieving Particles Large particles Sieve After Pre-Sieving Sample & Electrolyte Filters and sieves at.45, 2, 45, 75, 15, and 25 µm (sub-sampled using cone splitter), are also used to capture particulates for analyses. Cummulative Mass of Particulate Solids (% Smaller than Size Indicated) Inlets Roofs Mixed Particle Size Distributions Particle size distributions can vary greatly at source areas, but outfall samples have little mass associated with particles greater than about 1 µm Particle Size (µm) Measured Particle Sizes, Including Bed Load Component, at Monroe St. Detention Pond, Madison, WI (including bedload samples) 7
 Toxicity tests after sieving through")


 only reaches about.")
8 Suspended Solids Control at Monroe St. Detention Pond, Madison, WI (USGS and WI DNR data) Toxicity tests after sieving through smaller and smaller sieves show decreasing residual toxicity. Most toxicity associated with 1 to 8 µm size range in this example from several industrial loading docks. Hydrodynamic Effects on Scour of Sediment from Catchbasin Sump The impact force of the waterfall coming from the pipe inlet is considerably higher than when the inlet is rectangular gutter flow. Physical and 3D-CFD Modeling In the case of the rectangular inlet (left) the jet (with velocity magnitudes of about 1.2 m/s) only reaches about.15 m below the outlet; in contrast, the jet reaches about.5 m below the outlet when the inlet is circular. Steady-state velocity vectors ranged between and 2. m/s. Flow rate: 2 L/s, Sediment level below the outlet:.8 m. CFD modeling being verified by fullscale 3D flow field measurements 8


9 Sediment Scour for Different Flows and Water Depths over Sediment Anodic Stripping Voltammetry with Controlled Growth Mercury Electrode Roof runoff sample after UV exposure (5 and 1ppb standard additions) Detection Limits (5 min) Cu Pb Cd Zn Shear stress on the sediment layer at different elevations in a conventional manhole with a rectangular inlet of.8-m wide, and initial suspension threshold for different particle sizes. Series of graph classified by flow rate: 4, 2, 1, 5, and 2 LPS Zn Cd Pb Cu 3.32 µg/l Organo-Metallic Complexes and Colloidal vs. Ionic Forms of Metals Copper (µg/l) Before UV After UV Inlets Roofs Mixed Filtered Sample Ionic and Colloidal Distributions (Tuscaloosa, AL outfall samples) Analyte % Ionic % Colloidal Magnesium 1 Calcium Zinc Iron 97 3 Chromium Potassium Lead Copper Cadmium 1 9 Enhanced stormwater treatment must also focus on dissolved fraction of pollutants, including ionic forms of metals. 9
 and percentage partition into particulate matter and water % reduction 7 6 5 4 3 2 1 Toxicity 2 4 6 8 1 12-1 Alum usually")
10 1 9 8 Example Stormwater Turbidity, Lead and Copper Reductions using Chemical Coagulation and Precipitation Lead Copper Fate of Stormwater PAHs after Discharge Model calculations for PAHs led to following graphical relationship between octonal-water coefficients (k ow ) and percentage partition into particulate matter and water % reduction Toxicity Alum usually had adverse toxicity effect, while ferric chloride with microsand gave best overall reductions. Buffered Aluminum Sulfate (mg/l) Turbidity % by weight in particulates Mostly in Water Mostly in Solids log Kow Fates of Stormwater PAHs Most of the PAHs partition into the sediment and water phases, with sediment being the dominant phase High organic content of particulate matter increases particulate-bound fraction of most PAHs Sediment 75% Air 7% Pyrene Water 18% Examples of fugacity partitioning calculation results Air Water 1% 3% Sediment 96% Dibenzo(a,h)anthracene Concentration (ug/kg) Concentration (ug/kg) Concentration (ug/kg) <45 <45 < Pyrene Size (um ) Indeno(1,2,3-cd)pyrene Size (um) Benz(a)anthracene Size (um) >28 >28 >28 Current UA research on PAH concentrations by particle size. The largest size is mostly leaves and other gross organic litter. This large-sized material can comprise a large fraction of the total sediment captured in a sump, or as creek sediment, but is a small amount in the runoff. Concentration (ug/kg) Concentration (ug/kg) Concentration (ug/kg) < Benz(b)floranthrene Size (um ) Fluoranthene < <45 > >28 Size (um ) Chrysene Size (um) >28 1

 Developed Tracers to Identify and Locate Inappropriate Discharges Land")
 Overall (377) 5,8 17, Residential (169) 7,75 24, Commercial (497)")
")
11 Example copper and phosphorus concentrations as a function of particle size, showing typically higher concentrations with smaller particles Bacteria Sources Observed Bacteria Data in the National MS4 Database (wet weather flows) Developed Tracers to Identify and Locate Inappropriate Discharges Land Use (number of observations) Fecal Coliform (MPN/1 ml) Fecal Streptococcus (MPN/1 ml) Overall (377) 5,8 17, Residential (169) 7,75 24, Commercial (497) Industrial (524) Freeways (185) 4,55 2,5 1,7 1,8 13, 17, Fluorescence clearly separates contaminated water sources from clean water sources Open Space (68) 3,1 24, 11


12 Comparison of E. coli from areas frequented by urban animals vs. areas having fewer animals Comparison of E. coli from Sewage with Wet Weather Sheetflow Samples Stormwater v/s Sewage -E. coli.25 ROOF PRONE p-value % Sewage in clear water ROOF NOT PRONE STREETS PRONE STREETS NOT PRONE PARKING LOT PRONE PARKING LOT NOT PRONE OPEN SPACE PRONE OPEN SPACE NOT PRONE If the E. coli is >3,5 MPN/1 ml, it likely originates from domestic sewage (with a 95% confidence level). Lower levels can originate from stormwater sources. This information and appropriate modeling can be used to identify sources of pollutants and flows Control of Stormwater Overall strategy Critical source area treatment Protection of groundwater 12
 are common, but little runoff.")


13 Example of design of integrated program to meet many objectives Smallest rains (<.5 in.) are common, but little runoff. Exceed WQ standards, but these could be totally infiltrated Years of Observed Milwaukee Rainfall Medium-sized storms (.5 to 1-1/2 in.) account for most of annual runoff and pollutant loads. Can be partially infiltrated, but larger rains will need treatment Critical.5 to 1.5 inch events circled Example of monitored rain and runoff distributions during NURP. Similar plots for all locations, just shifted. Large rains (>1-1/2 in.) need energy reduction and flow attenuation for habitat protection and for flood control /25/5 2/15/56 8/7/61 1/28/67 7/2/72 1/1/78 7/3/83 12/23/88 Design Issues (<.5 inches) Most of the events (numbers of rain storms) Little of annual runoff volume Little of annual pollutant mass discharges Probably few receiving water effects Problem: pollutant concentrations likely exceed regulatory limits (especially for bacteria and total recoverable heavy metals) for each event WI DNR photo WI DNR photo Suitable Controls for Almost Complete Elimination of Runoff Associated with Smallest Rains (<.5 in.) Disconnect roofs and pavement from impervious drainages Grass swales Porous pavement walkways Rain barrels and cisterns 13
 Annual roof")

 Planted green roof (but will need to irrigate during dry periods)")
 13 66 75 84 Seattle, Wash. (33.4 in.) 21 67 77 87 Phoenix, Arizona (9.")
 Majority of annual runoff volume and pollutant discharges")

 87 1 96% Suitable Controls for Treatment of Runoff from")
 Initial portion will be captured/infiltrated by on-site controls or")
14 Calculated Benefits of Various Roof Runoff Controls (compared to typical directly connected residential pitched roofs) Annual roof runoff volume reductions Flat roofs instead of pitched roofs Cistern for reuse of runoff for toilet flushing and irrigation (1 ft. diameter x 5 ft. high) Planted green roof (but will need to irrigate during dry periods) Disconnect roof drains to loam soils Birmingham, Alabama (55.5 in.) Seattle, Wash. (33.4 in.) Phoenix, Arizona (9.6 in.) 25% 88% 84% 91% Design Issues (.5 to 1.5 inches) Majority of annual runoff volume and pollutant discharges Occur approximately every two weeks Problems: Produce moderate to high flows Produce frequent high pollutant loadings Rain garden with amended soils (1 ft. x 6.5 ft.) % Suitable Controls for Treatment of Runoff from Intermediate-Sized Rains (.5 to 1.5 in.) Initial portion will be captured/infiltrated by on-site controls or grass swales Remaining portion of runoff should be treated to remove particulate-bound pollutants 97% Runoff Volume Reduction Residential rain garden performance for.7 inch rain Land and Water, Sept/Oct
 Larger events in category are drainage")


15 Design Issues (1.5 to 3 inches) Larger events in category are drainage design storms Establishes energy gradient of streams Occurs approximately every few months (once to twice a year) Problems: Unstable streambanks Habitat destruction from damaging flows Sanitary sewer overflows Nuisance flooding and drainage MD photo WI DNR photo Controls for Treatment of Runoff from Drainage Events (1.5 to 3 in.) Infiltration and other on-site controls will provide some volume and peak flow control Treatment controls can provide additional storage for peak flow reduction Provide adequate stormwater drainage to prevent street and structure flooding Provide additional storage to reduce magnitude and frequency of runoff energy Capture sanitary sewage overflows for storage and treatment Combinations of Controls Needed to Meet Many Stormwater Management Objectives Smallest storms should be captured on-site for reuse, or infiltrated Design controls to treat runoff that cannot be infiltrated on site Provide controls to reduce energy of large events that would otherwise affect habitat Provide conventional flood and drainage controls Pitt, et al. (2) Critical Source Area Treatment 15
16 Different Pilot-Scale Treatment Setups Location Seattle, WA Portland, ME Milwaukee, WI Phoenix, AZ Atlanta, GA Flow Rate Needed for Different Levels of Annual Flow Treatment (gpm/acre pavement) 5% % %


")
 85 (1 mg/l)")
 Copper 9 (3 µg/l) 65 (15 µg/l) Lead 96 (1.")
 Benzo (b) fluoranthene >95 (<.1 µg/l) >75 <.")
17 Multi-Chambered Treatment Train (MCTT) developed during EPA research to protect groundwater during infiltration MCTT incorporates many complementary removal processes (grit removal, fine sediment removal, gross floatable trapping, free oil sorption, ion exchange, etc.) This underground MCTT is in Minocqua, WI. Minocqua full-scale samples Wisconsin Full-Scale MCTT Test Results Pilot-Scale Test Results (median % reductions and median effluent quality) Milwaukee (15 events) Minocqua (7 events) Suspended Solids >98 (<5 mg/l) 85 (1 mg/l) Phosphorus 88 (.2 mg/l) >8 (<.1 mg/l) Copper 9 (3 µg/l) 65 (15 µg/l) Lead 96 (1.8 µg/l) nd (<3 µg/l) Zinc >91 (<2 µg/l) 9 (15 µg/l) Benzo (b) fluoranthene >95 (<.1 µg/l) >75 <.1 µg/l) Phenanthrene 99 (<.5 µg/l) >65 (<.2 µg/l) Pyrene 98 (<.5 µg/l) >75 (<.2 µg/l) 17


18 Upflow filter insert for catchbasins (miniaturize MCTT features for smaller areas and with higher flow capacity) Able to remove particulates and targeted pollutants at small critical source areas. Also traps coarse material and floatables in sump and away from flow path. Upflow Filter TM Flow (gpm) Pelletized Peat, Activated Carbon, and Fine Sand y = 2.238x.8516 R 2 = Headloss (inches) EPA-funded SBIR2 Field Test Site Monitoring Equipment, Tuscaloosa, AL Operation during normal and bypass conditions 18

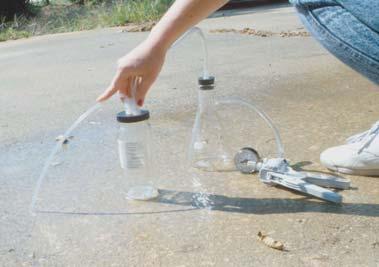
19 116 ft 75 ft Particulate Trapping in Grass Filters and Swales Low Flow Extensions of Historic Stillwater, OK, Retardance Curves 25 ft 6 ft 3 ft 2 ft Head ( ft) Zoysia grass swale Test Date: 1/11/24 From such graphs swale hydraulic characteristics can be predicted d on the basis of flow rate, cross sectional geometry, slope, and vegetation type. Total Suspended Solids(mg/L) Blue grass 1%_1gm 1%_15gm 1%_2gm 3%_1gm 3%_15gm 3%_2gm 5%_1gm 5%_15gm 5%_2gm Head works distance (ft) Percent reduction (%) Grass Filtering as a Function of Grass Height, Particle Settling, and Flow Length Ratio: - 1. Ratio: Ratio: Total Dissolved Solids (<.45 µm) G Settling frequency 19
 Sandy Soils Clayey Soils Infiltration")

 Soil Texture Sandy Loam Silt Loam Clay Loam Compaction Method")
 1.595 1.653 1.992 1.54 1.593 1.69 1.52 1.73 1.")

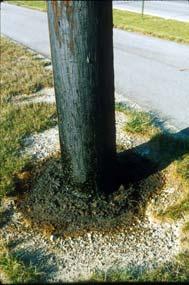
20 Disturbed Urban Soils during Land Development Infiltration Rates in Disturbed Urban Soils (AL tests) Sandy Soils Clayey Soils Infiltration rates of urban soils are strongly influenced by compaction, probably more than by moisture saturation. Pitt, et al Long-Term Sustainable Average Infiltration Rates (3 of 15 textures tested) Soil Texture Sandy Loam Silt Loam Clay Loam Compaction Method Hand Standard Modified Hand Standard Modified Hand Standard Modified Dry Bulk Density (g/cc) Effects on Root Growth (per NRCS) May Affect May Affect Restrict May Affect May Affect May Affect + May Affect Restrict Restrict Long-term Average Infilt. Rate (in/hr)

 Surface Infiltration after Sedimentation plus sorption/ionexchange (MCTT and bioretention) Fluoranthene,")
 Lindane, chlordane")
 Coarse gravel Fine sand Loam soil Activated carbon, peat, and sand.")
21 Groundwater Contamination Potential with Stormwater Infiltration Enhanced infiltration increases water movement to groundwater compared to conventional development. Care must also be taken to minimize groundwater contamination potential. Natural forces and management attempts to increase infiltration in compacted soils. Nature much better at this than we are. Book published by Ann Arbor Press/CRC, 219 pages. 1996, based on EPA research. Moderate to High Contamination Potential (Worst Case Sandy Soils with Limited Organic Content) Surface Infiltration after Sedimentation plus sorption/ionexchange (MCTT and bioretention) Fluoranthene, pyrene Enteroviruses Chloride Surface Infiltration with Some Pretreatment (grass filters, biofiltration with marginal soils) Lindane, chlordane Benzo (a) anthracene, bis (2-ethylhexl phthalate), fluoranthene, pentachlorophenol, phenanthrene, pyrene Enteroviruses Chloride Injection after Minimal Pretreatment (dry wells, gravel trenches, and most porous pavements) Lindane, chlordane 1,3-dichlorobenzene, benzo (a) anthracene, bis (2-ethylhexl phthalate), fluoranthene, pentachlorophenol, phenanthrene, pyrene Enteroviruses, some bacteria and protozoa Nickel, chromium, lead, zinc Chloride Capture of Stormwater Particulates by Different Soils and Amendments Porous pavement surface (asphalt or concrete) Coarse gravel Fine sand Loam soil Activated carbon, peat, and sand.45 to 3µm % % 1% % 4% 3 to 12µm % % 33% % 45% 12 to 3µm % % 85% % 8% 3 to 6µm 1% % 9% % 1% 6 to 12µm 25% % 1% 25% 1% 12 to 25µm 5% % 1% 5% 1% >25µm 1% 1% 1% 1% 1% Final underdrain quality is usually greater than 1 to 25 mg/l TSS 21

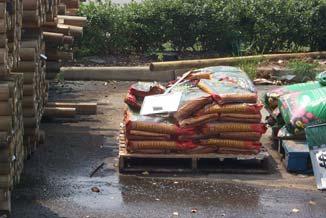
22 Effects of Compost-Amendments on Runoff Properties Soil modifications for rain gardens and other biofiltration areas can significantly increase treatment and infiltration capacity compared to native soils. Six to Eleven Times Increased Infiltration with Modified Soils UW test plot 1 Alderwood soil alone UW test plot 2 Alderwood soil with Ceder Grove compost (old site) UW test plot 5 Alderwood soil alone UW test plot 6 Alderwood soil with GroCo compost (old site) Average Infiltration Rate (in/h) Changes in Mass Discharges for Plots having Amended Soil Compared to Unamended Soil Constituent Runoff Volume Phosphate Ammonia Nitrate Copper Zinc Surface Runoff Mass Discharges Subsurface Flow Mass Discharges.29 (due to ET) Increased mass discharges in subsurface water pollutants observed for many constituents (new plots). Treatment Trains can Result in Consistently Low Effluent Concentrations Constituent and units Particulate solids (mg/l) Phosphorus (mg/l) TKN (mg/l) Cadmium (µg/l) Copper (µg/l) Lead (µg/l) Zinc (µg/l) Reported irreducible concentrations (conventional highlevel stormwater treatment) 1 to 45.2 to.3.9 to Effluent concentrations with treatment train using sedimentation along with sorption/ion exchange <5 to 1.2 to to 15 3 to 15 <2 Stormwater Conservation Design Practices Can Also Help Discharge (cfs) Attain Habitat Goals Related to Energy Discharges Flow Duration Curves are Ranked in Order of Peak Flows Bottom Set: Biorentention Swales and Bioretention Pond and Bioretention Pond, Swales and Bioretention Top Set: No Controls Swales Middle Set: Pond Pond and Swales % Greater than Discharge Rate 22

23 Sediment Reductions Volume Reductions 23