Restoring the Chesapeake Bay Challenges & Opportunities
|
|
|
- Georgina Washington
- 5 years ago
- Views:
Transcription

1 Restoring the Chesapeake Bay Challenges & Opportunities Jeff Corbin Senior Advisor for Chesapeake Bay U.S. EPA May 29, 2014
2
3 A few things to talk about History of Bay Restoration How are we doing? What are the Challenges/Obstacles? What is our approach moving forward?

4 Largest estuary in North America 3,600 species of fish, wildlife, and plants Economic value: approx. $1 trillion Seafood Estimated 77,000 farms Home to almost 17 million people Six states and District of Columbia About 1,650 local governments What happens on the land is felt in the Bay and local waterbodies
5
6
7
8 A Bit of History Series of Agreements & Commitments 1983 (1 page) There s a Problem Work Together 1987 (7 pages) 40% Reduction in Nutrients 1992 (back to 3 pages) Work Upstream Develop Tributary Strategies 1996 Tributary Strategies 1999 Consent Decree TMDLs 1999 Bay and Tidal Rivers listed on 303(d) List
9 More History More Tributary Strategies 2000 Chesapeake 2000 Agreement - (100+ commitments) Beyond 40% - Delist the Bay and Rivers 2005 State-wide Tributary Strategy VA Annual Bay & River Clean-Up Plans May 2009 Presidential Executive Order December 2010 Bay TMDL June 2014 New Chesapeake Watershed Agreement
10 PROGRESS PROGRESS
11


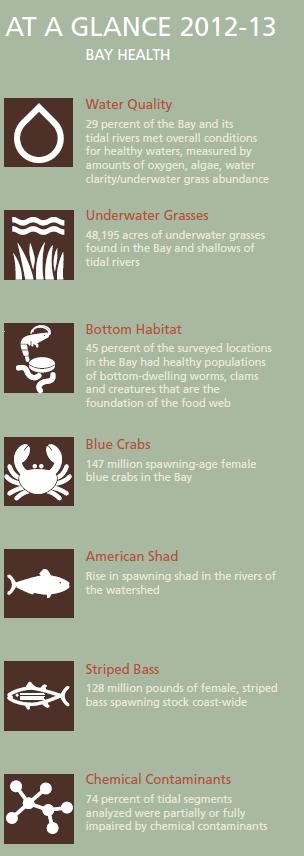
12 Crabs are not overfished Shad show a positive return to rivers Bay grasses both challenged & resilient Chemical contaminants are a concern Water quality still challenged

13 Female striped bass spawning stock biomass measured 128 million pounds in
14
15 Bay Health is Improving State of the Bay up 10% in 5 Years Dead Zones Shrinking nd smallest since 1985 Declining since 1980s (Johns Hopkins/UMCES) Crab Population Rebounding Oysters Turning the Corner??
16 Resiliency Increasing Less Impact from Extreme Weather Oysters Surviving SAV Flourishing
 and")

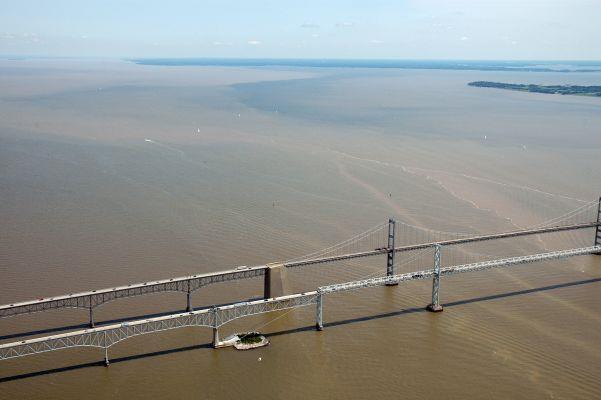
17 Precipitation affects river flow (blue line) and the amounts of nutrients and sediments that wash downstream

18 2013 estimates of CBP partners progress to reduce Nitrogen Approximately 262 million pounds nitrogen delivered to Bay in 2013
 3 degrading (10%) 6 not significant")
19 Flow-adjusted Total Nitrogen Trends at 30 sites improving (70%) 3 degrading (10%) 6 not significant (20%)

20
21 Land to Water Ratio Relative W atershed Sizes (metric units) Chesapeake Bay Gulf of Finland Arabian (Persian) Gulf Baltic Sea Great Lakes Sea of Cortez North Sea Black Sea Red Sea Mediterranean Sea Gulf of Mexico South China Sea Sea of Japan Watershed/Volume Ratio Land-to-water ratio is 14:1; largest of any coastal water body in the world.


22 Watershed population has more than doubled since 1950
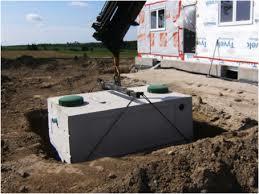
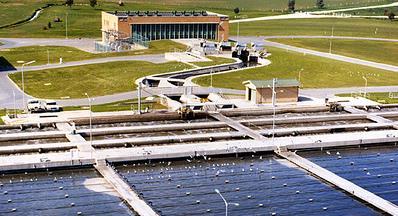
23 Wastewater
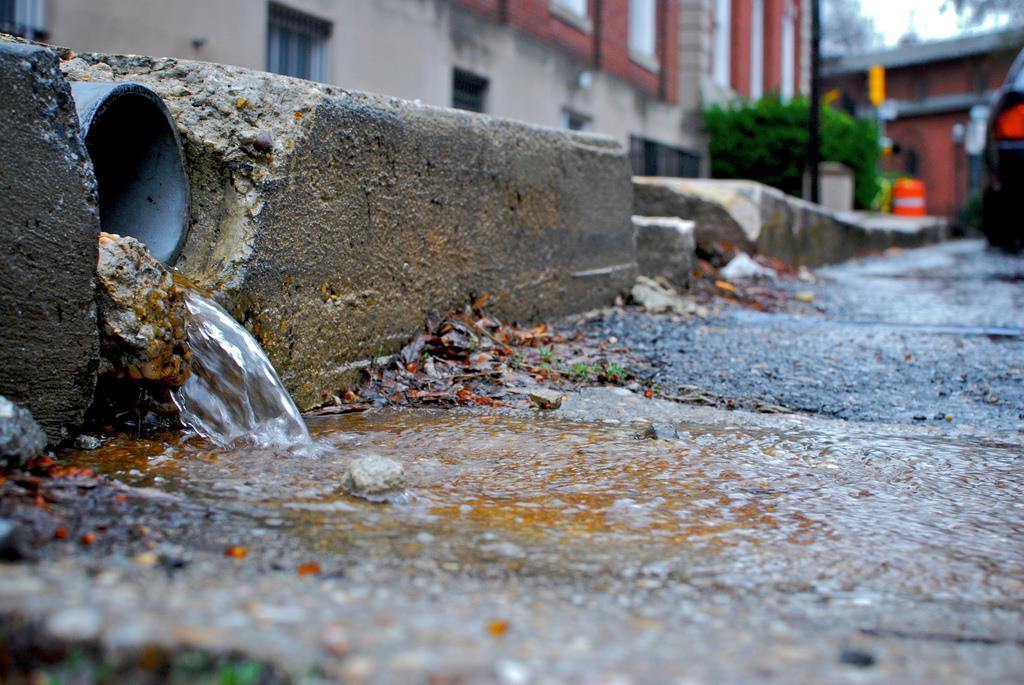
24 Stormwater
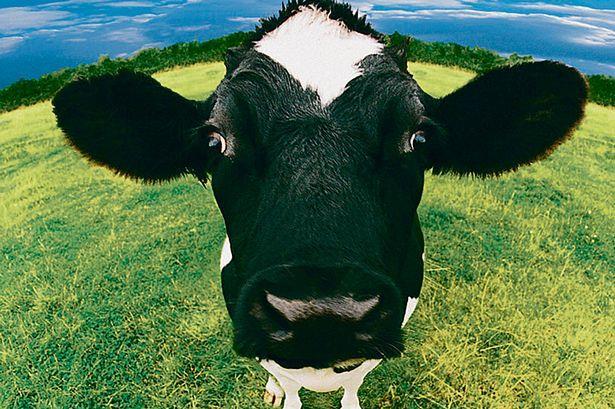
25 Agriculture
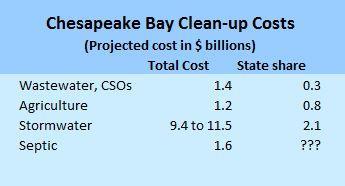
26

27 Shrinking Budgets
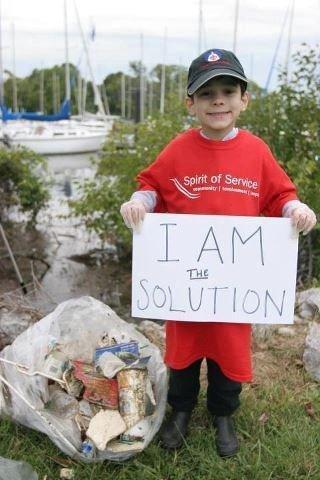
28 INNOVATE All Public Funds? No Way Market-Based Systems Private Capital Private Partnerships 3-25 T&I Hearing Agriculture Manure-to-Energy New Ideas/Technologies in Urban Oysters (aquaculture)? Algae? Individual Homeowners Business Community???

29 So What Are We Doing About It?
30 Prong 1 President s Executive Order Prong 2 Total Maximum Daily Load Prong 3 Voluntary Bay Agreement **New and Improved**


31 EO Chesapeake Bay Strategy May 12, 2010
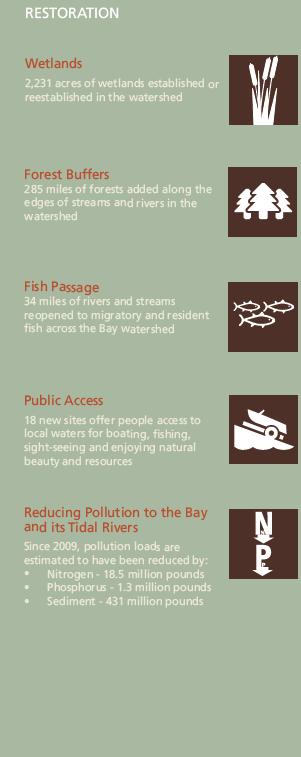
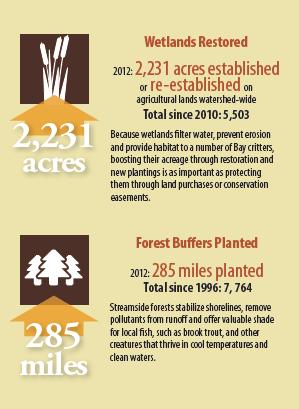
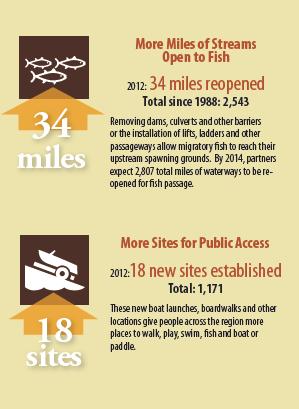
32 EO Strategy Goals and Outcomes RESTORE CLEAN WATER GOAL: Reduce nitrogen, phosphorus, sediment and other pollutants to meet Bay water quality goals for dissolved oxygen, clarity and chlorophyll-a and toxic contaminants. WATER QUALITY OUTCOME: Meet water quality standards for dissolved oxygen, clarity/underwater grasses and chlorophyll-a in the Bay and tidal tributaries by implementing 100 percent of pollution reduction actions for nitrogen, phosphorus and sediment no later than 2025, with 60 percent of segments attaining standards by STREAM RESTORATION OUTCOME: Improve the health of streams so that 70 percent of sampled streams throughout the Chesapeake watershed rate three, four, or five (corresponding to fair, good or excellent) as measured by the Index of Biotic Integrity, by AGRICULTURAL CONSERVATION OUTCOME: Work with producers to apply new conservation practices on 4 million acres of agricultural working lands in high-priority watersheds by 2025 to improve water quality in the Chesapeake Bay and its tributaries. RECOVER HABITAT GOAL: Restore a network of land and water habitats to support priority species and to afford other public benefits, including water quality, recreational uses and scenic value across the watershed. WETLAND RESTORATION OUTCOME: Restore 30,000 acres of tidal and non-tidal wetlands and enhance the function of an additional 150,000 acres of degraded wetlands by FOREST BUFFER OUTCOME: Restore riparian forest buffers to 63 percent, or 181,440 miles, of the total riparian miles (stream bank and shoreline miles) in the Bay watershed by FISH PASSAGE OUTCOME: Restore historical fish migratory routes by opening 1,000 additional stream miles by 2025, with restoration success indicated by the presence of river herring, American shad and/or American eel. SUSTAIN FISH & WILDLIFE GOAL: Sustain healthy populations of fish and wildlife, which contribute to a resilient ecosystem and vibrant economy. OYSTER OUTCOME: Restore native oyster habitat and populations in 20 tributaries out of 35 to 40 candidate tributaries by BLUE CRAB OUTCOME: Maintain sustainable blue crab interim population target of 200 million adults (1+ years old) in 2011 and develop a new population rebuilding target for BROOK TROUT OUTCOME: Restore naturally reproducing brook trout populations in headwater streams by improving 58 sub-watersheds from reduced classification (10-50 percent of habitat lost) to healthy (less than 10 percent of habitat lost) by BLACK DUCK OUTCOME: Restore a three-year average wintering black duck population in the Chesapeake Bay watershed of 100,000 birds by CONSERVE LAND AND INCREASE PUBLIC ACCESS Conserve landscapes to maintain water quality, habitat, sustainable working forests, farms and maritime communities; and cultural, community and indigenous values. It will also expand public access to the Bay and its tributaries through existing and new federal, state, and local parks, refuges, reserves, trails and partner sites. LAND CONSERVATION OUTCOME: Protect an additional 2 million acres of lands throughout the watershed currently identified as high conservation priorities at the federal, state or local level by 2025, including 695,000 acres of forest land of highest value for maintaining water quality. PUBLIC ACCESS OUTCOME: Increase public access to the Bay and its tributaries by adding 300 new public access sites by 2025.
33 Key Initiatives by Goal Restore Clean Water Bay TMDL, Stormwater Rule, CAFO Rule, Stormwater/EISA Requirements for Federal Lands, Toxic Contaminants Agriculture Target conservation practices in high priority watersheds, Identify the most effective conservation practices, Establish Showcase projects in small watersheds Recover Habitat Priority Chesapeake Marshes and Wetlands, Farm Bill Conservation Programs, Stream Restoration and Fish Passage Initiatives, Forest Restoration Strategy Sustain Fish & Wildlife Bay-wide Oyster Strategy, Restore Stream Habitat, Restore Black Duck Habitat, Sustaining Blue Crabs Conserve Land and Increase Public Access GIS-based Land Conservation Prioritization System, Strategy to Reduce the Loss of Farms and Forests, Public Access Plan
34 Key Initiatives by Supporting Strategy Strengthen Science Improve tools to target water-quality actions and land conservation, Establish a Monitoring Alliance, Increase CBP science capacity from EO federal science actions Respond to Climate Change Adaptation studies and vulnerability assessments, Improve tools and techniques to support habitat restoration and adaptation Expand Citizen Stewardship Environmental Literacy Strategy, Chesapeake Conservation Corps Expansion, Small Watershed and other matching grants Develop Environmental Markets Offsets Guidance for States (EPA), Interdepartmental Environmental Markets Team (USDA), Federal Agency Authorities Evaluation Implementation and Accountability Develop two year milestones, Develop tracking process and first annual progress report
35 Accountability - Transparency Annual Action Plan Annual Progress Report ** Political Support Varied
36 TMDL T = Total M = Maximum D = Daily L = Load Finalized December 29, 2010
37 Nitrogen Loads to the Bay 2011 by Source Forest + Non- Tidal Water Atmospheric Deposition 19% Septic 3% Wastewater + Combined Sewer Overflow 18% Urban Stormwater 16% Agriculture 44%


38 Goal: RESTORE WATER QUALITY Pollution Diet by State by River
39
40 None of This is All That New We ve been at this a while We ve had a pretty good idea of what needs to be done Trib Strat Effort We ve developed clean-up plans before We ve developed many TMDLs Many of the partners have been at the table awhile
41 So How is the TMDL Different? Accountability Assurance Step-wise progress milestones, 60% by 2017 New Clean-Up Date No Later Than 2025 Transparency Backstop Actions
 WIPs also include strategies, schedules and contingencies to achieve pollutant reductions Agriculture Urban runoff")
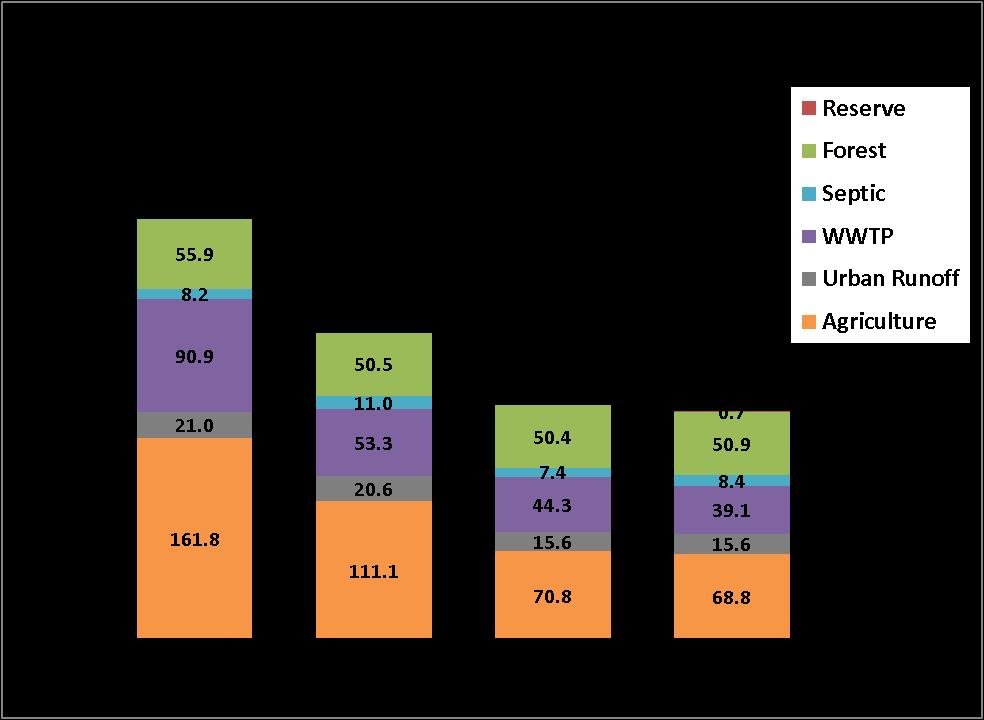
42 Watershed Implementation Plans Science tells us how big the pie is States, D.C. say how to slice it up in their Watershed Implementation Plans (WIPs) WIPs also include strategies, schedules and contingencies to achieve pollutant reductions Agriculture Urban runoff Wastewater Septic Forest Agriculture Urban runoff Wastewater Septic Agriculture Urban runoff Wastewater Septic Forest
43 Chesapeake Bay TMDL Based on 7 WIPs
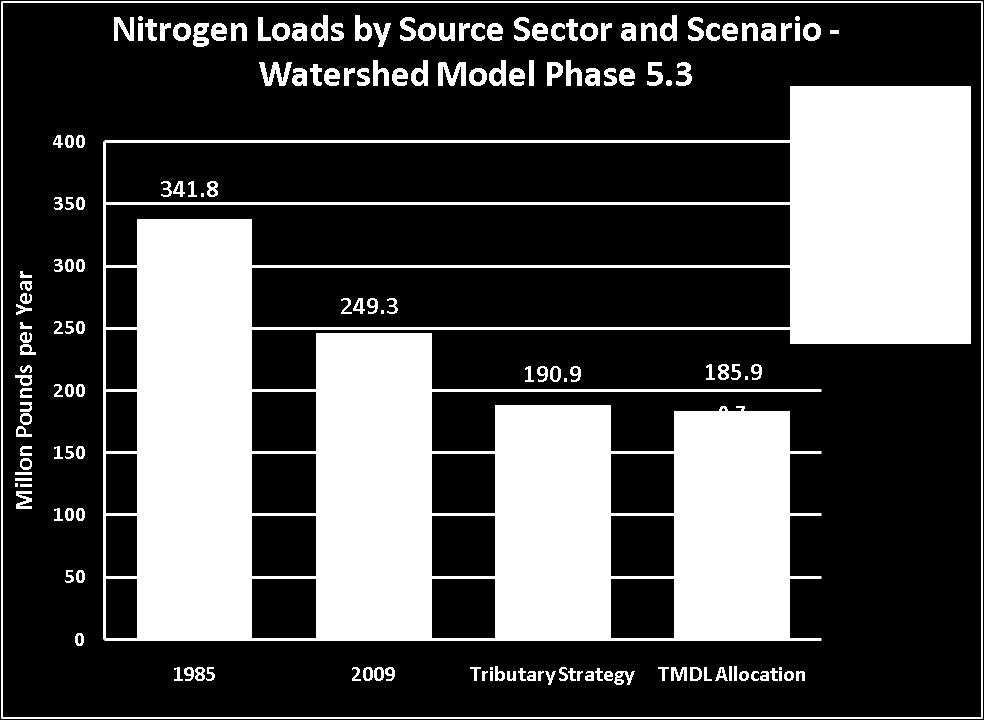
44 Delivered N Loads (mil lbs/yr) 275 Two-Year Milestones EPA Will Assess Interim Target: 60% by Assumes Upfront Program-Building and Future Reductions Assumes Constant Reduction Over Time Assumes Upfront Low-Hanging Fruit and More Difficult Future Red
45 Federal Actions 1. Expand coverage of NPDES permits 2. Increase oversight of state-issued NPDES permits 3. Require additional pollutant reductions from point sources 4. Increase federal enforcement 5. Prohibit new/expanded discharges unless sufficient offsets 6. Condition or redirect EPA grants 7. Revise water quality standards 8. Other federal actions as authorized
46 How Are We Doing? Jurisdictions are on pace to meet their Year Milestones New Milestones will be set in 2014 The trajectory and pace of implementation to meet 2017 goals gets steeper in many respects Enhanced implementation rates and new, innovative tools are needed to meet the challenges ahead of us e.g. Stormwater Utility Fees, Phosphorus Management Tool, Homeowner BMPs
47 A New Watershed-Wide Agreement The Next Generation Agreement: Renews commitments & sets new goals Provides opportunity for full participation by the headwater states Updates science, governance and management techniques ie: climate change, adaptive management Improves coordination, integration & collaboration among the partners Brings together the EO and TMDL with the Partnership agreement and governance structures
48 How is it structured? ALL goals, outcomes and strategies derived from the CBP Goal Teams issue experts & stakeholders from across the jurisdictions / watershed. GOAL OUTCOME CBP s Executive Council (EC) to agree on overarching GOALS & initial OUTCOMES for the partnership (This is the content of the new Watershed agreement) Mgmt OUTCOME OUTCOME CBP s Principals Staff Committee (PSC) to track OUTCOMES, ensuring they are measureable & achievable; adapting as needed Strategy Mgmt Strategy Mgmt Strategy CBP s Management Board (MB) to manage and track the STRATEGIES, adapting them as necessary over time for success Resource managers and decision makers will be guided by the strategies while retaining some flexibility to implement the practices that make the most sense for their region.
49


50
51