RENEWABLE ENERGY TECHNOLOGIES
|
|
|
- Kristina Bridget Freeman
- 5 years ago
- Views:
Transcription

 Engineers")
1 RENEWABLE ENERGY TECHNOLOGIES AN OVERVIEW Vipin Bhandari ED (Projects) Engineers India Limited 1


2 EIL BACKGROUND One of India s leading engineering consultancy and EPC companies Nearly five decades of experience on landmark projects with global energy majors Significant track record across entire Oil & Gas value chain including 10 Green-field Refineries, 37 Oil & Gas Processing Plants, 40 Offshore Process Platforms, 42 Pipelines and 7 Petrochemical Complexes Marquee Projects BPCL Refinery, Kochi Focused diversification into other sectors: Nuclear and Solar Energy Strategic Crude Oil Storage E&P Fertilizer LNG Non-Ferrous Metallurgy Infrastructure Over 2,900 highly experienced professional and technical workforce In-house and collaborative R&D support with 14 registered patents Expanding overseas presence in Middle East, Africa & South East Asia Zero debt firm with track record of healthy earnings and consistent dividend payout 125 MW Solar Thermal Power Project Guru Gobind Singh Refinery, Bathinda Panipat Naphtha Cracker Unit 2


3 LINES OF BUSINESS Oil & Gas Chemicals & Metallurgy Oil and Gas Processing Offshore & Onshore Refinery Strategic Petrochemicals Fertilizer Mining and Storage, Metallurgy Terminals and Pipelines Infrastructure Power City Gas Urban Development Water and Waste Management Solar Thermal Nuclear 3
 Project Management Services for 5 MWe Solar PV Project of GAIL under NSM Phase-1 Batch-2")
4 EIL IN RENEWABLES Engineering and Technical consultancy services to Areva Solar for 125 MWe Solar Thermal Power Project of Reliance Infrastructure Limited (ADAG) Project Management Services for 5 MWe Solar PV Project of GAIL under NSM Phase-1 Batch-2 WABLE 4


5 EIL IN RENEWABLES DPR for pilot plant of Compressed Biogas from Municipal Sewage for Swedish Energy Agency Report on Cost Reduction for Wind Mills and Aerogenerators for MNRE EIL is a Member of Technical Committee of C-WET 5

6 WHY RENEWABLES This is why we need to work on CO 2 6
7 CLIMATE CHANGE IMPERATIVES 7

8 PRIMARY ENERGY DEMAND FORECASTS 8
9 TOTAL FINAL ENERGY BY SOURCES BY 2060 Gas and coal 8% Oil 5% PV 13% Baseload 7% CSP 18% Biofuels 13% Biomass heat 6% Solar fuels 1% Solar heat 4% Geothermal heat 1% Hydropower 6% Wind 18% SOURCE: IEA 9
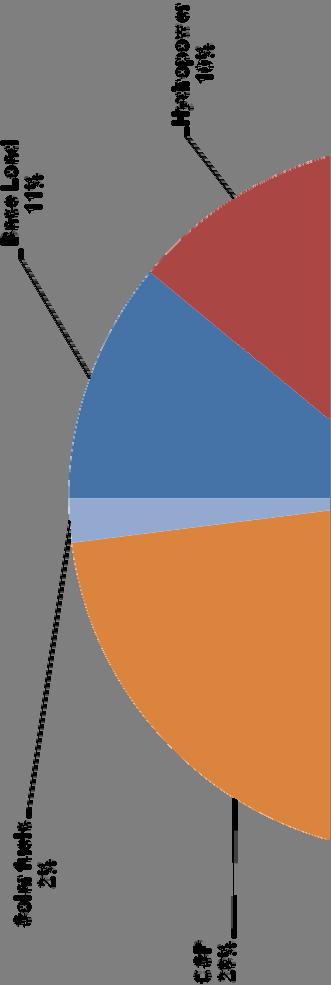
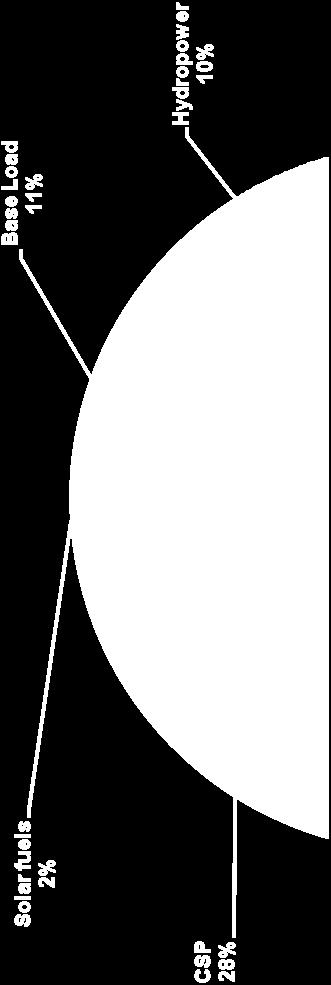
10 GLOBAL ELECTRICITY GENERATION BY 2060 SOURCE: IEA 10
11 CLIMATE CHANGE SCENARIOS BASELINE Business-as-usual Growth GDP x 4 Final & Primary energy use x 2 Electricity demand x 2.5 Energy CO 2 emissions x 2.3 Global Warming- by about 6ºC ACT - Bring back carbon emissions to 2005 levels by 2050 BLUE - Reduce carbon emissions by 2050 to a level that is half of level in 2005 to limit global warming to 2 to 2.4ºC 11


12 GLOBAL ELECTRICITY PRODUCTION UNDER SCENARIOS 12
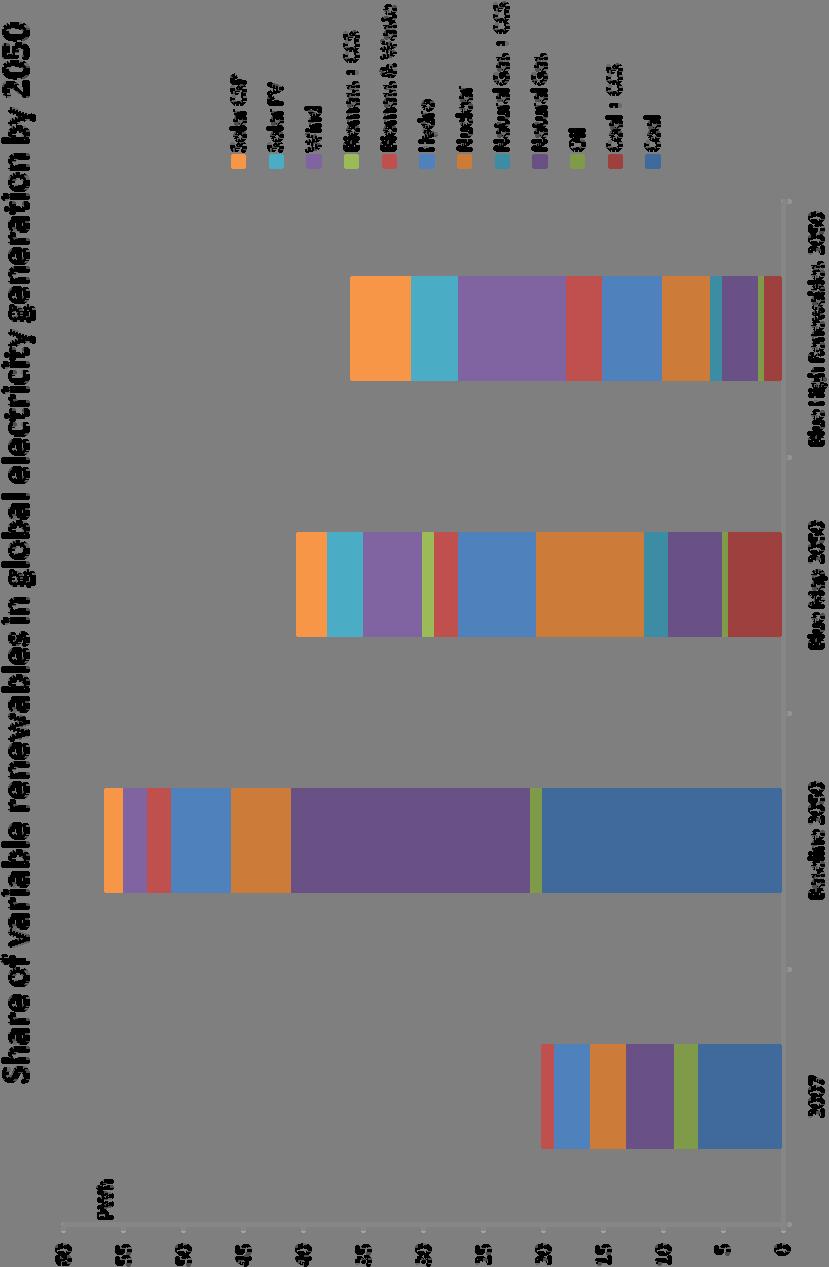
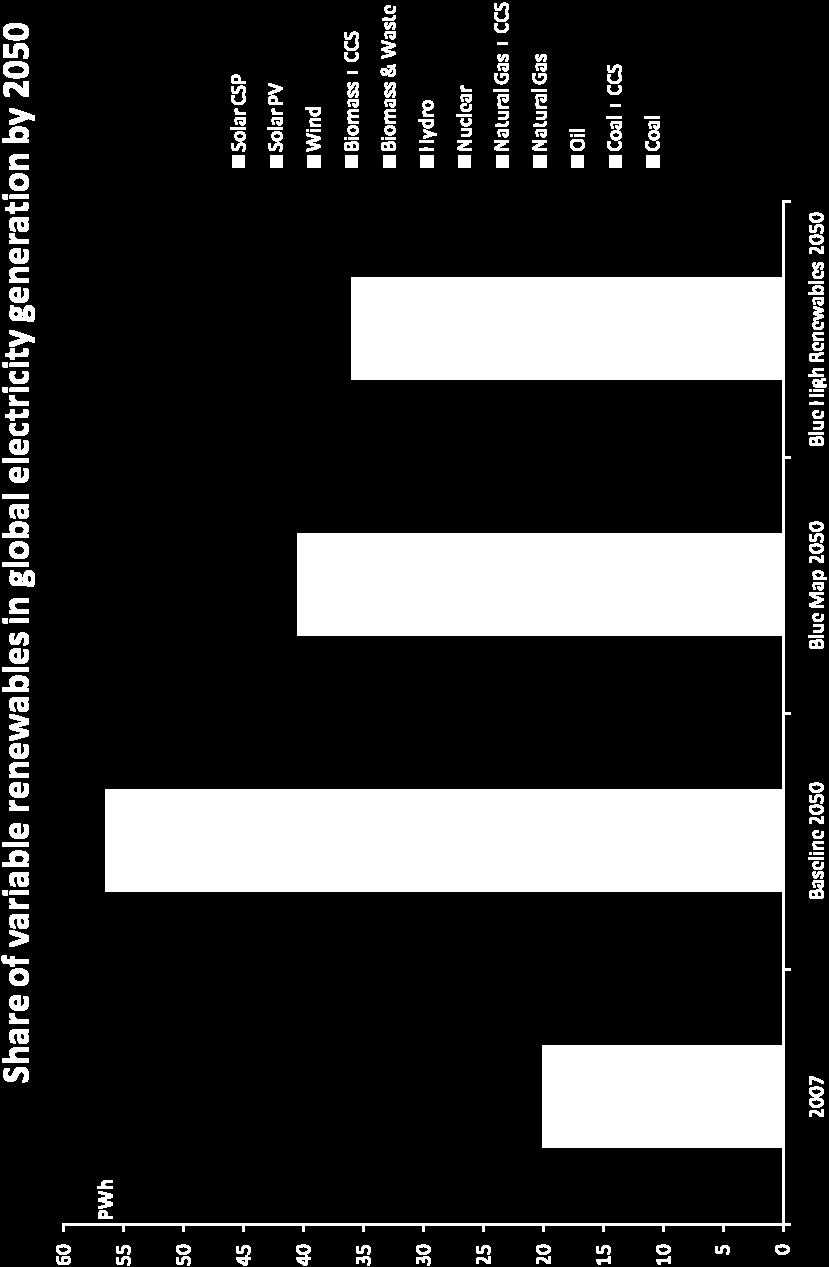
13 SHARE OF RENEWABLES UNDER SCENARIOS 13

14 EMISSION REDUCTIONS BY RENEWABLES Courtesy: ETP

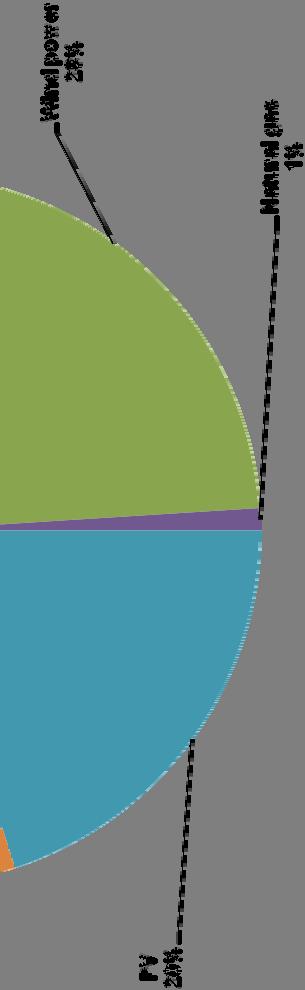
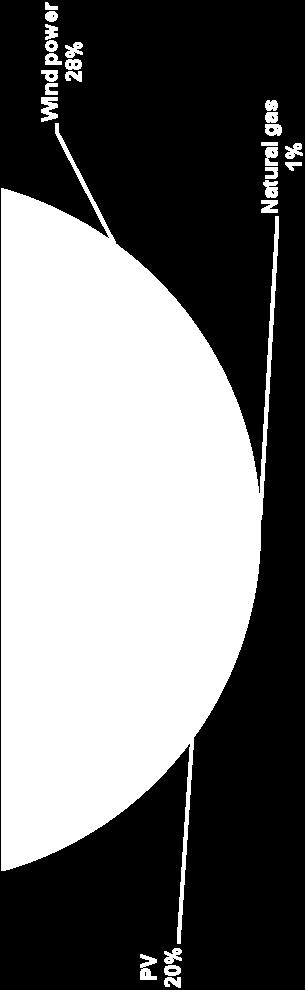
15 RENEWABLE POWER GENERATION FOR BLUE MAP SCENARIO Courtesy: ETP

16 EMISSION ABATEMENT BY RENEWABLES 16
17 PRESENT STATUS OF RENEWABLES IN INDIA AND WORLD TECHNOLOGY CUMULATIVE INSTALLED TILL JUL 13 (MW) INDIA CUMULATIVE INSTALLED TILL 2012 (MW) WORLD SOLAR 1,889 1,02,500 WIND 19,661 2,83,000 SMALL HYDRO 3,707 9,90,000 (Hydro) BIOGAS 1,265 WASTE TO ENERGY 96 3,50,000 17
18 RENEWABLE ENERGY MEDIUM TERM POTENTIAL INDIA TECHNOLOGY CAPACITY (MW) SOLAR PV 50,000 WIND 45,000 SMALL HYDRO 15,000 BIOGAS 6,100 COGENERATION BAGASSE 5,000 WASTE TO ENERGY 7,000 18
19 RENEWABLE ENERGY INSTALLATIONS PLANNED IN FUTURE TECHNOLOGY 12th FIVE YEAR PLAN (MW) 13th FIVE YEAR PLAN (MW) SOLAR 9,000 16,000 WIND 11,000 11,000 SMALL HYDRO 1,600 1,500 BIOGAS, BAGASSE AND WASTE TO ENERGY 2,100 2,000 19
20 KEY GROWTH DRIVERS FOR RENEWABLES IN INDIA Increased energy demand Climate Change Government Initiatives Substantial Potential for Renewable Energy in India Faster and Efficient Implementation of Renewable Energy Certificates Carbon Trading as a Source of Revenue Economics Insurance against future price of fuel 20
21 INDIA S NATIONAL ACTION PLAN ON CLIMATE CHANGE Eight National Missions of the National Action Plan National Solar Mission National Mission for Enhanced Energy Efficiency National Mission on Sustainable Habitat National Water Mission National Mission for Sustaining the Himalayan Ecosystem National Mission for a Green India National Mission for Sustainable Agriculture National Mission on Strategic Knowledge for Climate change 21
22 SOLAR ENERGY PERSPECTIVES In 90 Minutes, enough sunlight strikes the earth to provide the entire planet s energy needs for one year..iea 22
23 SOLAR PV TECHNOLOGY In April 2013, Solar Impulse -- a solar-powered plane that could fly day and night without the use of fuel -- completed its historic cross-country journey at New York City s John F. Kennedy International Airport 23

24 SOLAR PV TECHNOLOGY The Turanor PlanetSolar, the world's largest solar boat, travels on the Seine river in Sevres, outside Paris on Sept. 10, The PlanetSolar with its 537 square meters of photovoltaic panels powering 6 blocks of lithium-ion batteries, accomplished the first around the world trip powered only by solar energy in May

25 PV TECHNOLOGY STATUS AND PROSPECTS 25

26 SOLAR PV ENERGY In April 2013, Solar Impulse -- a solar-powered plane that flies day and night without the use of fuel -- completed its historic cross-country journey at New York City s John F. Kennedy International Airport. 26
27 SOLAR PV ENERGY TRENDS Three Junction (Concentrator) 43.5 % efficiency targeted to achieve Three Junction (Non-Concentrator) 34.1 % efficiency targeted to achieve Two Junction (Concentrator) 32.6 % efficiency targeted to achieve Single Junction Single Crystal 26.4 % efficiency targeted to achieve Single Junction Concentrator 29.1 % efficiency targeted to achieve Single Junction Thin Film 28.8 % efficiency targeted to achieve Crystalline Si Cells Single Crystal 25.0 % efficiency targeted to achieve Crystalline Si Cells Multi-crystalline 20.4 % efficiency targeted to achieve Crystalline Si Cells Si Hetero Structure 23.0 % efficiency targeted to achieve Thin Film Technology Cu Se2-20.3% efficiency targeted to achieve Thin Film Technology Cd Te-17.3% efficiency targeted to achieve Thin Film Technology Amorphous Si-13.4% efficiency targeted to achieve 27
28 PV Cells..Theoretical projections # Junctions in Cells 1 Sun µ Maximum Concentration µ 1 Junction 30.8% 40.8% 2 Junction 42.9% 55.7% 3 Junction 49.3% 63.8% n Junctions 68.2% 86.8% PROS Multi junction devices are one of the approaches to exceed single junction efficiencies For 50% efficiency, 5 junctions shall be needed assuming 80% absorption is possible CONS The tandem approach is limited by the availability of stable materials of desired band gaps Concentration poses challenges in acceptance angle and thermal management as the degree of concentration is increased 28

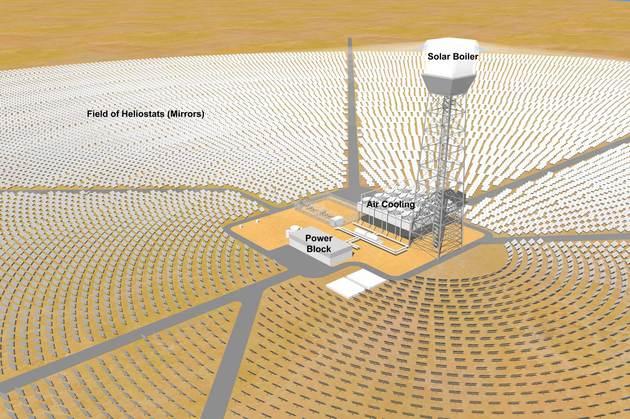
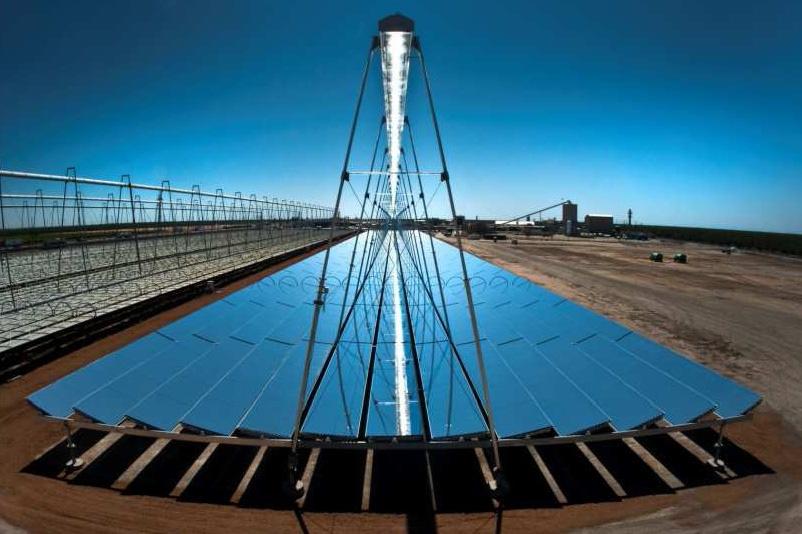
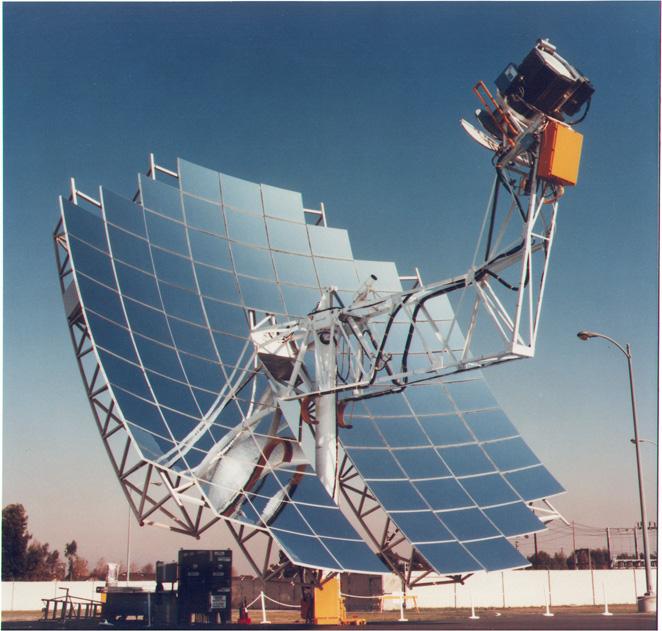
29 SOLAR THERMAL TECHNOLOGIES PARABOLIC TROUGH CENTRAL TOWER CLFR PARABOLIC DISH 29
30 SOLAR THERMAL TECHNOLOGY CLASSIFICATION TROUGH TOWER FEATURES Bankability Limited Efficiency End of Engineering CLFR FEATURES High Temperature High Efficiency Less ground area DISH FEATURES Lower cost solution Most land efficient Ease of construction FEATURES Much higher temperature High maintenance requirement 30
31 CSP TECHNOLOGIES COMPARISON Parameter Site Solar Characteristics/ Solar radiation required Land Requirement Typical shape of solar plant Water Requirement Maximum Temperature Parabolic Trough Solar Thermal (CSP) Technologies Solar Tower Fresnel Reflector (CFLR) Solar Dish Generally sites with annual sum of DNI larger than 1800 kwh/m 2 Rectangle 400 deg C Efficiency ~ 14% Sector of a circle/ Rectangle 270 deg C possible up to 560 deg C ~ 17% possible up to 22% Typically 5-7 acres/ MW Rectangle Typically 4 cu.m/ MWhr Rectangle 400 deg C 800 deg C ~ 15% ~ 22-24% 31

32 EFFICIENCY COMPARISON 32

33 WIND ENERGY TECHNOLOGY Top 10 wind power countries Country Total capacity end 2012 (MW) China 75,564 United States 60,007 Germany 31,332 Spain 22,796 India 19,564 United Kingdom 8,445 Italy 8,144 France 7,196 Canada 6,200 Portugal 4,425 Rest of world 39,852 Total 282,482 33
 installed at the UK's")

34 WIND ENERGY TECHNOLOGY 6 MW offshore wind turbines (Siemens) installed at the UK's Gunfleet Sands wind farm Enercon's E MW is the biggest wind turbine in the world 34
35 TRENDS IN OFFSHORE WIND POWER 35

36 WIND ENERGY Courtesy : RolandBerger 36

37 WIND ENERGY Courtesy : RolandBerger 37

38 SOLAR TO HYDROGEN 38
39 SOLAR TO HYDROGEN SOLAR ENERGY CONCENTRATED THERMAL ENERGY PHOTOVOLTAIC BIO PHOTOLYSIS SOLAR THERMOLYSIS WATER SOLAR THERMO CHEMICAL CYCLES SOLAR GASIFICATION CO2/C SEQUESTRATION MECHANICAL TO ELECTRICAL FOSSIL FUEL ELECTROLYSIS (Natural gas, coal, oil) SOLAR CRACKING PHOTO ELECTROLYSIS SOLAR REFORMING SOLAR HYDROGEN 39

40 MICROGRID AND SMART GRID A microgrid is a shared network of distributed generation and storage that can operate in island mode during grid outages and remains connected to the local utility system. A smart grid is a modernized electrical grid that uses information and communication technology to gather and act on information, such as information about the behaviors of suppliers and consumers, in an automated fashion to improve the efficiency, reliability, economics, and sustainability of the production and distribution of electricity. 40

41 MICROGRID AND SMART GRID 41
42 MICROGRID AND SMART GRID CHALLENGES WITH MICROGRIDS OWNERSHIP TARIFF STRUCTURE PRIORTISATION GRID COMMITMENTS STROND INTERACTION BETWEEN ACTIVE AND REACTIVE POWER PROTECTION AND SAFETY ISLANDING IN CASE OF GRID FAILURE 42
 can moderate the intermittent nature of wind by storing excess energy when the wind is blowing and making")
43 ENERGY STORAGE WIND POWER The Notrees Wind Storage Demonstration Project is a 36 MWp, 24 MWh energy storage & power management system which became fully operational in December 12. The installation demonstrates how energy storage (in mega sized industrial battery systems) can moderate the intermittent nature of wind by storing excess energy when the wind is blowing and making it available later to the electric grid to meet customer demand. 43
44 CLASSES OF ENERGY STORAGE COMMON NAME EXAMPLE APPLICATIONS DISCHARGE TIME REQUIRED Power Quality Transient Stability, Frequency Regulation Seconds to Minutes Bridging Power Energy Management Contingency Reserves, Ramping Load Leveling, Firm Capacity, T&D Deferral Minutes to ~1 hour Hours 44
45 STORAGE TECHNOLOGIES FOR ENERGY MANAGEMENT High Energy Batteries-Lithium Ion, Vanadium redox, Sodium Sulphur Pumped Hydro Storage (PHS) Compressed Air Energy Storage (CAES) Thermal Energy Storage- Most often associated with Concentrating Solar Power, Molten Salt Storage 45

46 ENERGY STORAGE APPLICATIONS AND TECHNOLOGIES 46
47 ONGOING GOVERNMENT INITIATIVES SOLAR Jawaharlal National Solar Mission State Government Policies Setting up of SEC Indo-US Research Facility at IISc. OFFSHORE WIND National Offshore Wind Energy Policy (Draft) National Smart Grid Mission 2014 Small Hydro Power Programme 47
48 OPPORTUNITIES Unlimited resources Distributed availability of energy resource such as Biomass, Solar Energy Distributed generation Government initiative Independence from Central energy regulator 48
49 CHALLENGES The intermittent nature of renewable Water Diffused availability Unequal distribution throughout the country Transmission problems and grid infrastructure Storage of Energy- Molten Salt/ Batteries High cost of generation Non-bankability of emerging technologies Limited supplier of renewable energy equipment Statutory approvals Availability of authentic resource data 49

50 50
51 MARKET SHARE-CSP TECHNOLOGIES TECHNOLOGY INSTALLED CAPACITY (MW) PLANTS U/OPERATION Parabolic Trough Central Tower Parabolic Dish CLFR
52 COST TREND IN RENEWABLES TECHNOLOGY Unit Energy Cost (Rs) in Unit Energy Cost (Rs) in SOLAR PV SOLAR THERMAL WIND SMALL HYDRO BIOMASS (GASIFIER) 3.73 to 5.96 (depending upon wind zone) 3.54 to 4.88 (Varying from state to state) 5.44 to 6.19 (Depending upon plant capex, capacity etc.) 3.93 to 6.29 (depending upon wind zone) 3.75 to 5.16 (Varying from state to state) 5.85 to 6.65 (Depending upon plant capex, capacity etc.) BIOGAS POWER PROJECTS BIOMASS POWER PROJECT 5.12 to 6.18(Depending upon plant capex, capacity etc.) 5.49 to 6.24 (Depending upon plant capex, capacity etc.) 52

53 WIND ENERGY Courtesy : RolandBerger 53

54 WIND ENERGY Courtesy : RolandBerger 54
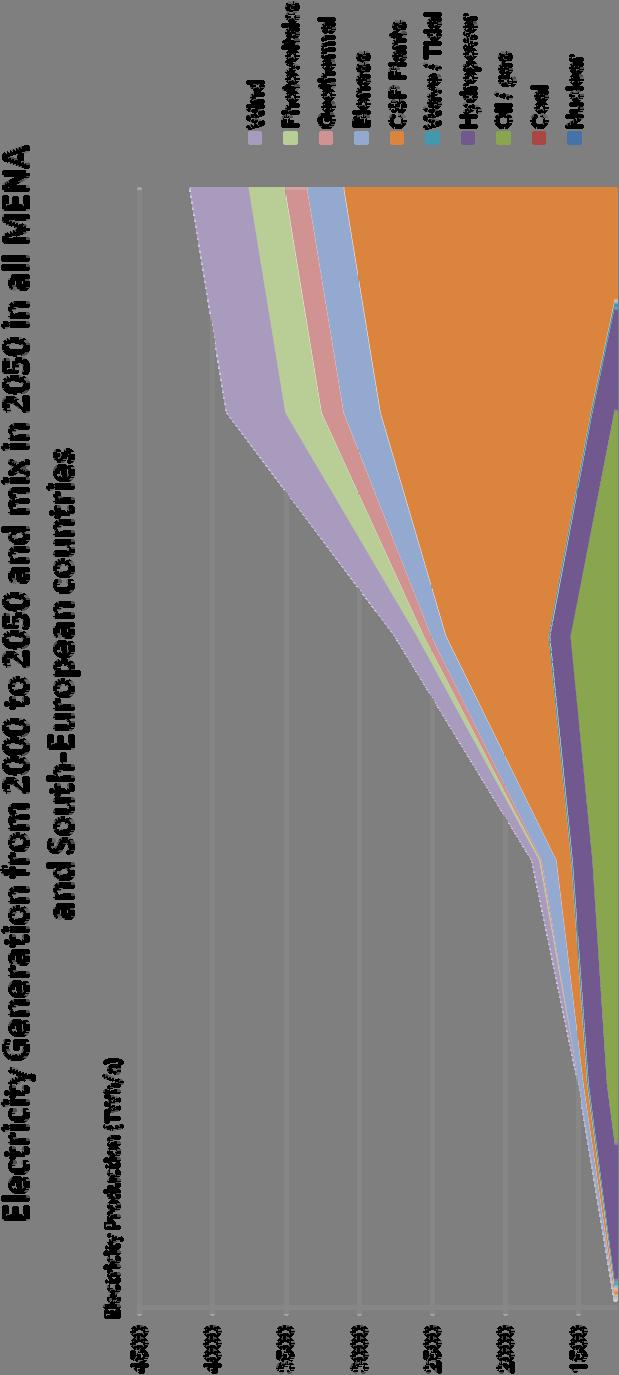
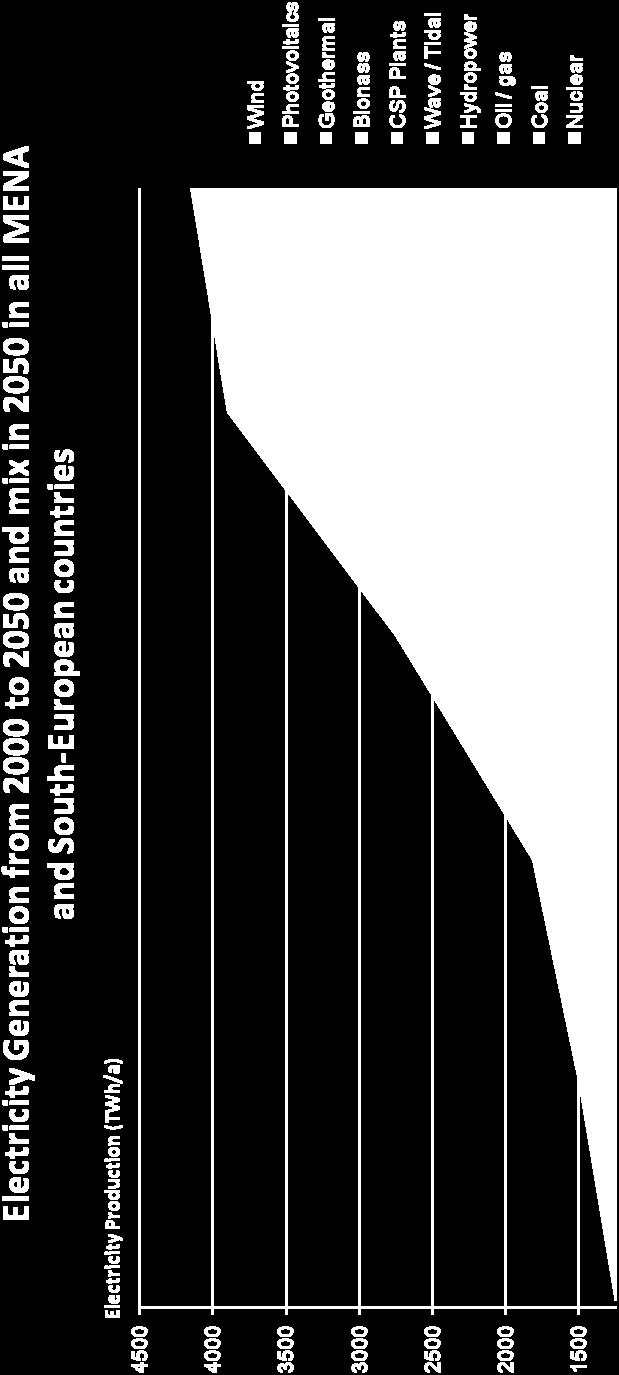
55 ELECTRICITY GENERATION SOURCE: IEA 55

56 Key Technologies For Emission Reduction 56

57 SOLAR TO HYDROGEN-TECHNOLOGY Using solar cells, solar energy can be used directly to fuel electrolysis to produce hydrogen as a fuel 57
58 MICROGRID AND SMART GRID 58