Modelling impacts of changes to energy standards in Scottish building regulations
|
|
|
- Harriet Hawkins
- 5 years ago
- Views:
Transcription
1 Modelling impacts of changes to energy standards in Scottish building regulations
2 The Sullivan Report Key recommendations Research CO 2 emissions from new buildings 1990 : 2008 Lifecycle costs of changes to CO 2 emissions standard Lifecycle analysis of embodied CO 2 and emissions Heat supply options assessment SAP, SBEM SAP, SBEM and DSM + cost modelling SimaPro v 7.0.2, SAP and DSM MS Excel, custom


3 International panel appointed by Scottish Ministers chaired by Lynne Sullivan The Sullivan Report December recommendations 9 workstreams New build, existing Domestic, non-domestic Design, construction, performance Costings
4 Sullivan report recommendations for new build staged standards Reductions in CO2 emissions beyond 2007 Technical Handbooks 2010 Low carbon 2013 Very low carbon 2016 / 17 Zero carbon, if practical 2030 Total life zero carbon Domestic Non-domestic 30% 50% 60% 75% 100% 100% (regulated uses)?

5 CO 2 emissions from new buildings 1990 baseline Consultation proposal for 2010: 30% better than 2007 Technical Handbooks tonnes 2.7 tonnes 3.0 tonnes 3.9 tonnes 3.5 tonnes 6.3 tonnes CO2 CO2 emissions relative relative to to baseline buildings 6.3 tonnes


6 Cost impacts of changes to energy standards in 2010 Non-Domestic Davis Langdon LLP with Faber Maunsell Primary school 4,466 m 2 10m City centre offices 12,236 m 2 30m Secondary school 11,193 m 2 24m Retail warehouse 4,756 m 2 5m
7 Study methodology Created energy models using recent projects in Scotland Proposed two levels of fabric upgrades / energy efficiency Modelled low carbon technologies to reduce emissions: Wind Site-side turbines and roof-top units Sun Solar thermal hot water and Photovoltaics Ground source heat pumps Biomass boilers Estimated capital and operational savings with payback periods
8 Energy efficiency scenarios Element Baseline Intermediate Advanced U-values (W/m²K) Roof Wall Floor Windows, doors, rooflights Air permeability 50Pa) Solar shading (effective g-value) Heating - gas fired (Sη & delivery η) (%) 88 & & & 95 Cooling - electric (EER & delivery η (%)) 3 & & 90 4 & 90 Lighting (W/m²/100 lux): Primary school Secondary school City centre office Retail warehouse Ventilation Specific Fan Power (W/l/s): Schools Office & retail warehouse Hot Water gas indirect (Sη & delivery η) (%) & & 85 Power Factor Correction Lighting Controls - MS DD & MS BMS Controls - AM&T+A AM&T+A
9 Primary school, 9,925,271: CO2 emissions / on-costs 100 Tonnes CO2 % on-costs Baseline 94.1 tonnes CO = 37% reduction 47.1 = 50% reduction Intermediate energy efficiency kw = 50% CO 2 reduction Additional cost 4.9% % % kw 148 kw 208 biomass kw biomass = 50% CO 2 reduction Additional cost 1.9% Baseline 340 kw biomass + 50 kw 340 kw biomass m2 PV Advanced EE only Advanced energy efficiency Int'mediate Int'mediate Int'mediate Advanced Advanced 119 kw 221 m2 PV 198 kw 20 kw 58 kw GSHP GSHP + 58 kw GSHP + 3 m2 PV = 50% CO 2 reduction Additional cost 5.2% Advanced 205 kw biomass 0
10 Payback periods: Primary school Annual fuel price inflation RPI + 3% RPI + 5% RPI + 10% RPI + 15% 25A Intermediate no LCE B/E no upgrade Biomass / GSHP 25C no upgrade Large D Intermediate PV A Advanced no LCE B no upgrade Biomass 37C no upgrade Large D Intermediate PV E Intermediate GSHP A no upgrade Biomass 50B Intermediate Large C Intermediate GSHP + small D Advanced Small + PV E Advanced GSHP 46 31
11 Secondary school, 24,401,048: CO2 emissions / on-costs 300 Tonnes CO2 % on-costs Baseline tonnes CO = 37% reduction = 50% reduction % % Baseline 85 kw 112 kw 311 kw biomass 112 kw = 50% CO 2 reduction Additional cost 0.8% 173 kw 394 kw biomass + 20 kw Int'mediate 53 m2 solar HW + 20 kw 437 kw biomass m2 PV 437 kw biomass + 76 kw 167 m2 solar HW m2 GSHP Advanced Advanced Advanced 78 m2 solar HW 190 m2 solar HW kw GSHP + 20 kw m2 PV 423 kw biomass m2 PV Advanced energy efficiency + 78m2 solar HW = 50% CO 2 reduction Additional cost 3.2% 0
12 Payback periods: Secondary school Annual fuel price inflation RPI + 3% RPI + 5% RPI + 10% RPI + 15% 25A Intermediate no LCE /37B no upgrade Biomass 25C no upgrade Large 10 (12 RPI) D no upgrade Solar HW + PV E no upgrade Small + solar HW A Advanced no LCE C no upgrade Large 10 (11 RPI) D no upgrade GSHP + solar HW E no upgrade Small + solar HW A no upgrade Large 9(11RPI) B/C no upgrade Biomass + small / PV 50D Advanced Solar HW E Intermediate Small + solar HW
13 City centre office, 29,905,117: CO2 emissions / on-costs Tonnes CO2 Baseline tonnes CO = 25% reduction = 37% reduction 25% = 50% reduction 37% % on-costs % Baseline Int'mediate Int'mediate 179 kw biomass 140 m2 PV + 12 kw + 30 m2 solar HW Advanced EE only Int'mediate 248 kw GSHP + 12 kw Advanced energy efficiency PLUS 494m 2 PV + 209kW biomass + 12kW + 30m 2 solar HW (maximum capacity, all LCE) = 42% CO 2 reduction Advanced 286 m2 PV + 18 kw CHP + 12 kw Advanced 209 kw biomass m2 PV + 12 kw Advanced 266 m2 PV kw GSHP + 12 kw 44.1% delivered energy saving Additional cost 5.9% Advanced 494 m2 PV kw biomass + 12 kw + 30 m2 solar HW 1 0
14 Payback periods: City centre office Energy efficiency Low carbon equipment Annual fuel price inflation RPI + 3% RPI + 5% RPI + 10% RPI + 15% 25A Advanced no LCE B Intermediate Biomass C Intermediate Micro, solar HW, PV D Intermediate Micro, GSHP E Intermediate Micro, CHP A Advanced Micro, CHP, PV B/C Advanced 42 Advanced Micro, Biomass or GSHP, PV Micro, Biomass, Solar HW, PV
15 Energy consumption breakdown (regulated energy uses) Heating Cooling Auxilliary Primary school Secondary school City centre office Retail warehouse Lighting DHW Total MWh
16 City centre office: architectural strategies / services efficiencies etc 400 Tonnes CO2 % on-costs % 37% 50% Passive chilled beams Reduced glazing Highly efficient lighting = 31% CO 2 reduction 27% delivered energy saving Additional cost 0.4% Baseline S1 S2 S3 S5 S9 S4 S7 S11 S6 S8 S10 S12 Passive chilled beams and reduced glazing PLUS highly efficient lighting = 31.2% fewer emissions, Passive chilled beams Reduced glazing Highly efficient lighting Advanced plant efficiencies kw biomass heating = 50% CO 2 reduction Passive chilled beams and reduced 38% delivered energy saving glazing PLUS highly efficient lighting, Additional cost 1.9% advanced plant efficiencies, PLUS 380 kw biomass heating =
17 Retail warehouse, 5,447,779: CO2 emissions / on-costs Tonnes CO2 25% Baseline tonnes CO = 25% = 37% reduction = 50% reduction % on-costs % 8 50% Baseline Int'mediate EE only Advanced EE only Int'mediate5 2 m2 PV + 51 kw biomass Int'mediate 90 kw + 51 kw biomass Advanced energy efficiency 48 kw biomass heating m 2 PV / 166 kw = 50% CO 2 reduction 47-49% delivered energy savings Additional cost % Int'mediate 152 m2 PV + 8 m2 solar HW Advanced 284 m2 PV + 48 kw biomass Advanced 166 kw + 48 kw biomass Advanced 353 m2 PV + 8 m2 solar HW Advanced 327 m2 PV + 48 kw GSHP 4 2 0
18 Payback periods: Retail warehouse 25A Intermediate no LCE 25B no upgrade 37A Advanced no LCE Annual fuel price inflation RPI + 3% RPI + 5% RPI + 10% RPI + 15% Biomass + Large + PV 37B Intermediate Solar HW + PV 8 (9 RPI) (15 RPI) 21 (50 RPI) C Intermediate Biomass + Large D Intermediate GSHP + PV E Intermediate Biomass + PV A Advanced Biomass + PV B Advanced Solar HW + PV C Advanced GSHP + PV D Advanced Biomass + Large E Advanced GSHP + Large

19 Retail warehouse: architectural strategies / services efficiencies etc Highly efficient luminaires + daylight dimming = 37% CO2 reduction 32% delivered energy saving Additional cost 1.3% Ultra efficient luminaires + daylight dimming kw = 50% CO2 reduction 42% delivered energy saving Additional cost 5.4%
20 Energy performance modelling: Differences between DSM and SBEM Comparison of DSM and SBEM results for CO 2 emissions TER kgco 2 /m 2 / annum Primary school Secondary school Office building Retail warehouse DSM results SBEM results DSM - SBEM Impact on CO 2 emissions of energy efficiency upgrades Intermediate energy efficiency upgrade Advanced energy efficiency upgrade DSM modelling SBEM modelling DSM modelling SBEM modelling 22.9% 24.1% 19.5% 31.8% 4.3% 6.4% 23.6% 26.8% 43.0% 40.2% 27.6% 43.6% 22.9% 24.1% 36.1% 37.4%
21 Energy performance modelling: differences in results using DSM and SBEM Energy use calculations: SBEM monthly, DSM hourly Lighting energy use assumptions: - SBEM varies energy use with floor area, areas of ows and rooflights (assumes people turn their lights off in high levels of natural daylight) - allowance for reduction in lighting due to daylight and motion sensing switching and controls Inputs Different levels of input data, different ways to input information + Differences between buildings Differences in the energy load profiles of the buildings studied (office has higher level of cooling and auxiliary energy than the other buildings studied)
22 Energy performance modelling: DSM and SBEM baselines CO 2 reductions Additional capital costs of cheapest improvement scenarios to achieve specified levels of CO 2 reductions 25% % 30% % 37% % 50% % 80% % DSM baseline buildings DSM modelling SBEM baseline buildings SBEM modelling Primary Secondary Office Retail Primary Secondary Office Retail % % % % % % % % 2.6 % % 2.6 % % % 5.7% % % %?? % % % % % % % % % % % % % %??

23 Pilot project: Embodied CO 2 and energy paybacks Davis Langdon LLP
24 Pilot project: Embodied CO 2 and energy paybacks 1 SELECT BASELINES - City centre office; 2 houses, 1 flat, 2007 energy standards - Davis Langdon materials database (Bath ICE, own data) - SimaPro v (LCA software), - Baseline CO 2 footprint embodied CO 2, CO 2 emissions 2 APPLY IMPROVEMENT SCENARIOS - Energy efficiency measures (insulation, airtightness, boiler efficiency, lighting) + low carbon equipment; or Architectural measures + services efficiencies - Embodied CO 2 of improvement scenarios 3 EVALUATE IMPACTS Assumed 60 years occupancy, snapshot at 35 years Embodied CO 2 / CO 2 emissions reductions = CO 2 payback periods
25 Embodied CO2: city centre office building Total embodied CO2: 9,354 Tonnes Total annual emissions: 366 Tonnes Windows and external doors, 423 Ceiling finishes, 266 Roof, 262 Frame, 2,490 M&E Services, 1793 Substructures, 1,359 Upper floors, 1,292 Floor finishes, 966 Internal walls/partitions and doors, 241 External walls, 205 Stairs, 32 Wall finishes, 25

26 Embodied CO2: improvement scenarios 2.45 yrs 2.38 yrs 0 yrs

27 Assessment of the viability of District Heating / CHP Parsons Brinckerhoff Energy Systems
28

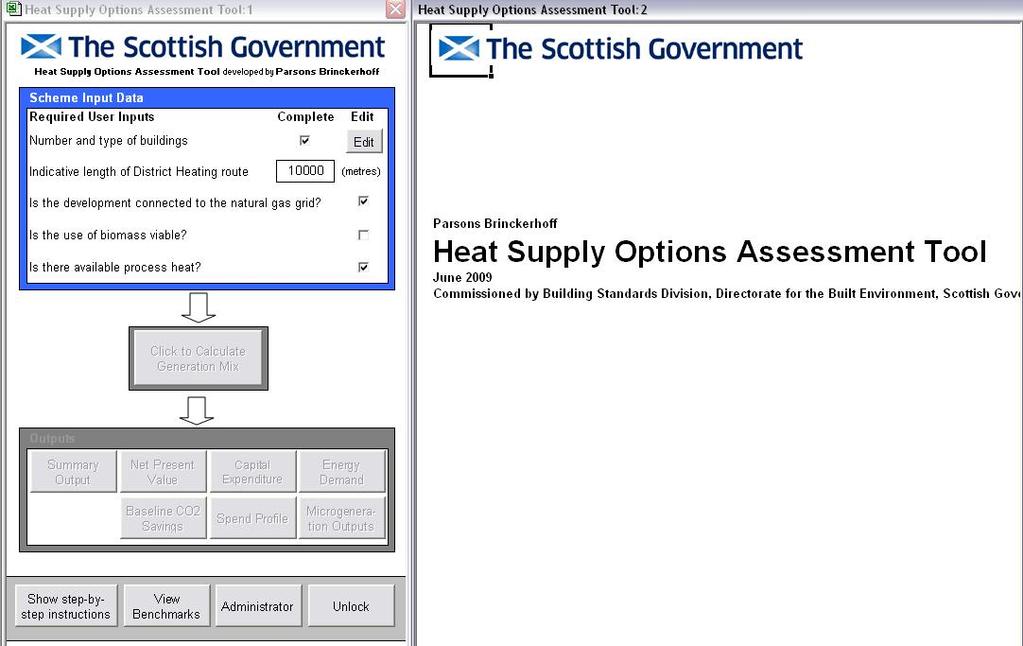
29 Heat Supply Options Assessment tool: inputs

30 Heat Supply Options Assessment tool: example results
31 Research and consultations: