The Impact of U.S. Shale Resources: A Global Perspective
|
|
|
- Brandon Richardson
- 5 years ago
- Views:
Transcription

1 The Impact of U.S. Shale Resources: A Global Perspective by Svetlana Ikonnikova Scott Tinker March 3, 2017
2 Outline Global Perspective U.S. Shale Resource Studies Implications
3 Affordable Available Reliable Sustainable Energy Security Cost: per unit of energy Price Volatility: stable or fluctuating Infrastructure: cost to build the plant Access: substantial resources Intermittent: source consistent or variable Safe: natural/human causes Clean: air and atmospheric emissions Dense: energy per area, weight and volume Dry: fresh water use/risk 2017


4 The Global Energy Mix 28% 23% 38% ,730 Coal Global Population Each color on the map represents ~ 1 billion people Nat 2,987 Gas Renew Hydro Nuclear ,131Petroleum % 3% + 2% + 1% 23% -6% 32% Modified from: EIA Million Tonnes Oil Equivalent (2012)


5 U.S. Marketed Natural Gas Production ,800 Source: U.S. Energy Information Administration Drilling Productivity Report regions, Petroleum Supply Monthly, Natural Gas Monthly Bcf/d Rest of U.S. Rest of U.S. Shale Marcellus Region US Natural Gas Price ($mcf) US Gas Rigs 12 1,600 1, , , QAe4666

6 U.S. Natural Gas Forecast vs. Actual Model: Rice University, Medlock, 2012 Actual Tcf/year
7 Integrated Study Workflow Geologic Analysis Reservoir characterization Original Resource in Place mapping Well Decline Analysis Production and its decline for gas/oil/water Stimulated/drained rock volume Recovery and Productivity Statistical Analysis Expected production as a function of Well productivity drivers, Location and Completion, Inventory of future wells, Technically Recoverable Resources Well Economics Expected well profitability as a function of well production profile, operational, market and regulatory parameters Production Outlook Pace of drilling by year and area, Expected gas/oil/water production depending on economics, technology, regulation

8 Ikonnikova Frac Barrier Zones Barnett 3D Model Forestburg Isochore Viola Simpson Isochore

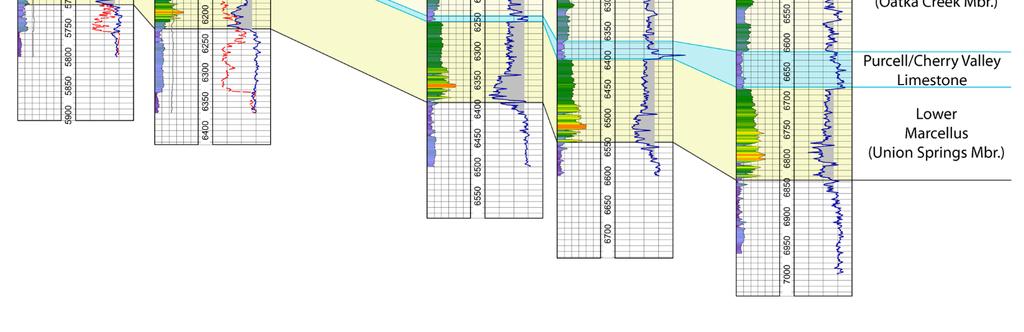


9 Phi H Interval Ikonnikova Marcellus top
10 Ikonnikova Effect of Completions of Expected Recovery average well EUR for a given region (Bcf) EURs assuming the same completion EUR with a preffered completion Major producing regions in Marcellus

11 Production Profiles by Tier Ikonnikova Barnett 1 Barnett 2 Barnett 3 Barnett 4 Barnett 5 Barnett 6 Barnett 7 Barnett 8 Barnett 9 Barnett 10 Production rate, MMcf/d Year of production BEG Shale Reserves and Production Team
12 Distributions of Individual Well Recovery Ikonnikova Relative frequency 25% 20% 15% 10% 5% Barnett Fayetteville Haynesville 0% Length normalized EUR (horizontal wells only), Bcf Ikonnikova et al., 2015
13 New Completion Strategies Ikonnikova et al., Established drilling patterns rapidly change owing to resource exhaustion, technological advances and new economic realm New drilling and completion techniques also affect the use of other resources, i.e. water, land, proppants Practices like infill drilling and cluster drilling already change our views on the future play recovery and aggregate production possibilities.
14 New Features Ikonnikova Well economics in the past was very sensitive to D&C costs in particular, so operators get smarter about Energy prices: Futures Strips / Hedging, Economies of scale with a multi-well pads and joint leases, Gathering & transportation costs: develop more efficient solutions, Water demand and processing of produced water


15 Drainage areas of the existing wells Inventory of Future Wells Existing wells Prospective inventory

16 Bakken 14,544 Gas Oil Tcf Bbbl In-Place Recoverable Demand Demand Technically Recoverable Resource-in-Place Barnett 15,815 Eagle Ford 12,346 Haynesville 3,490 Fayetteville 5,834 Marcellus 6,934 BEG Shale Resource and Production Team
17 From the Past into the Future New Advances Improved geologic resource characterization and assessment: Higher fracturing efficiency: greater energy return on water and proppant used Increased resource recovery: drilling into several sub-horizons Advances in well engineering and drilling: Greater subsurface area developed from one pad with longer laterals and wells placed closer vertically and spatially Surface use is more condensed in time and spatially Uncertainty in parts may decrease, but in total is still high
18 The Future Electricity Mix North America Quadrillion BTUs Europe Asia Pacific Electricity Generation by Fuel Renewables Nuclear Coal Gas 0 Oil ExxonMobil Corporation, 2010, The outlook for energy: a view to 2030: ExxonMobil report, 53 p
19 Economic and Environmental Implications Economics High prices stimulated resource exploration and development Low prices pushed technology and cost efficiency through scale/intensity With large scale operational risks, e.g. spills or gas, are more costly Higher risks lead to investments in safety and infrastructure Environment Low prices and weak economics makes producers vulnerable to regulatory risks Operators preempt regulations with acceptable solutions in advance
20 World Learns from Us: Will We leave Positive Legacy Environmental concerns, particularly about land use and water resources, motived operators to improve Subsurface-to-surface ratio Water handling Spill and leakage protection Local communities involvement
21 Key Insights Economy-wide implications: Emissions reduction supported by increasing natural gas supply and low prices Job creation in upstream, midstream, services and more U.S. manufacturing growth owing to affordable and reliable natural gas Unconventional resources are very heterogeneous Each play is different and there are no best recipe Industry is very dynamic Technology, players, and concerns continuously change We will continue our path forward into the bright future and shale resource will support it!
22 Shaping Further Conversation Discussion about future development must include major stakeholders, land owners/communities, regulators and producers, supported by: Comprehensive information and data collection/interpretation Understanding of each party interests and responsibilities Longer planning horizon to motivate investments with efficiency Lessons about Integration Consistency Integrity Transparency Communication
23 Wrapping Up Energy security dictates the energy mix. Oil and coal are secure and difficult to replace. Natural gas and nuclear are scalable, and cleaner. Renewables are growing regional supplements. Energy efficiency has major benefits. Take the long-term view and keep the perspective.
24 Thanks!