U.S. Small Wind Market: Progress through Challenges
|
|
|
- Frederica O’Brien’
- 5 years ago
- Views:
Transcription


1 U.S. Small Wind Market: Progress through Challenges Larry Flowers American Wind Energy Association


2
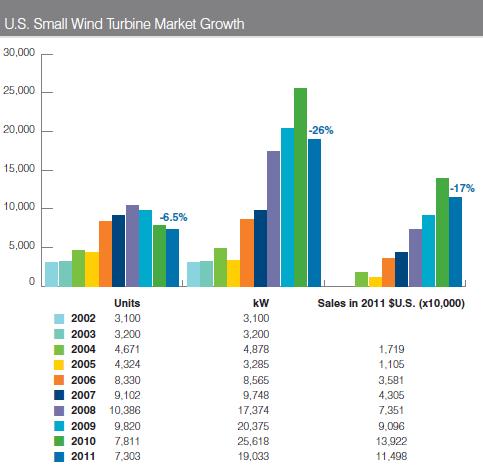
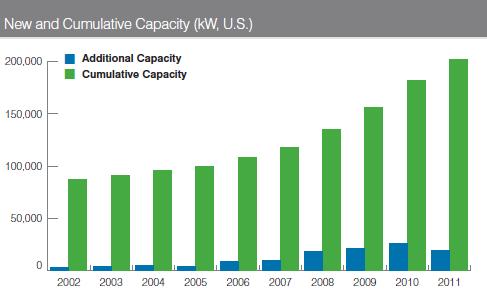
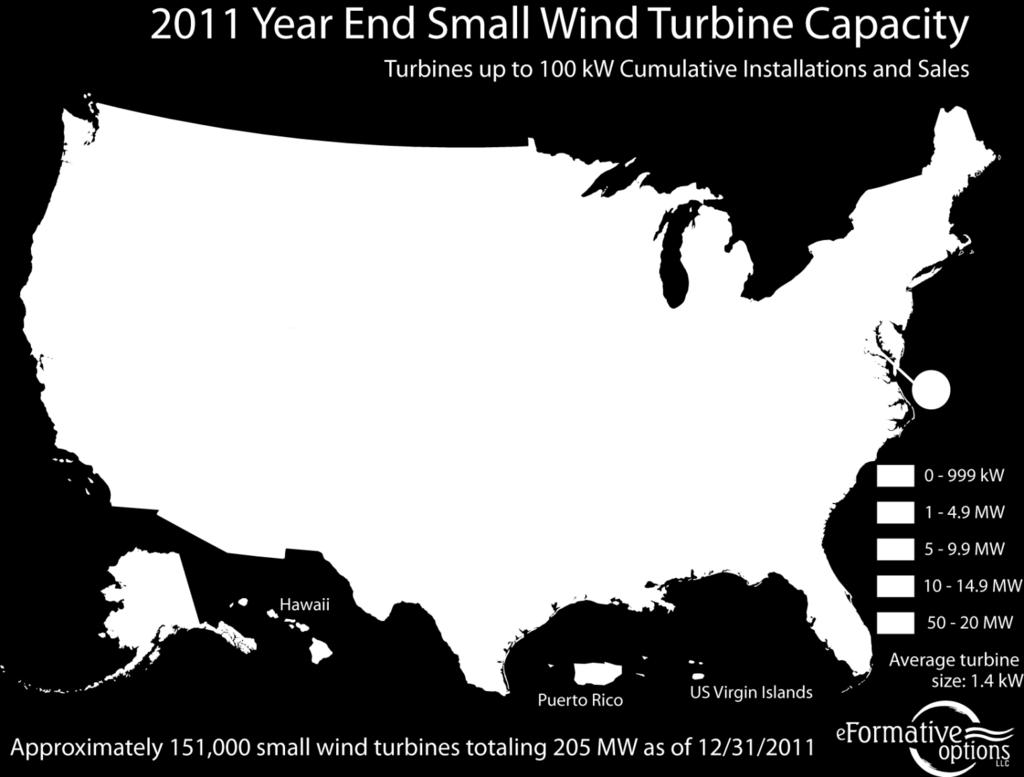
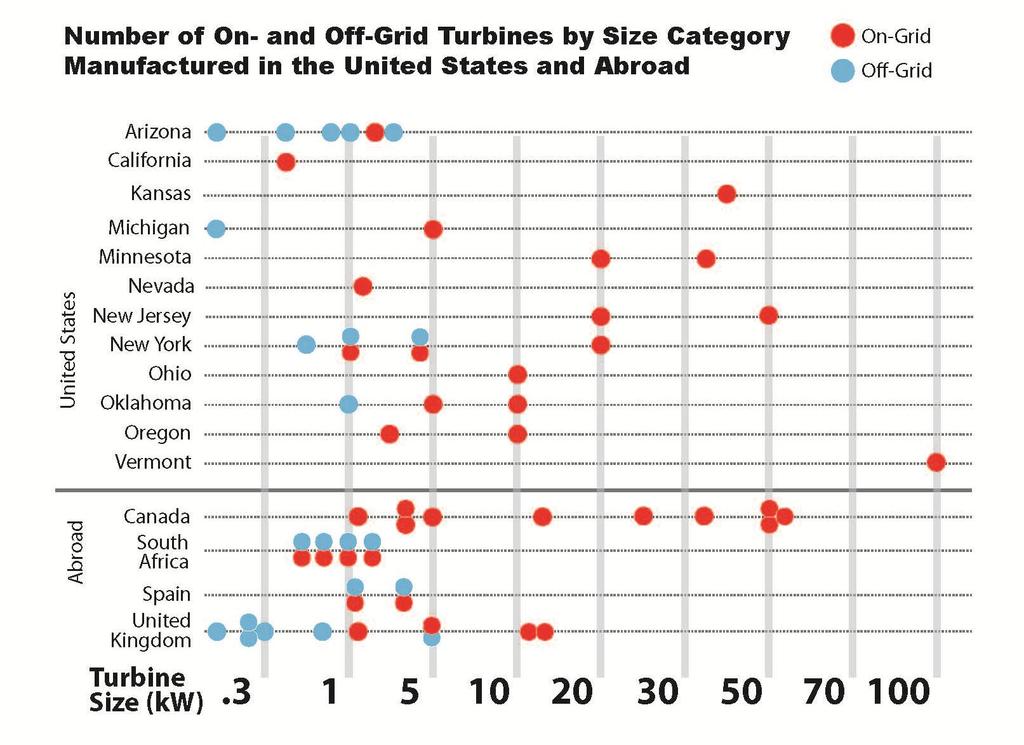
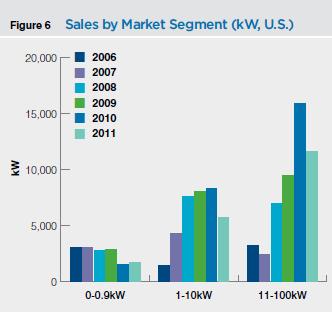
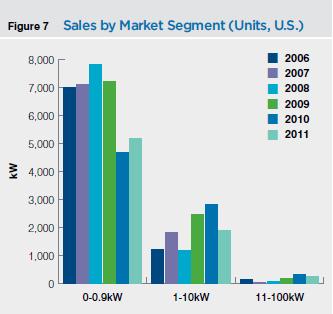
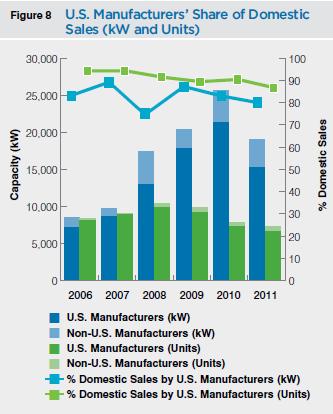
3 2011 U.S. Small Wind Market Highlights The 27 small wind turbine manufacturers from North America and Europe responding to AWEA s survey reported total 2011 worldwide sales of $397 million USD, totaling more than 21,000 units and 64 megawatts (MW). U.S. manufacturers combined domestic sales and exports were 33 MW, a 13.4 percent increase over Total U.S. cumulative sales (including imports) reached 198 MW, representing 151,300 total units installed in the United States in 2011 (annually displacing 178,000 metric tons of CO2) As a result of the poor economy and inconsistent incentives in 2011, the U.S. small wind market declined by 26 percent, with 19 MW of new sales, representing 7,303 turbines, and $115 million in installed system revenue; sales revenues declined by 17 percent, with units sold down by 6.5 %. Fifty-four percent of U.S. manufacturers sales capacity went to overseas markets, reflecting a dramatic increase (from 7.8 MW in 2010 to 17.7 MW in 2011). Eleven international manufacturers (including 4 from U.S.) reported total sales exceeding 1 MW. Domestic sales by U.S. manufacturers accounted for an 80 percent share of the 2011 U.S. market Sales of turbines in the United States for on-grid installations remained dominant, with a 91 percent market share of sales capacity, continuing the 2010 trend. Twenty-seven manufacturers with a U.S. sales presence, including those from Europe and Canada, reported sales of 57 wind turbine models The average installed cost of small wind turbines in the United States in 2011 was $6,040/kW, an 11 percent increase from 2010.
4
5
6
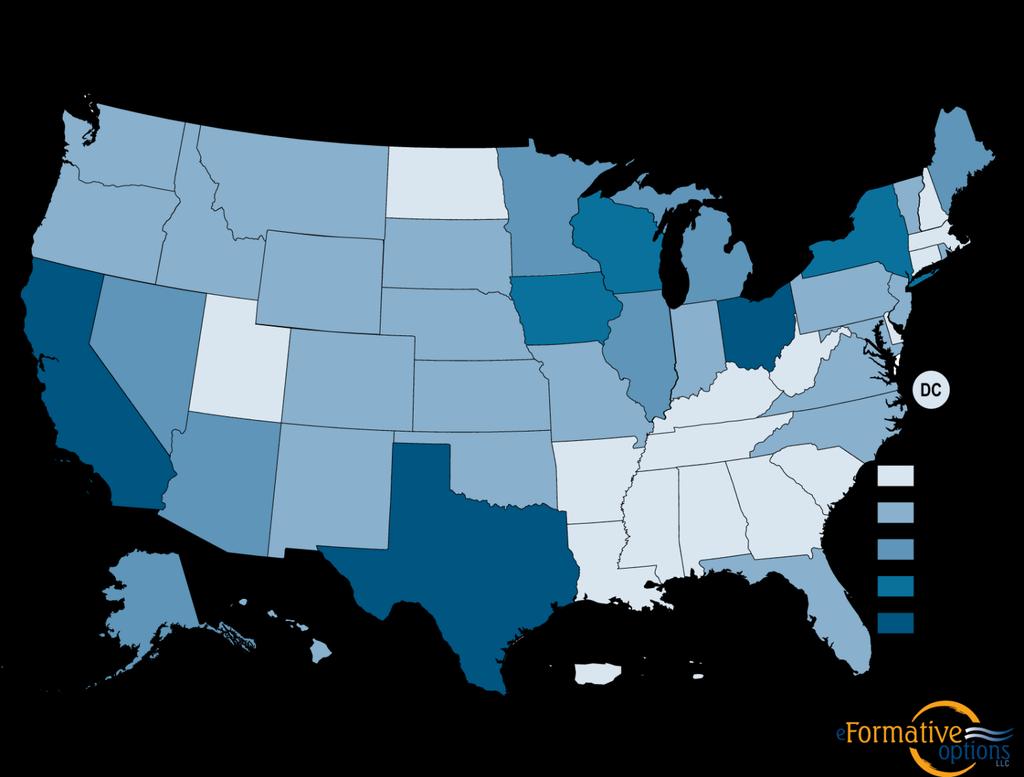
7 Small Wind Turbines Installed with Federal, State, Utility & Local Funding Assistance California Arizona Ohio Wisconsin Iowa New York Wyoming Vermont Washington Nevada Massachusetts Minnesota Montana Maryland Illinois Alaska Oregon New Jersey Colorado Kansas Nebraska Michigan Idaho Texas Virginia Pennsylvania Oklahoma Maine South Dakota Tennessee Utah North Carolina Arkansas Missouri North Dakota Connecticut Georgia New Mexico Rhode Island DC Units Installed pre-2010 Units Installed 2010 Units Installed 2011 Number of Units Installed
8
9
10
11

12
13 2011 Industry/Market Developments U.S. economy remained sluggish; residential market especially effected ; Ag and commercial markets for >10kW turbines remained good Dramatic shift in export markets (127% increase in kw exported) U.S. state incentive markets in turmoil (e.g., CA, NJ, WI, OH, NV) Innovative state policies in several eastern states showed promise First two turbine models certified to the AWEA standard by Small Wind Certification Council (SWCC); an additional 26 were in testing Interstate Turbine Advisory Council (ITAC) formed to address state incentive qualification guidelines and turbine performance requirements Average installed cost of SWT installed in US was $6040/kW, an 11% increase from 2010 U.S. small wind industry represents 1600 full-time equivalent jobs U.S. manufacturers maintained % domestic content
14 U.S. Small Wind Industry Challenges Inconsistent, erratic state incentive programs Non-certified turbine entrants Planning & Zoning ordinances (height, setbacks, sound) State RPS solar set-asides & solar RECs Competitive economics (PV, rural tariffs) Financing Utility resistance Site performance prediction USDA REAP program dramatically reduced USFWS guidelines* Public loss of energy/environment focus
15 Carpe Ventum parvum!

16 Certifying the Performance of Small Wind Turbines Larry Sherwood Executive Director Small Wind Certification Council May 16, 2012


17 Questions How can consumers make an apples to apples comparison between turbines? How can state incentive program managers objectively determine eligibility for incentive program funds?

18 Answer: Certification Consumer Label Single-number ratings Certificate Available online to confirm validity Summary Report Summary of testing Power curve Annual energy curve Tabulated Data

 8.")
19 2 Fully Certified Turbines Applicant Turbine Rated Annual 5m/s Bergey Windpower Co. Southwest Windpower Rated Sound Level Rated 11 m/s Certificatio n Granted Excel 10 13,800 kwh 42.9 db(a) 8.9 kw 11/16/2011 Skystream 3.7 3,420 kwh 41.2 db(a) 2.1 kw 12/19/2011


20 U.S. Solar Market Trends Larry Sherwood Sherwood Associates and IREC World Renewable Energy Forum May 16, 2012
21 Capacity (MW DC ) Capacity of Annual U.S. Grid-Tied PV Installations Utility Non-Residential Residential
22

23 Utility
24

25 Non-residential
26

27 350 Residential
28 $10 $9 $8 $7 $6 $5 $4 $3 $2 $1 $- U.S. PV Cost Trends < 5 kw kw --- >500 kw Source: Tracking the Sun IV: An Historical Summary of the Installed Cost of Photovoltaics in the United States from 1998 to 2010; 2011 data from IREC

29 Federal Tax Credits and Grants


30 Cash Grants Government purchases State Incentives
31 Millions of Dollars Treasury Cash Grant Awards $900 $800 $700 $600 $500 $400 $300 $200 $100 $


32 Grid-Tied PV Capacity by State for 2011 HI Other TX NC CA NY CO PA NM NJ AZ
33 State Policies Renewable Portfolio Standards Cash Rebates Utility Decision

34 IREC Solar Market Trends Report 2011 Report published in June or July
35 Thank you Larry Sherwood
36 The U.S. PV Market Trends In An Uncertain 2012 Andrew Krulewitz Solar Analyst, GTM Research
37 The Latest Installation Numbers Source: GTM Research/SEIA U.S. Solar Market Insight TM Strong Q4, supported by utility project completions and commercial market strength in CA and NJ
, NJ (SREC market correction), and NY (NY Solar Jobs Act) Source: GTM Research/SEIA U.S. Solar Market Insight TM")
38 Growth Across Market Segments Expect larger growth figures in the residential market in 2012 Commercial market more uncertain depends on NJ more than anywhere else Hope for new legislation in CA (net metering), NJ (SREC market correction), and NY (NY Solar Jobs Act) Source: GTM Research/SEIA U.S. Solar Market Insight TM

39 Key Market to Watch: NJ Source: GTM Research/SEIA U.S. Solar Market Insight TM

40 Key Markets to Watch for Growth: MA, NY, and HI Source: GTM Research/SEIA U.S. Solar Market Insight TM


41 Leading Installers/Developers Residential Commercial Rank Market Share Market Share 1 13% 9% Biggest change 2 6% 6% 3 5% 4% 4 4% 4% 5 4% 3% Source: GTM Research


42 U.S. Residential Solar Lease Landscape Tax Equity Providers Third-Party Finance Providers Finance Providers w/ Subcontracted Installations Residential Integrators/Finance Providers Module Suppliers w/ Residential Lease Programs Source: GTM Research
43 The Latest Utility Pipeline Source: GTM Research U.S. Utility PV Market Tracker Contracted pipeline keeps growing, but PPA bid landscape keeps getting more competitive Growing trend of suppliers acquiring 5-20 MW projects as a throughput enabler for their modules Source: GTM Research Utility PV Market Tracker


44 Independent Power Producers Upstream Entrants Vertically Integrated Manufacturers Utility Affiliates U.S. Utility Project Developer Taxonomy European PV Developers Foreign Entrants Pure Play U.S. PV Developers Divisions of Other Corporate Parents Joint Ventures Traditional Entrants Source: GTM Research Utility PV Market Tracker Corporate Entrants Source: GTM Research U.S. Utility PV Market Tracker Solar Managers LLC JV Entrants

45 Trade Petition - Understanding Market Impacts
46 Aligning Shipments and Installations Source: GTM Research, International Trade Commission
47 Notes on SolarWorld Trade Petition Source: U.S. International Trade Commission
48 Constraints Drivers The Spectrum of Possibilities for 2012 Module Pricing Project Financing State Market Dynamics Global Oversupply Increased Tax Equity from Corporates, New Entrants NJ: S2371 Growth in MO, IL, PR PA: HB 1580 Global Supply/Demand Balance Chinese Cell /Module Import Duty 1603 Cash Grant Extension Tax Equity Supply State Legislation New Market Development Global Undersupply Small Duty; Chinese Suppliers Remain Active Large Duty; Disappearance of Chinese Suppliers Tax Equity Bottleneck, Rates >15%- 20% OH RPS Roll- Back CSI Funding Depletion
49 Thank You Andrew Krulewitz Solar Analyst, GTM Research GTM RESEARCH, a Greentech Media company, provides critical and timely market analysis in the form of concise and long-form market research reports, monthly newsletters and strategic consulting services /

50 Vermont Solar Logger ASES - Denver
51 Vermont Distributed Generation Policy and Market Trends VT trends largely in line with CESA survey trends of 2009 Increasing installations, lower prices for PV, rising prices for solar thermal and small wind, decreasing incentive levels, more focus on reducing non capital costs. ASES - Denver


52 626,000 people Vermont 308,000 electric customers ASES - Denver
53 Primary DG Policies Driving the VT Market Net Metering Plus+ Solar adder for PV $0.20/kWhr applied to entire bill, not just kwhr charge State-wide permit w/ registration of small systems Group/Virtual net metering Rebate/incentives = ~15-25% of cost. Standard Offer/Feed In Tariff Total of 127.5MW. Adding market-based pricing ASES - Denver
54 Trends - PV $3.00 Vermont PV Incentive ($/Watt) $2.50 $2.00 $1.50 $1.00 $0.50 $ PV Systems Installed/Yr ASES - Denver
55 Trends Solar Hot Water $3.00 Solar Hot Water Incentive ($/100Btu/day) $2.50 $2.00 $1.50 $1.00 $0.50 $ Solar Hot Water Systems Installed/Yr ASES - Denver
56 Cost Trends $12.00 PV - Average Installed $/W $10.00 $8.00 $6.00 $4.00 $2.00 $ SHW - Average Installed $/kbtu/day $160 $140 $120 $100 $80 $60 $40 $20 $- ASES - Denver

57 Distributed Wind ASES - DENVER of 10

58 ASES - Denver
59 Vermont Clean Energy Development Fund Andrew Perchlik