Climate MRV for Africa Phase 2 Development of National GHG Inventory Petrochemical & Carbon Black Production Methanol
|
|
|
- Ella Waters
- 5 years ago
- Views:
Transcription


1 Climate MRV for Africa Phase 2 Development of National GHG Inventory Petrochemical & Carbon Black Production Methanol Lead partner Project of the European Commission DG Clima Action EuropeAid/136245/DH/SER/MULTI Amr Osama Abdel-Aziz, Assen Gasharov, Mike Bess and Laura Lahti Team Leader and Key Experts March 2017
, update to the WRI 2000 figure, using 2012 data")
2 PETROCHEMICAL AND CARBON BLACK PRODUCTION and Global GHG Emissions Source: ASN Bank and Ecofys (2016), update to the WRI 2000 figure, using 2012 data
.")
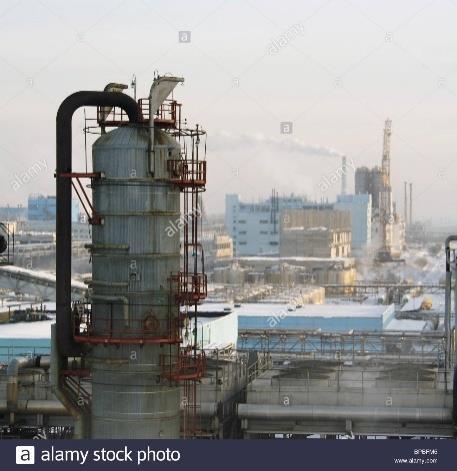
3 INTRODUCTION: PETROCHEMICAL AND CARBON BLACK PRODUCTION Petrochemical industry uses fossil fuels or petroleum refinery products as feed stocks. The use of primary fossil fuels may involve partial combustion of the hydrocarbon content for heat raising and the production of secondary fuels (e.g., off gases). Combustion emissions from fuels obtained from the feedstocks should be allocated to the source category in the IPPU Sector.
4 METHANOL PROCESS DESCRIPTIONS Conventional Reforming Process Conventional Reforming Process for methanol production involves steam reforming and methanol synthesis. Conventional Reforming for methanol production may utilize CO2 captured from other processes as a supplemental feedstock.

5 METHANOL PROCESS DESCRIPTIONS Combined Reforming Process Combined Reforming Process combines the Conventional Steam Reforming process with Catalytic Partial Oxidation process.22 The Combined Reforming Process produces a purge gas containing CH4 that is burned for energy recovery within the methanol process.

6 Methanol production feedstock-product flow diagram
7 Decision Tree for Estimation of CO2 Emissions
8 Decision Tree for Estimation of CH4 Emissions
9 Tier 1 Method
10 IPCC 2006: Tier 1 Method Tier 1 method calculates emissions from petrochemical processes on the basis of activity data for production of each petrochemical and the process-specific emission factor for each petrochemical, (e.g., methanol).
11 IPCC 2006: Tier 1 Method If activity data for annual primary product production are not available, primary product production may be estimated from feedstock consumption.
12 Tier 1 CO2 Emissions
13 Tier 1 CO2 Emissions
14 Tier 1 CH4 Emissions CH4 emissions from the plants accounted for approximately 0.5 percent to 1.0 percent of the total greenhouse gas emissions from the plants. The default CH4 emission factor to be applied for methanol production is 2.3 kg CH4 per tonne of methanol produced.
15 Much of the uncertainty in emission estimates is related to the difficulty in determining activity data. If assuming that all of the national methanol production is from natural gas feedstock, such assumption would introduce some uncertainty.
16 QUALITY ASSURANCE AND QUALITY CONTROL Emission Factors Tier 1 method depends upon the application of activity data production and/or activity data for feedstock consumption. Activity data should not be expected to vary by more than about +/- 10 percent year to year. If the activity data vary by more than about +/- 10 % year to year, it is good practice to assess and document the country-specific conditions that account for the differences.
17 Tier 2 Method
18 IPCC 2006: Tier 2 Method The Tier 2 method is a feedstock-specific and processspecific carbon balance approach. This approach is applicable in cases where activity data are available for both feedstock consumption and primary and secondary product production and disposition.
19 IPCC 2006: Tier 2 Method Tier 2 method is a feedstock-specific and process-specific carbon balance approach. This approach is applicable in cases where activity data are available for both feedstock consumption and primary and secondary product production and disposition. Activity data for all carbon flows are required to implement the Tier 2 methodology.
20 Tier 2 : Carbon mass balance flow diagram
21 Tier 2 : Carbon mass balance flow diagram Tier 2 method calculates the difference between the total amount of carbon entering into the production process (primary and secondary feedstock) and the amount of carbon leaving the production process as methanol. The value of SPi,j is zero for the methanol, as there are no secondary products produced from this processes.
22 QUALITY ASSURANCE AND QUALITY CONTROL Emission Factors Tier 2 method depends upon the application of activity data production and/or activity data for feedstock consumption. Activity data should not be expected to vary by more than about +/- 10 percent year to year. If activity data vary by more than about +/-10 % year to year, it is good practice to assess and document the country-specific conditions that account for the differences.
23 Tier 3 Method
24 Tier 3 : direct estimate of plant-specific emissions In order to apply the Tier 3 method, plant-specific data and/or plantspecific measurements are required. Overall CO2 emissions from the petrochemical production process are calculated using Equation 3.20 E combustion and E flare are given by Equations 3.21 and 3.22 where plant specific or national net calorific value data should be used.
25 Tier 3 : direct estimate of plant-specific emissions
26 Activity Data Emissions of CO2 may be calculated from specific feedstock (e.g., natural gas) consumption, production activity data and carbon mass balance calculations. Plant-specific activity data should be obtained from the production plants. Direct measurements of the total flow to the steam cracker and flare system and analysis of the gas carbon content provide accurate emissions estimate. Plant specific energy balance and/or carbon balance may also be used to derive plant specific emission factors.
27 Uncertainty Assessment Much of the uncertainty in emission estimates for methanol production is related to the difficulty in determining activity data. If activity data are not available for consumption feed-stocks other than natural gas, it may be assumed that all of the national methanol production is from natural gas feedstock. This assumption would introduce some uncertainty.
28 QUALITY ASSURANCE AND QUALITY CONTROL It is good practice to check the consistency of the total annual consumption figure with the production, import and export data. It is recommended to compare the amounts discarded, recovered and combusted and the amount used in 2-stroke engines, if available, with total consumption figures to check consistency of activity data and ODU factors.
29 Thank you! Amr Osama Abdel-Aziz, Assen Gasharov, Mike Bess and Laura Lahti