PAKISTAN SPACE & UPPER ATMOSPHERE RESEARCH COMMISSION (SUPARCO)
|
|
|
- Luke Higgins
- 5 years ago
- Views:
Transcription

 Sector 28, Gulzar-e-Hijri")

1 AMBIENT AIR QUALITY AT DREAMWORLD, PIDC AND BALOCH COLONY, KARACHI PAKISTAN SPACE & UPPER ATMOSPHERE RESEARCH COMMISSION (SUPARCO) Sector 28, Gulzar-e-Hijri SUPARCO Road, P.O.Box 8402, Karachi Phone: (92-21) , Fax: (92-21)
2 DISCLAIMER This report containing 28 pages is produced in compliance with the request of M/s Dreamworld, Karachi for ascertaining ambient air quality and noise monitoring at three (03) sites for 24 hour at each sites. The report cannot be used in court of law for any negotiation or standardization. The information contained in this report has been verified by SUPARCO experts and any changes made hereafter would not be the SUPARCO s responsibility. Environmental Monitoring & Modeling Division Page ii
3 PREPARED BY: Name: Mr. Muhammad Khalid Designation: Research Associate, SUPARCO Signature CHECKED BY: Name: Muhammad Sarfraz Khan Designation: Manager, SUPARCO Signature APPROVED BY: Name: Dr. M. Mansha Designation: General Manager, SUPARCO Signature SUBMITTED TO: M/S Dreamworld, Karachi. Environmental Monitoring & Modeling Division Page iii
4 LIST OF ABBREVIATIONS SUPARCO NO x SO 2 CO O 3 PM 10 PM 2.5, SPM µg/m 3 mg/m 3 Sindh EPA US EPA SEQS WHO PIDC ND Pakistan Space & Upper Atmosphere Research Commission Oxides of Nitrogen Sulfur Dioxide Carbon Monoxide Ozone Particulate Matter Less than or equal to 10 micron Particulate Monitor less than or equal to 2.5 micron Suspended Particulate Matter Microgram per cubic meter Milligram per cubic meter Sindh Environmental Protection Agency Environmental Protection Agency of USA Sindh Environmental Quality Standards World Health Organization Pakistan Industrial Development Corporation Not Detected Environmental Monitoring & Modeling Division Page iv
5 Executive Summary It has been recognized worldwide that ambient air quality is being contaminated with pollutants and worsening due to rise in industrialization and urbanization along with a great increase in use of vehicles and energy. Breathing of clean air is basic necessity for healthy life of human being. However, ambient air quality is polluted due to manmade activities related to economic and social development. Human contact to air contamination, generated due to development activity, may result in a variety of health effects. This study is carried out in order to promote and regulate the sustainable and environmental friendly development and the compliance to the national legislative regulations like Pakistan Environmental Act, 1997, EIA/IEE regulation 2000 and Sindh Environmental Act, 2014 etc. M/s Dreamworld, Karachi acquired the services of SUPARCO for Ambient Air Quality Monitoring of three different sites. Ambient air quality monitoring was carried out for acquisition of criteria pollutant (NOx, SO 2, CO, O 3, PM 2.5, PM 10, SPM and Lead) as per Sindh Environmental Guidelines at three selected locations. The sites were located at Dreamworld (Gushan-e-Maymar), Near PIDC and Baloch Colony. The results of the monitoring are compared to the limit values set out in SEQS on ambient air quality. The levels of all the pollutants at Dreamworld were well within the prescribed limits of Sindh Environmental Standards. On the other hand at PIDC the average levels of Nitric Oxide, Carbon Monoxide, Lead and PM 10 were higher than the prescribed limit and at Baloch Colony average levels of Nitric Oxide, Nitrogen Dioxide, Carbon Monoxide, Lead and PM 10 were higher than the prescribed limit of Sindh Environmental Standards. Authors Environmental Monitoring & Modeling Division Page v
6 TABLE OF CONTENTS 1. INTRODUCTION Objectives METHODOLOGY Data Acquisition Criteria Ambient Air Quality Monitoring Methods and Ambient Air Quality Standards Work Plan Air Quality Data Acquisition Plan GENERAL DISCUSSION AND RESULTS Oxides of Nitrogen (NO X ) Monitoring Results of NO X Sulfur Dioxide (SO2) Monitoring Results of SO Carbon Monoxide (CO) Monitoring Results of CO Ozone (O3) Monitoring Results of Ozone Particulate Matter (PM10,PM2.5 and TSP) Monitoring Results of PM Monitoring Results of PM Monitoring Results of SPM Lead in Ambient Air Testing Results of Lead in Ambient Air CONCLUSION Annexure-A... Error! Bookmark not defined. (Monitoring Data)... Error! Bookmark not defined. Annexure-B (Air Quality Monitoring Photograph) Environmental Monitoring & Modeling Division Page vi
7 LIST OF FIGURE Figure # Title Page # Figure A Location Map of Monitoring Sites of the Project 2 Figure 1 (a) Min, Max & Avg (24 Hrs) Concentration of NO at three different sites of the Project 7 Figure 1 (b) Min, Max & Avg (24 Hrs) Concentration of NO 2 at three different sites of the Project 7 Figure 2 Min, Max & Avg (24 Hrs) Concentration of SO 2 at three different sites of the Project 9 Figure 3 Minimum, Maximum and Average (24hrs) Concentration of CO at three different sites of the Project 10 Figure 4 Minimum, Maximum and Average (24hrs) Concentration of O 3 at three different sites of the Project 11 Figure 5(a) Figure 5(b) Average (24hrs) Concentration of PM 2.5 at three different sites of the 13 Project Average (24hrs) Concentration of PM 10 at three different sites of the Project 14 Figure 5(c) Average (24hrs) Concentration of SPM at three different sites of the Project 15 Figure 6 Concentration of Lead (Pb) at three different sites of the Project 16 Figure 7 Average Pollutants Concentration at three different sites of Karachi 20 LIST OF Table Table Title Page # Table 1 Concentration limits of Equipment 3 Table 2 Ambient Air Quality Monitoring Methods 3 Table 3 Table4 Ambient Air Quality Standards of SEQS, USEPA, WHO and World Bank Ambient Air Monitoring Average Results 4 19 Environmental Monitoring & Modeling Division Page vii
8 1. INTRODUCTION Dreamworld Family Resort is one of the pioneer vacation spot in the city with all the essential features you are looking for. Dreamworld provides great picnics and day out arrangements to the corporate sector, to families, school and college students. Enjoy the unique and most exciting experience by going for a picnic or day out at Dreamworld Resort with adventurous attractions to make your soul feel completely relaxed and relieved. An environment where you can just relax and enjoy tons of thrilling facilities and rides with mouthwatering food at Galaxy Restaurant, Café Lagoon, Café Aroma, Saffron Lawn or Dhaba Restaurant. 1.1 Objectives The main objective of this study is to carryout environmental monitoring at three (03) sites of Karachi, to ascertain the existing environmental conditions of the three sites of Karachi. 2. METHODOLOGY To assess the status of environmental conditions especially ambient air quality, SEQS parameter (NO X, SO 2, CO, O 3, SPM, PM 10, and PM 2.5 ) were monitored at designated location identified by the client. SUPARCO collected the ambient air quality data using its USEPA recommended monitoring equipment at Three (03) sites of Karachi. 2.1 Data Acquisition Criteria a. Air Quality data (concentration) of criteria pollutants such as NOx (as sum of NO & NO 2 ), SO 2, CO, O 3, Pb, PM 10, and PM 2.5 along with additional Noise Level Monitoring were also collected at site. b. The meteorological parameters (Wind Speed, Wind Direction, Temperature and Relative Humidity) were also measured at site c. The lead concentration is calculated by gravimetric sampling and analysis on Inductively Coupled Plasma Mass Spectrometry (ICP-MS) Environmental Monitoring & Modeling Division Page 1

9 d. The data (air quality parameters and meteorological parameters) was collected with interval of 01 hour for 24 hours. Minimum detection limits for analyzers are given in Table 1 for monitoring the air quality. Figure A: Location Map of Monitoring Sites of the Project Environmental Monitoring & Modeling Division Page 2
10 Table 1: Concentration limits of Equipment Equipment Min. Concentration Limits SO 2 Analyzer ~1 µg/m 3 CO Analyzer < 0.5 mg/m 3 NOx (NO+NO 2 ) Analyzer ~ 1 µg/m 3 PM 2.5 /PM 10 Sampler ~ 5 µg/m 3 Noise Meter ~ 30 db 2.2 Ambient Air Quality Monitoring Methods and Ambient Air Quality Standards The air quality parameters were measured using the state of the art instruments based upon the USEPA and ASTM methods as given in Table 2. The ambient air quality standards/guidelines of Sindh EPA, USEPA, WHO and World Bank for data analysis and comparison are given in Table 3. Table 2: Ambient Air Quality Monitoring Methods Table 2.1: Ambient Air Quality Monitoring Methods (USEPA) Pollutants Title of US EPA 40 CFR Methods NO X SO 2 Reference Method in Appendix F of 40 CFR Part 50 Ambient Monitoring Reference & Equivalent Method of 40CFR Part 52 CO Method in Appendix C of 40 CFR Part 50 SPM PM 10 PM 2.5 O 3 Lead Reference Method in Appendix J of 40 CFR Part 50 Reference Method in Appendix J of 40 CFR Part 50 Reference Method of 40 CFR Appendix L of Part 50 Reference Method in Appendix D of 40 CFR Part 50 Reference Method in Appendix G of 40 CFR Part 50 Chemiluminescence UV Fluorescence Method IR Gas Filter Correlation Gravimetric method Beta Source Beta Source UV Photometry 1 ICPMS Environmental Monitoring & Modeling Division Page 3
11 Table 3: Ambient Air Quality Standards of SEQS, USEPA, WHO and World Bank Pollutants SO 2 USEPA WHO World Bank SEQS Avg. Time 1 HRS 3 HRS Standard 75 ppb 500 ppb Avg. Time 24 HRS 1 min Standard 20 ug/m 3 (34 ppb) 500 ug/m3 Avg. Time ANNUAL MEAN 24 HRS Standard 100 µg/m 3 (38 ppb) 500 ug/m3 Avg. Time ANNUAL MEAN 24 HRS Standard 80 ug/m3 120 ug/m3 CO 8 HRS 1 HR 9 ppm 35 ppm 8 HRS 10 mg/m3 (8.7 ppm) HRS 1 HR 5 mg/m3 10 mg/m3 NO 2 24 Hrs ANNUAL MEAN 100 ppb 53 ppb 1 HRS 1 y 200 ug/m3 40 ug/m3 ANNUAL MEAN 100 µg/m 3 (50 ppb) ANNUAL MEAN 24 HRS 40 ug/m3-80 ug/m3 O 3 8 HRS 0.07 ppm 8 HRS HR 130 ug/m3 100 µg/m SPM PM 10 PM 2.5 Lead 24 HRS 24 Hrs ANNUAL MEAN Monthly 150 µg/m HRS 1 y 24 HRS 1 y A.MEAN 24 HRS A.MEAN 24 HRS 360 ug/m3 500 ug/m3 120 ug/m3 150 ug/m HRS 75 ug/m µg/m HRS 1.5 µg/m Work Plan The work plan followed for data acquisition was as under; Site-1 (Dreamworld) Commencing Date : Completion Date : Duration : 01 day Environmental Monitoring & Modeling Division Page 4
12 Site-2 (PIDC) Commencing Date : Completion Date : Duration : 01 day Site-3 (Baloch Colony) Commencing Date : Completion Date : Duration : 01 day Supervisor and Field Monitoring Officials: 1. Mr. Muhammad Safraz Khan (Manager) 2. Mr. Muhammad Khalid (Research Associate) 3. Mr. Hassan Raza (Sub Engineer) 4. Mr. Syed Waqar Ali (Sub Engineer-II) 2.4 Air Quality Data Acquisition Plan Site 1 Dreamworld (N ' 06", E ' 32 " ) Starting Date: Starting Time: 1300 Completion Date: Completion Time: 1300 Sampling Duration: 24 Hours Environmental Monitoring & Modeling Division Page 5
13 Site 2 PIDC Bridge ( ' 44.4" N, ' 18.1 " E) Starting Date: Starting Time: 1700 Completion Date: Completion Time: 1700 Sampling Duration: 24 Hours Site 3 Baloch Colony Bridge ( N, E) Starting Date: Starting Time: 1000 Completion Date: Completion Time: 1000 Sampling Duration: 24 Hours 3. GENERAL DISCUSSION AND RESULTS 3.1 Oxides of Nitrogen (NO X ) Nature and Sources: Nitrogen oxides (NO X ), a mixture of Nitric oxide (NO) and Nitrogen dioxide (NO 2 ), are produced from natural sources, motor vehicles and other fuel combustion processes. NO is colorless and odorless and is oxidized in the atmosphere to form NO 2. NO 2 is an odorous, brown, acidic, highly corrosive gas that can affect our health and environment. NO X are critical components of photochemical smog, NO 2 produces the yellowish-brown color of the smog. Nitrogen dioxide belongs to a family of highly reactive gases called oxides of nitrogen (NOx). These gases form when fuel is burned at high temperatures, and come principally from motor vehicle exhaust and stationary sources such as electric utilities and industrial boilers. A suffocating, brownish gas, nitrogen dioxide is a strong oxidizing agent that reacts in the air to form corrosive nitric acid, as well as toxic organic nitrates. It also plays a major role in the atmospheric reactions that produce ground-level ozone (or smog). Environmental Monitoring & Modeling Division Page 6
. While, average concentration (µg/m3) of NO was 3.7, 54.6 and 117.1 at Site-1, Site-2 and Site-3 respectively.")
 of NO 2 was 9.4, 20.1 and 189.9 at Site-1, Site-2 and Site-3 respectively.")
14 3.1.1 Monitoring Results of NO X The measured minimum concentration of NO of the Project was 3.1µg/m 3 at Site-1 (Dreamworld). Similarly the maximum observed concentration of NO was 298.9µg/m 3 at Site- 3 (Baloch Colony Bridge). While, average concentration (µg/m3) of NO was 3.7, 54.6 and at Site-1, Site-2 and Site-3 respectively. The measured minimum concentration of NO 2 of the Project was 8.3µg/m 3 at Site- 1 (Dreamworld). Similarly the maximum observed concentration of NO 2 was 308.1µg/m 3 at Site-3 (Baloch Colony Bridge). While, average concentration (µg/m 3 ) of NO 2 was 9.4, 20.1 and at Site-1, Site-2 and Site-3 respectively. Figure 1 (a): Min, Max & Avg (24 Hrs) Concentration of NO at three different sites of the Project Figure 1 (b): Min, Max & Avg (24 Hrs) Concentration of NO 2 at three different sites of the Project Environmental Monitoring & Modeling Division Page 7
15 The average levels of NO at Site-2 (PIDC Bridge) and Site-3 (Baloch Colony Bridge) were higher than the prescribed limits of international and SEQS standards while the average levels of NO at Site-1(Dreamworld) was within the prescribed limits of SEQS (see Table 3 for reference) for ambient air quality as shown in Figures 1(a). The average levels of NO 2 at Site-3 (Baloch Colony Bridge) was higher than the prescribed limits of international and SEQS standards while the average levels of NO 2 at Site-1(Dreamworld) and Site-2 (PIDC Bridge) were within the prescribed limits of SEQS (see Table 3 for reference) for ambient air quality as shown in Figures 1(b). 3.2 Sulfur Dioxide (SO2) Nature and Sources: Sulfur dioxide belongs to the family of sulfur oxide gases (SOx). These gases are formed when fuel containing sulfur (mainly coal and oil) is burned, and during metal smelting and other industrial processes. Health and Other Effects: The major health concerns associated with exposure to high concentrations of SO2 include effects on breathing, respiratory illness, alterations in pulmonary defenses, and aggravation of existing cardiovascular disease. Major subgroups of the population that are most sensitive to SO2 include asthmatics and individuals with cardiovascular disease or chronic lung disease (such as bronchitis or emphysema) as well as children and the elderly. Together, SO2 and NOX are the major precursors to acid rain, which is associated with the acidification of lakes and streams, accelerated corrosion of buildings and monuments, and reduced visibility Monitoring Results of SO2 The measured minimum concentration of SO2 of the Project was 5.2µg/m 3 at Site- 1 (Dreamworld). Similarly the maximum observed concentration of SO2 was 46µg/m 3 at Site-2 (PIDC Bridge). While, average concentration (µg/m 3 ) of SO2 was 6.8, 13.7 and 15.0 at Site-1, Site-2 and Site-3 respectively. Environmental Monitoring & Modeling Division Page 8
 were within the prescribed limits of SEQS (see Table 3")
16 Figure 2: Min, Max & Avg (24 Hrs) Concentration of SO 2 at three different sites of the Project The average levels of SO 2 at Site-1(Dreamworld), Site-2 (PIDC Bridge) and Site-3 (Baloch Colony Bridge) were within the prescribed limits of SEQS (see Table 3 for reference) for ambient air quality as shown in Figure Carbon Monoxide (CO) Nature and Sources: Carbon monoxide is a colorless odorless poisonous gas formed when carbon in fuels is not burned completely. It is a byproduct of motor vehicle exhaust, which contributes more than two-thirds of all CO emissions nationwide. In cities, automobile exhaust can cause as much as 95 percent of all CO emissions. These emissions can result in high concentrations of CO, particularly in local areas with heavy traffic congestion. Other sources of CO emissions include industrial processes and fuel combustion in sources such as boilers and incinerators. Despite an overall downward trend in concentrations and emissions of CO, some metropolitan areas still experience high levels of CO. Health and Other Effects: Carbon monoxide enters the bloodstream and reduces oxygen delivery to the body's organs and tissues. The health threat from CO is most serious for those who suffer from cardiovascular disease. Healthy individuals are also affected, but only at higher levels of exposure. Exposure to elevated CO levels is Environmental Monitoring & Modeling Division Page 9
. Similarly the maximum observed concentration of CO was 10.")
17 associated with visual impairment, reduced work capacity, and reduced manual dexterity, poor learning ability, and difficulty in performing complex tasks Monitoring Results of CO The measured minimum concentration of CO of the Project was 0.2mg/m3 at Site- 1 (Dreamworld). Similarly the maximum observed concentration of CO was 10.9mg/m3 at Site-3 (Baloch Colony). While, average concentration (mg/m 3 ) of CO was 0.4, 5.5 and 7.2 at Site-1, Site-2 and Site-3 respectively. Figure 3: Minimum, Maximum and Average (24hrs) Concentration of CO at three different sites of the Project The average levels of CO at Site-2(PIDC Bridge) and Site-3 (Baloch Colony Bridge) were higher than the prescribed limits of international and SEQS standards while the average levels of CO at Site-1(Dreamworld) were within the prescribed limits of SEQS (see Table 3 for reference) for ambient air quality as shown in Figures Ozone (O3) Nature and Sources of the Pollutant: Ground-level ozone (the primary constituent of smog) is the most complex, difficult to control, and pervasive of the six principal pollutants. Unlike other pollutants, ozone is not emitted directly into the air by specific sources. Ozone is created by sunlight acting on nitrogen oxides (NOx) and volatile organic compound (VOC) emissions in the air. Some of the more common sources include gasoline vapors, chemical solvents, combustion products of various Environmental Monitoring & Modeling Division Page 10

18 fuels, and consumer products. They can originate from large industrial facilities, gas stations, and small businesses such as bakeries and dry cleaners. Often these "precursor" gases are emitted in one area, but the actual chemical reactions, stimulated by sunlight and temperature, take place in another. Combined emissions from motor vehicles and stationary sources can be carried hundreds of miles from their origins, forming high ozone concentrations over very large regions. Potential Health Impacts; studies indicated that ground-level ozone not only affects people with impaired respiratory systems (such as asthmatics), but healthy adults and children as well. Exposure to ozone for 6 to 7 hours, even at relatively low concentrations, significantly reduces lung function and induces respiratory inflammation in normal, healthy people during periods of moderate exercise. It can be accompanied by symptoms such as chest pain, coughing, nausea, and pulmonary congestion. Recent studies provide evidence of an association between elevated ozone levels and increases in hospital admissions for respiratory problems Monitoring Results of Ozone The measured minimum concentration of O 3 of the Project was 3.6µg/m3 at Site-1 (Dreamworld). Similarly, the maximum observed concentration of O 3 was 249µg/m3 at Site-2 (PIDC Bridge). While, average concentration (µg/m3) of O 3 was 4.8, 69.0 and 50.4 at Site-1, Site-2 and Site-3 respectively. Figure 4: Minimum, Maximum and Average (24hrs) Concentration of O 3 at three different sites of the Project The average levels of Ozone were well within the prescribed limits of SEQS (see Table 3 for reference) for ambient air quality as shown in Figures 4. Environmental Monitoring & Modeling Division Page 11
19 3.5 Particulate Matter (PM10,PM2.5 and TSP) Nature and Sources: Particulate matter is the term for solid or liquid particles found in the air. Some particles are large or dark enough to be seen as soot or smoke. Others are so small they can be detected only with an electron microscope. Because particles originate from a variety of mobile and stationary sources (diesel trucks, wood stoves, power plants, etc.), their chemical and physical compositions vary widely. Particulate matter (PM) is a complex mixture consisting of varying combinations of dry solid fragments, solid cores with liquid coatings and small droplets of liquid. These tiny particles vary greatly in shape, size and chemical composition, and can be made up of different materials such as metals, soot, soil and dust. PM may also contain sulfate particles. PM may be divided into many size fractions, measured in microns (a micron is one-millionth of a meter). Sindh EPA regulates three classes of particles - particles up to 10 microns (PM 10 ), particles up to 2.5 microns in size (PM 2.5 ) and Total Suspended Particulate as TSP. PM 2.5 particles are a subset of PM 10 whereas PM 10 particles are subset of TSP. Health and Other Effects: Health Major Concerns for human health from exposure to particulate matter are: effects on breathing and respiratory systems, damage to lung tissue, cancer, and premature death. The elderly, children, and people with chronic lung disease, influenza, or asthma, tend to be especially sensitive to the effects of particulate matter. Acidic particulate matter can also damage manmade materials and is a major cause of reduced visibility Monitoring Results of PM2.5 The measured minimum concentration of PM 2.5 of the Project was 15.1µg/m3 at Site-1 (Dreamworld). Similarly the maximum observed concentration of PM 2.5 was 90.7µg/m3 at Site-2 (PIDC Bridge). While, average concentration (µg/m3) of PM 2.5 was 19.4, 50.1 and 58.0 at Site-1and Site-2 respectively. Environmental Monitoring & Modeling Division Page 12
 were well also within the prescribed limits of SEQS (see Table 3 for reference) for ambient air quality. 3.5.2 Monitoring Results of PM10 The average concentration (µg/m3) of PM 10 observed on Site-1, Site-2 and Site-3 respectively were 82.")
20 Figure 5(a): Average (24hrs) Concentration of PM 2.5 at three different sites of the Project The measured concentrations of PM 2.5 (µg/m 3 ) were well also within the prescribed limits of SEQS (see Table 3 for reference) for ambient air quality Monitoring Results of PM10 The average concentration (µg/m3) of PM 10 observed on Site-1, Site-2 and Site-3 respectively were 82.6, and Environmental Monitoring & Modeling Division Page 13
 was within the prescribed limits of SEQS (see Table 3 for reference) for ambient air quality")
21 Figure 5(b): Average (24hrs) Concentration of PM 10 three different sites of the Project The average levels of PM10 at Site-2(PIDC Bridge) and Site-3 (Baloch Colony Bridge) were higher than the prescribed limits of international and SEQS standards while the average levels of CO at Site-1(Dreamworld) was within the prescribed limits of SEQS (see Table 3 for reference) for ambient air quality as shown in Figures 5(b) Monitoring Results of SPM The measured average concentration of SPM (µg/m 3 ) was 221, 399 and at Site-1, Site-2 and Site-3 respectively. Environmental Monitoring & Modeling Division Page 14
 for ambient air quality as shown in Figures 5(c). 3.6 Lead in Ambient Air Lead (Pb) is a metal found naturally in the environment as well as in manufactured products.")
22 Figure 5(c): Average (24hrs) Concentration of SPM at three different sites of the Project The measured concentrations of SPM (µg/m 3 ) were well also within the prescribed limits of SEQS (see Table 3 for reference) for ambient air quality as shown in Figures 5(c). 3.6 Lead in Ambient Air Lead (Pb) is a metal found naturally in the environment as well as in manufactured products. The major sources of lead emissions have historically been from fuels in onroad motor vehicles (such as cars and trucks) and industrial sources. The highest levels of lead in air are usually found near lead smelters. The major sources of lead emissions to the air today are ore and metals processing and piston-engine aircraft operating on leaded aviation gasoline Testing Results of Lead in Ambient Air The average concentration of Lead (µg/m 3 ) observed on Site- 1(Dreamworld), Site-2(PIDC Bridge) and Site-3(Baloch Colony Bridge) were ND, 2.2, and 3.6 respectively. Environmental Monitoring & Modeling Division Page 15
 were within the prescribed limits of SEQS (see Table 3 for reference) for ambient air quality.")
23 The average levels of Lead at Site-2(PIDC Bridge) and Site-3 (Baloch Colony Bridge) were higher than the prescribed limits of international and SEQS standards while the average levels of CO at Site-1(Dreamworld) were within the prescribed limits of SEQS (see Table 3 for reference) for ambient air quality. Figure 6: Concentration of Lead (Pb) at three different sites of the Project Environmental Monitoring & Modeling Division Page 16
24 4. CONCLUSION The data shows that there is more pollution at PIDC Bridge and Baloch Colony Bridge as compared to the Dreamworld. At Site-1 (Dreamworld) the results indicated that the average levels of all the pollutants i.e. Oxides of Nitrogen, Sulphur Dioxide, Carbon Monoxide, Ozone, Particulate Matter (PM 2.5, PM 10 and SPM) and Lead were well within the prescribed limits of Sindh Environmental Standards (see Table 3 for reference). At Site-2 (PIDC Bridge) the results indicated that the average levels of Nitrogen Dioxide, Sulphur Dioxide, Ozone, Particulate Matter (PM 2.5, PM 10 and SPM) and Lead were well within the prescribed limits of Sindh Environmental Standards (see Table 3 for reference). On the other hand the average levels of Nitric Oxide, Carbon Monoxide and PM 10 were higher than the prescribed limit. At Site-3 (Baloch Colony Bridge) the results indicated that the average levels of Sulphur Dioxide, Ozone, Particulate Matter (PM 2.5, and SPM) were well within the prescribed limits of international and national environmental standards (see Table 3 for reference). On the other hand the average levels of Nitric Oxide, Nitrogen Dioxide, Carbon Monoxide, Lead and PM 10 were higher than the prescribed limit of Sindh Environmental Standards. Environmental Monitoring & Modeling Division Page 17
25 Annexure-A (Detailed Monitoring Data) Environmental Monitoring & Modeling Division Page 18
26 PROJECT Air Pollution Survey, June & August 2016 CLIENT SITE ID Site 1 Dreamworld COORDINATES Dream World. Karachi N ' 06" E ' 32" S. No Date Time SO 2 (µg/m 3 ) NO (µg/m 3 ) NO 2 (µg/m 3 ) CO (mg/m 3 ) O 3 (µg/m 3 ) Noise (db) PM 2.5 (µg/m 3 ) PM 10 (µg/m 3 ) SPM (µg/m 3 ) Lead (µg/m3) Air Temperature ( C) Humidity (%) Wind Speed (m/s) Wind Direction (Deg) 1 2/6/ /6/ /6/ /6/ /6/ /6/ /6/ /6/ ND 9 2/6/ /6/ /6/ /6/ /6/ /6/ /6/ /6/ Environmental Monitoring & Modeling Division Page 19
27 17 3/6/ /6/ /6/ /6/ /6/ /6/ /6/ /6/ /6/ Maximum Minimum ND Average SEQS Environmental Monitoring & Modeling Division Page 20
28 PROJECT Air Pollution Survey, June & August 2016 CLIENT SITE ID Site 2 PIDC COORDINATES Dream World. Karachi N ' 44.4" E ' 18.1" S. No Date Time SO 2 (µg/m 3 ) NO (µg/m 3 ) NO 2 (µg/m 3 ) CO (mg/m 3 ) O 3 (µg/m 3 ) Noise (db) PM 2.5 (µg/m 3 ) PM 10 (µg/m 3 ) SPM (µg/m 3 ) Lead (µg/m3) Air Temperature ( C) Humidity (%) Wind Speed (m/s) Wind Direction (Deg) 1 4/10/ /10/ /10/ /10/ /10/ /10/ /10/ /10/ /10/ /10/ /10/ /10/ /10/ /10/ /10/ /10/ Environmental Monitoring & Modeling Division Page 21
29 17 5/10/ /10/ /10/ /10/ /10/ /10/ /10/ /10/ /10/ Maximum ; Minimum ; Average ; SEQS Environmental Monitoring & Modeling Division Page 22
30 PROJECT Air Pollution Survey, June & August 2016 CLIENT SITE ID Site 3 Baloch Colony COORDINATES Dream World. Karachi N ' 1.6" E ' 0.7" S. No Date Time SO2 (µg/m3) NO (µg/m3) NO 2 (µg/m3) CO (mg/m3) O 3 (µg/m3) Noise (db) PM 2.5 (mg/m 3 ) PM 10 (µg/m 3 ) SPM (mg/m 3 ) Lead (µg/m 3 ) Air Temperature ( o C) Humidity (%) Windspeed (m/s) Wind direction (degree) 1 8/11/ Calm 2 8/11/ /11/ /11/ /11/ /11/ /11/ /11/ /11/ /11/ /11/ /11/ /11/ /11/ /11/ /11/ Environmental Monitoring & Modeling Division Page 23
31 17 9/11/ Calm 18 9/11/ Calm 19 9/11/ Calm 20 9/11/ /11/ Calm 22 9/11/ /11/ /11/ Calm 25 9/11/ Maximum Minimum Average SEQS Environmental Monitoring & Modeling Division Page 24
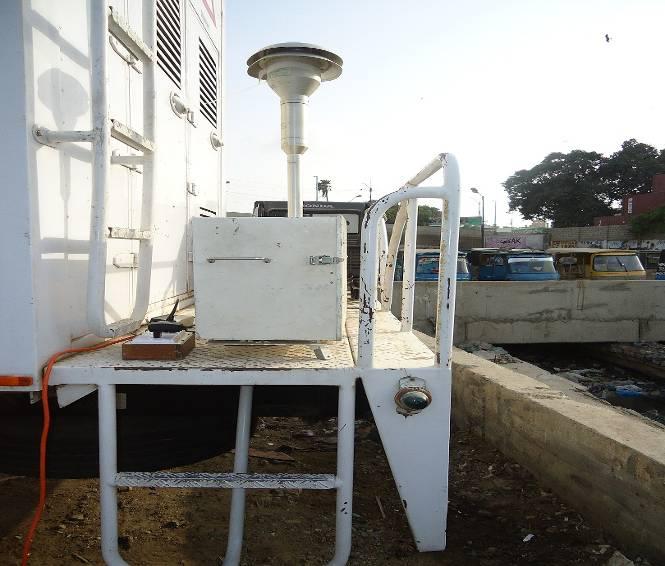
32 Annexure-B (Air Quality Monitoring Photograph) Environmental Monitoring & Modeling Division Page 25


33 Survey Photograph of Dreamworld Environmental Monitoring & Modeling Division Page 26


34 Survey Photograph of PIDC Environmental Monitoring & Modeling Division Page 27


35 Survey Photograph of Baloch Colony Environmental Monitoring & Modeling Division Page 28