Natural Wastewater Treatment Techniques and Resource Recycling
|
|
|
- Philomena Jordan
- 5 years ago
- Views:
Transcription


1 Natural Wastewater Treatment Techniques and Resource Recycling Thammarat Koottatep School of Environment, Resources and Development Asian Institute of Technology 1
2 Presentation outlines Introduction Natural treatment systems Waste stabilization ponds Aquatic systems Constructed wetlands Case study Conclusions 2
3 Natural Treatment Systems 3
4 Natural Treatment Systems Use interactions of microorganisms, aquatic plants, small animals in waste degradation agal-bacterial symbiosis adsorption on soil matrix uptake by plants and microorganisms anaerobic degradation, etc. no fossil-fuel energy, low-costs in construction and O&M but require large land area 4
5 Natural Treatment Systems Include: Waste Stabilization Ponds (WSP) in Thailand, workable municipal treatment plants are WSP (> 50% of total) Aquatic Treatment Systems water hyacinth, duckweed (recycle of nutrients) Land Treatment irrigation, overland flow, rapid infiltration Constructed Wetlands free water surface, subsurface, vertical-flow 5

6 Waste Stabilization Ponds A shallow body of wastewater contained in an earthen basin, so called oxidation ponds consist of aerobic: m depth facultative m depth anaerobic m depth ponds in series 6
7 Waste Stabilization Ponds applicable for various kinds of wastewater domestic - municipal, households, etc. industrial - food processing, industrial estate, etc. promising treatment performances BOD removal > 80% N removal > 60% P removal > 50% Coliform removal > 70% Heavy metals > 50% 7

8 Aquatic Treatment Systems Use aquatic plants: floating types water hyacinth ponds duckweed ponds submerged types pond weed, hydrilla Use Interactions direct uptake biodegradation sedimentation volatilization 8
9 Alternatives for Resource Recycling Direct application Agriculture Farmland Land reclamation Composting Aquaculture Fish production Algae production Indirect application Biogas production Anaerobic processes Indirect reuse Discharge into receiving streams Integrated approaches C to produce biogas & N, P to reclaimed or removed Biogas + ponds Biogas + wetlands C to be biodegraded & N, P to grow vegetables, fish or aquatic plants Ponds + agriculture Ponds + aquaculture Ponds + wetlands 9

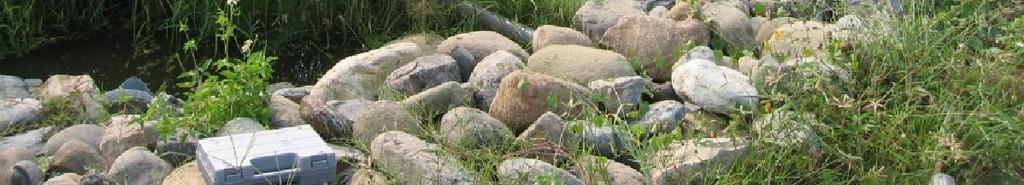
10 Pond Treatment Systems Waste stabilization ponds Are earthen basins contain a relatively shallow of water body Employ algal-bacterial symbiotic interactions Algae to provide oxygen Bacteria to degrade organics Can be classified into Aerobic, facultative, anaerobic Depending on water depth + loading Provide high effluent quality in treating wastewater from Domestic, agriculture and industries Require low investment and operational costs but consume relatively large area Wastewater Ponds in Hanoi 10
11 Constructed Wetlands Creation of marshlands to intensive construction involving earth moving, grading, impermeable barriers or erection of tanks or trenches Designed to overcome the disadvantages of natural wetlands Should perform better than a natural wetland of equal area Since the bottom is usually graded and the hydraulic regime in the system is controlled Employ interactions of soil, bacteria, and aquatic plants for pollutant removals, e.g. Biodegradation Nutrient plant uptake Nitrification/denitrification 11
12 Types of Constructed Wetlands Categorized according to flow patterns: Vegetated Submerged Bed (VSB) or Subsurface Flow System (SF) so called "Root Zone", "Rock- Reed Filters" or Reed Bed Free Water Surface System (FWS) Slotted pipe for wastewater distribution Slotted pipe for wastewater distribution Slope 1% Rhizome network Soil, sand or gravel Emergent plants Effluent outlet Watertight membrane Emergent plants Slope 1% Rhizome network Soil, sand or gravel Effluent output Watertight membrane 12


13 Vertical-flow Constructed Wetlands Configurations Like trickling filter or sand drying bed Installed with feeding systems uniformly distributed on surface wastewater flows vertically downward through wetland media and plant s roots + rhizomes Consisted of a deeper depth of media layers: sand + gravel (preferable) 13

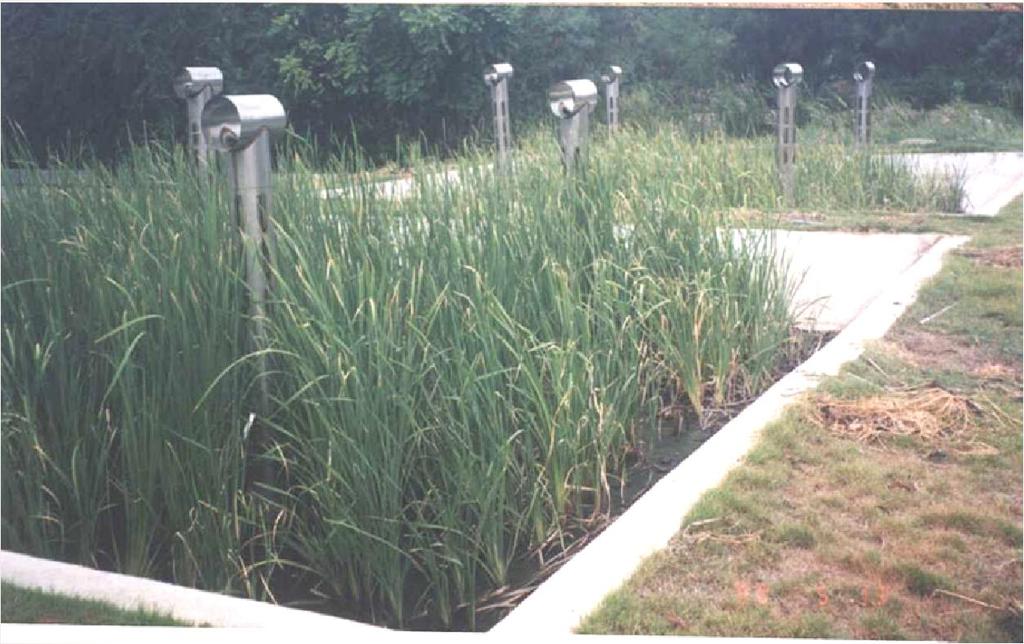

14 AIT Wetlands 14
15 Aquaculture Ponds Wastewater-fed earthen basins growing with algae + fish (or aquatic animals) Due to difficulties in algal harvesting use fish to consume Algae O 2 for fish and bacteria Bacteria CO 2 for algal photosynthesis + degrade organic pollutants Wastewater Types Polyculture pond > 1 species Higher yield Monoculture pond Species Only 1 species + supplementary feeds Herbivorous Silver carp, Grass carp Omnivorous Tilapia, Chinese carp Carnivorous - Snakehead Algae Fish Aerobic Effluent CO 2 O 2 Bacteria Facultative Anaerobic 15

16 Integrated WSP and CW in series 16
17 Integrated WSP and CW Treated effluent reuses in agricultural or aquacultural practices irrigation of crops and parks source of animal protein for human consumption or as fish feed for other animals Health awareness Control microbiological quality meet WHO standards Undertake depuration Conduct public education and awareness Harvested CW plant biomass raw material for thatching and some ornamental species processing reusable forms mulching and composting to produce soil additives; hydrolysis and fermentation to form ethanol; pulping to yield fiber; silaging to produce livestock fodders 17
18 Integrated WSP and CW Wastewater From household and industry Ponds Removal of organics and nutrients Constructed Wetlands Further SS and nutrients removal Uses of plants as fodder or animal feed Site for recreation Attainment of ecological balance Treated water Aquaculture or Agriculture Reuses Fish as food or feed Ecological balance Site for recreation Duck culture Irrigation crops 18
19 Integrated Ponds/Wetlands Design criteria for CW systems Parameters Types FWS VSB Organic loading rates, kg BOD/ha.day N loading rate, kg/ha.day HRT, days Hydraulic loading rate, cm/day Maximum water depth, cm 50 (above CW surface) 10 (below CW surface) Minimum aspect ratio (length/width) 2:1 2:1 Bed depth*, cm
20 Integrated Ponds/Aquaculture Design criteria for wastewater-fed aquaculture ponds Parameters Range Organic loading rates - kg BOD/ha.day - kg COD/ha.day Maximum DO at dawn, mg/l 1 2 NH 3 concentration of pond water, mg/l < 0.02 ph of pond water (optimum ) Fish stocking density, fish/m H 2 S concentration, mg/l Nil Culture period, month 3 12 Fish yield, kg/ha.year 1,000 10,000 Pond width, m < 30 Pond depth, m Area for each pond*, m ,000 20
21 Integrated Ponds/Aquaculture Standards on microbiological quality for aquaculture reuse (WHO, 1989) Reuse process Viable trematode eggs a (average no./l or kg) Fecal coliforms (geometric mean no./ 100 ml or 100 g) b Fish culture 0 < 10 4 Aquatic macrophyte culture 0 < 10 4 a Clonorchis, Fasciolopsis, and Schistosoma. Consideration should be given to this guideline only in endemic area b This guideline assumes that there is one log 10 unit reduction in fecal coliforms occurring in the pond, so that in-pond concentrations are < 1,000 per 100 ml. If consideration of pond temperature and residence time indicates that a higher reduction can be achieved, the guideline may be relaxed accordingly 21
22 Integrated Ponds/Aquaculture Effects of fish stocking density on mean fish weight and total fish yield High stocking density low fish weight (small size of fish) high fish yield Good for production of animal feeds Low stocking density High fish weight (big size of fish) Low fish yield For human consumption 22
 high algal suspension 4 units of free")
23 Case Study at AIT AIT wastewater treatment WSP in series total surface area = 12,100 m 2 treatment capacity = m 3 /day average influent COD = 120 mg/l BOD = 80 mg/l During the first 20 years the treated WSP effluent complying with effluent standards BOD = 20 mg/l and SS = 30 mg/l Later on, gradual increases of effluent SS concentrations (> 30 mg/l) high algal suspension 4 units of free water surface CW each with dimensions of 12 x 60 x 0.50 m (width x length x water depth) planting with cattails Since then effluent SS concentrations < 30 mg/l 23

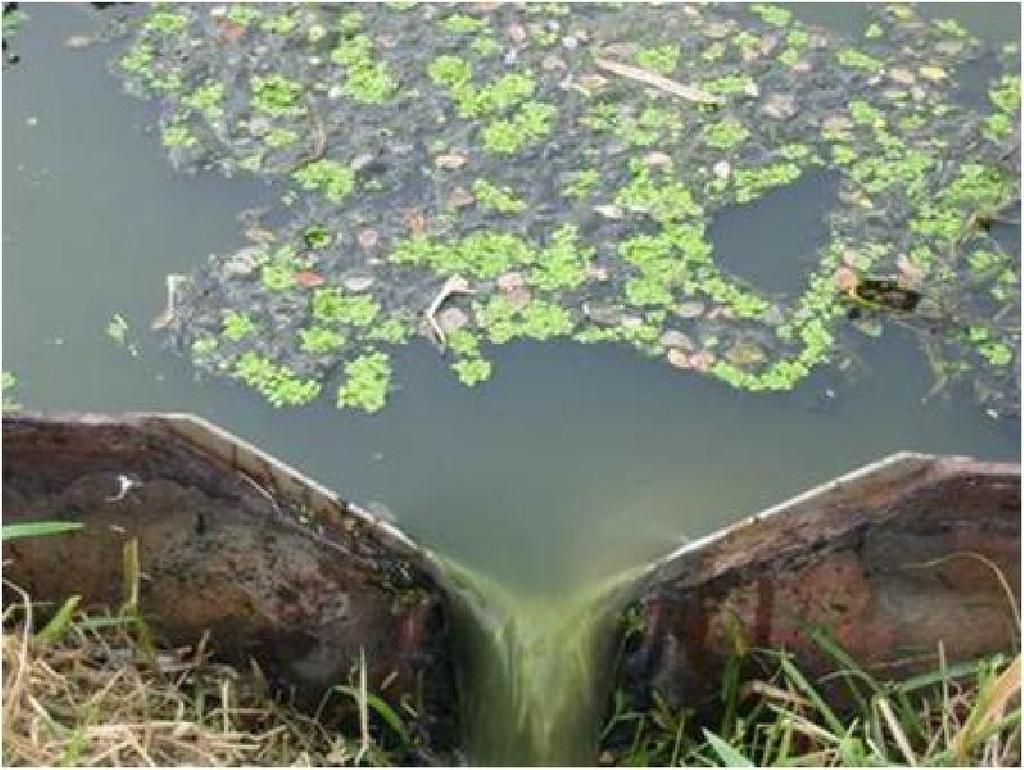


24 Integrated WSP and CW at AIT Influent AP effluent FP effluent CW effluent 24
25 Treatment Performance of WSP and CW at AIT COD tot BOD tot SS Treatment unit Conc. (mg/l) Removal (%) Conc. (mg/l) Removal (%) Conc. (mg/l) Removal (%) Influent Facultative Ponds 70 50% 30 60% 50 44% Constructed Wetlands 35 75% 15 80% 20 78% Based on 30 samples during March July
26 Treatment Performance of WSP and CW at AIT TKN NO 3 TN TP Treatment unit Conc. (mg/l) Removal (%) Conc. (mg/l) Removal (%) Conc. (mg/l) Removal (%) Conc. (mg/l) Removal (%) Influent Facultative Ponds 20 33% % 27 20% % Constructed Wetlands 18 40% % 20 39% % Based on 30 samples during March July
27 Treatment Performance of WSP and CW at AIT Treatment unit Total Coliform MPN/100mL Removal Fecal Coliform MPN/100mL Removal Influent 1.90E E+06 Facultative Ponds 5.40E+05 2 log unit 8.60E+04 2 log unit Constructed Wetlands 9.70E+04 3 log unit 3.50E+03 3 log unit Based on 30 samples during March July
28 Conclusions Integrated WSP and CW promising treatment efficiencies help alleviate some drawbacks of individual systems offer some potential benefits through reuse and recycle of the byproducts Lead to the sustainable wastewater management Development of design criteria and operating procedures long-term experimental results kinetic considerations on unit arrangement Microbial species predominance in treatment units 28

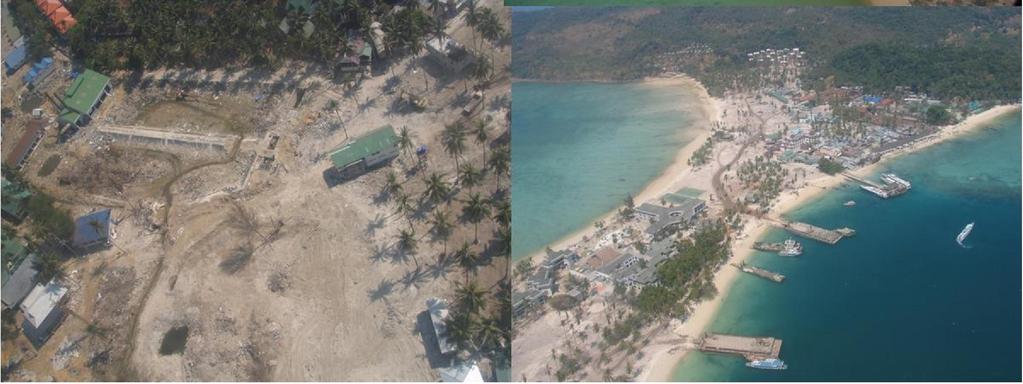


29 Tsunami-hit Phi Phi Island and wastewater treatment plant February


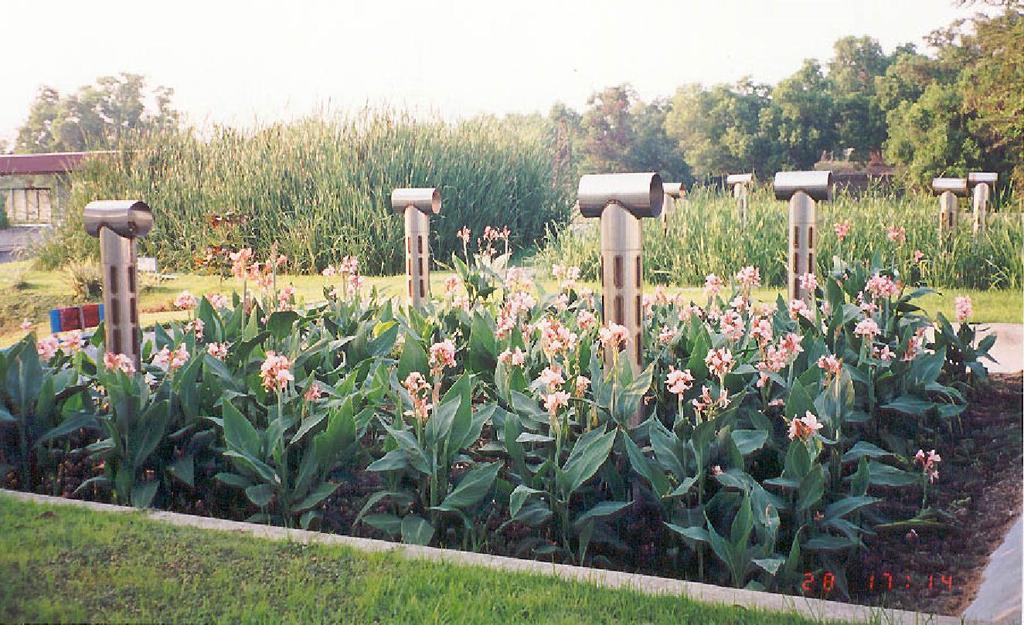
30 Design and landscaping of constructed wetlands at Phi Phi Island The Flower and The Butterfly 30


31 Operation of constructed wetlands for wastewater treatment at Phi Phi Island 31

32 Summary Optimized conditions for CW system Wastewater OLR < 100 kg BOD/ha.day Fecal sludge SLR = 4.8 kgts/m 2.wk Conceptual Engineering Reuse potentials Treated effluent or Biosolid Landscaping or aesthetic value Gain more public acceptance & administrative actions Landscaping & functionality 32


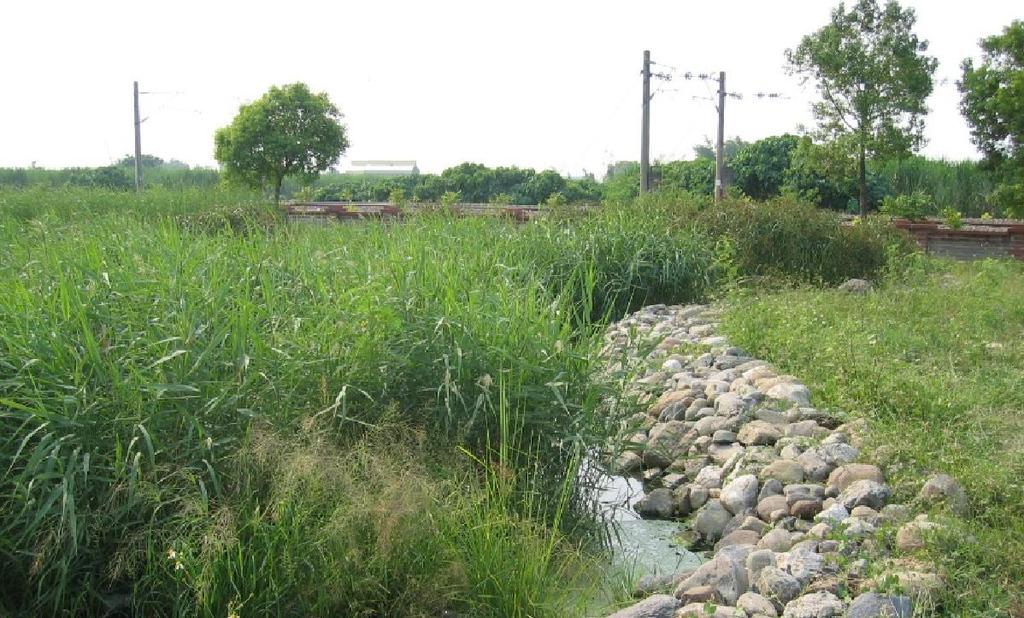
33 Introduction Wastewater Eastern Seaboard Industrial Estate (ESIE), Rayong province 200 km east of Bangkok, Thailand Developed in 1995 Area = 1,000 ha, workers > 14,000, factories = 120 car assembly, auto parts, building materials, metal fabrication, plastics, consumer products and electronics Wastewater treatment pre-treatment at each factory prior to central WWTP Generation rate ~ 7,000 m 3 /day Using 2 aerated lagoons in series with polishing ponds Sale to factory as 2 nd grade water AL-1 AL-2 Polishing pond Holding pond 33
34 Introduction Problems in Wastewater Reuse High nutrients in treated effluent from AL systems Algal blooms occur during dry seasons in 1999 and 2000 Rare tilapia and other herbivorous fish to consume algae Ineffective removal of algae due to difficulties in fish harvesting Converting polishing pond into hyacinth pond not very effective due to less incentive to harvest hyacinth Research objectives (1) determining treatment performances and potentials in nutrient reductions of verticalflow CW system; and (2) preliminarily appraise economic benefits of emergent plant species cultivated in CW units Not economic to produce + sale 2 nd grade water 34

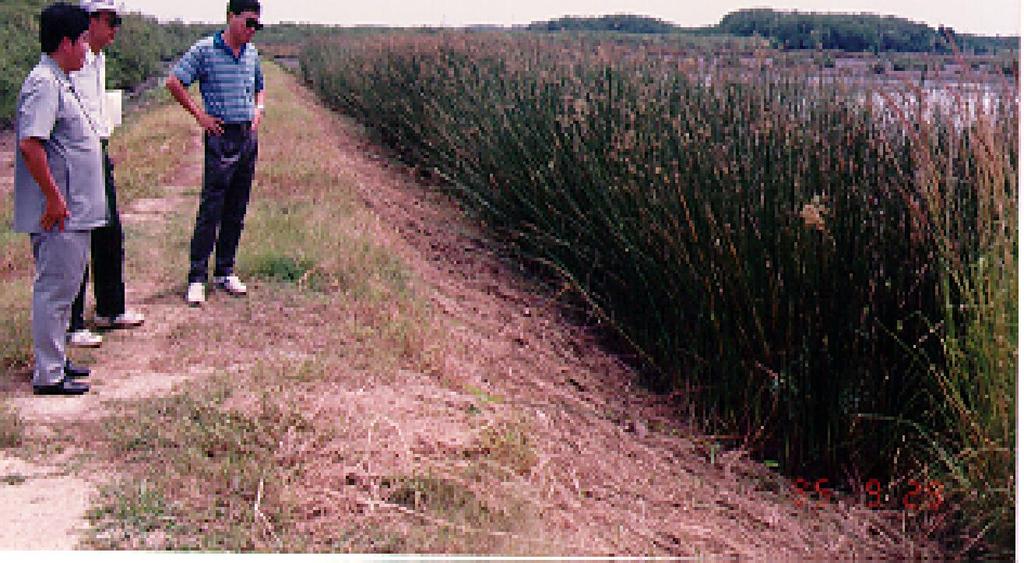
35 Examples of constructed wetlands Denmark Thailand Taiwan 35


36 AIT Wetlands Pilot-scale units for WW treatment Laboratory-scale unit A unit for one household Pilot-scale units for septage treatment 36


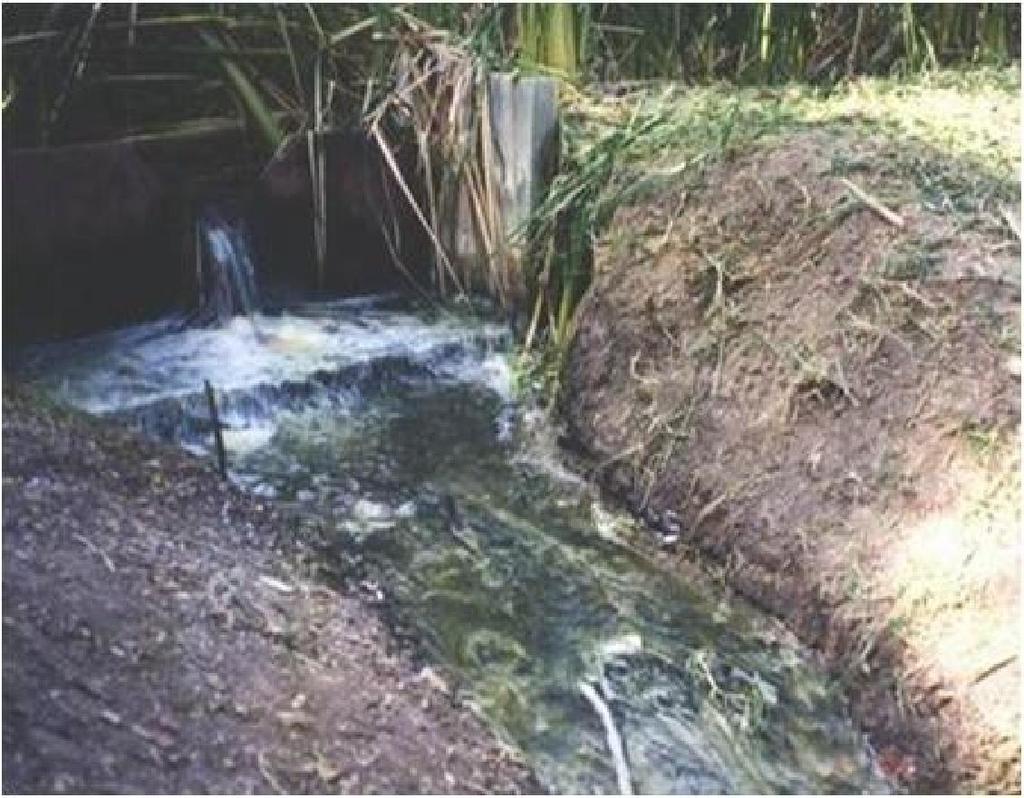
37 Why to be Vertical-flow Constructed Wetlands Low-cost: investment + O&M Promising treatment performance Potential uses of the harvested plants Roots and rhizomes reduce bed clogging provide O 2 Wastewater HDPE Lining Ventilation Pipe Drainage Pipe Emergent Plants Intermediate Basin Percolate Biodiversity conservation 37


38 System designs Raw Wastewater Treated Effluent CW-1 CW-2 Unit dimensions for each unit Area = 630 m2 Width = 18 m Length = 35 m Depth = 0.80 m Media arrangements Top soil = 10 cm Sand layer = 15 cm Gravel layer = 55 cm 38

 10 cm 15 cm Bird of Paradise Golden Gingers Gravel")
39 Descriptions of CW unit Emergent plants Cattails Wastewater Emergent Plants Canna Bulrushes Padanus Palms Top soil Sand (F = 0.1 cm) 10 cm 15 cm Bird of Paradise Golden Gingers Gravel (F = cm) 55 cm Golden Torches Percolate 39

")
 HRT** (day) CW1 CW2 CW1 CW2 CW1 CW2 1 September 2001 January 2002 150 100")
40 Operating conditions Feeding with raw wastewater from industrial estate BOD = mg/l SS = mg/l TKN = mg/l P = 2 24 mg/l Each factory has to treat its wastewater according to effluent standards of the industrial estate Less toxic elements: metals or organic Run Period HLR* (L/m 2 /day) OLR* (g BOD/m 2.day) HRT** (day) CW1 CW2 CW1 CW2 CW1 CW2 1 September 2001 January February 2002 February
41 Constructed wetland unit 1 41
42 Constructed wetland unit 2 42
43 Treatment performance Average concentration Parameters Unit Standard * Effluent Influent CW unit 1 CW unit 2 BOD mg/l COD mg/l SS mg/l TKN mg/l NH 3 -N mg/l N.A NO 3 -N mg/l N.A TP mg/l N.A Overall removal (%) ** 87 Averaging from 68 samples for each parameter * Industrial effluent standard (1992) ** Increase due to nitrification reaction 43
 Cattails 2.")
44 Plant cultivation and harvesting Preliminary economic appraisal Unit Species Height, m Wet weight Yield before after kg kg/m 2 Unit cost for construction costs 1 Bulrushes CW = 108 US$/m 3 /day Pendulus palm Golden torch Conventional systems = US$/m 3 /day Bird of paradise (except land costs) Cattails Canna Annual unit O & M cost Cattails CW = 12 US$/yr Golden ginger Conventional systems = US$/yr Bird of paradise * Data based on only one harvesting in early June 2002, after 4 months of operation Full-scale CW systems Payback period = 1 2 years 44

45 Conclusions At relatively high OLR or short HRT of CW in series high removal efficiencies Only one CW unit meet industrial effluent standard Minimal operation and power requirement Treated effluent reused as a second-grade water Potentials to sell the harvested emergent plants Flowers & materials for local handicrafts Some operational problems Clogging at the feeding pipes Because no sedimentation unit Temporally flooding on CW surface By end of the year 2003, the full-scale CW units (2 units in-series) at ESIE will completed: Area = 16,000 m 2 Flow = 2,000 m 3 /day Effluent recirculation to further remove NO 3 45