Water, Food and Energy security in Shared River Systems
|
|
|
- Allyson Webster
- 5 years ago
- Views:
Transcription

1 Water, Food and Energy security in Shared River Systems Case study Eastern Nile Basin Lars Ribbe 8 th Conference on Sustainable Development of Energy, Water and Environment Systems Sept 24, 2013 Dubrovnik

2 Lars Ribbe Research and Education in the area of Integrated Land and Water Resources Management 2
3 Outline 1. Sustainable Development and the NEXUS 2. Challenges in the Eastern Nile Basin 3. Outlook and Potential Solutions 3


4 4

5 5
6 Challenge: Understanding the Nexus Water, Energy and Food Security: Three pillars of sustainable development + social and political stability Today 2012: 7 bn No access to safe water: 0.9 bn, electricity: 1.5 bn, sufficient food: 1 bn Tomorrow 2030: 8.5 bn? Compensate for current deficit + account for additional demand: Supply of around 40 % water, energy, food additionally!
7 W F W? F E E Resources Base Overlap: impact (tradeoffs, synergies) Increasing security in one sector may reduce security in another!
 operation Food Hydropower development Water demands")

8 Water Water demand of food production Reservoir construction and (irrigation) operation Food Hydropower development Water demands of energy production Energy demands of water distribution and treatment Energy demand of food production and processing Biofuels Energy 8
9 W F E 2030 Required: Intersectoral Approaches Interdisciplinarity International Cooperation more research
10 Which system level/scale is appropriate? 10
11 River basin level Boundary for a local water system within which water can only be used once for food production or other consumptive uses hydropower production impacts downstream users natural boundary often basis for political boundaries, traffic grids, energy grids 11

12 The basin as system boundary to analyze the NEXUS Energy generation Land Use ET Q P Treatment Channels Reservoir Source Storage Field Irrigation Distribution Energy demand Drainage Collection Discharge Treatment Ecosystem 12

 Reservoir Source Reservoir Storage +")
13 Multiple users adding complexity (in particular if political boundary crosses basin!) Reservoir Source Reservoir Storage + Irrigation Reservoir Boundary Ecosystem
14 Scope and relevance of shared Basins Worldwide: 263 transboundary watersheds They represent 40 % of world population, 50 % of land area and 60 % of runoff Source: World Atlas of International freshwater agreements (Aaron Wolf, Oregon State University)

15
16 Why the Nile Basin? Large: 3 Mio km² Contested (scarce) resources Transboundary (11 riparians) Interesting: lower riparian strongest country (vs Mekong, Euphrates )
17 17
18 18
19 New Treaty : Cooperative Framework Agreement (CFA) 2010: Disputed Nile agreement signed. Four African countries have signed a new treaty on the equitable sharing of the Nile waters despite strong opposition from Egypt and Sudan who have the major share of the river waters (Al Jazeera, May 15, 2010) Egypt s share of the Nile s water is a historic right that Egypt has defended throughout its history "Egypt reserves the right to take whatever course it sees suitable to safeguard its share" (Mohammed Allam, Minister of Water Resources and Irrigation, Egypt April 18, 2010) 19
20 Egypt's dependency on the Nile water Nile assures water, wnergy and food Security: National food production through irrigation Significant hydropower production (Aswan): 14 out of 121 billion KWh Supply of whole population and industry with water 20
21 Does only Egypt depend on the Nile? 21


22 Egypt 10% 1% Production of Electricity from different energy sources in 2011 Sudan 6% 47% 47% 89% Ethiopia 1% biofuels and waste, GWh fossil fuels, GWh hydro electricity, GWh electricity, GWh geothermal electricity, GWh 99% solar, wind, tide, wave and other sources, GWh African Regional Energy Statistics, 2013
23 Past Agreements (current status) 1959: Treaty between Egypt and Sudan after Sudan s independence (1956) and Aswan Dam planning (1952): 55.5 BCM/year for Egypt, 18 BCM/year for Sudan, 10 BCM/year for seepage and evaporation. 23


24 The Enduring Tension Control Utilisation Monopoly Contribution JUST Egypt and Sudan!! What about us!!!? Upstream 24
, Past of poverty and conflicts, recent strong economic development Two main sub-basins : White Nile, Equatorial Lake (15%) and, Eastern Nile, Egypt,")
25 Nile Basin: A closer look Basic Facts: 11 riparian countries, 160 (370) million people, 3.1 million km² (10 % of Africa), Past of poverty and conflicts, recent strong economic development Two main sub-basins : White Nile, Equatorial Lake (15%) and, Eastern Nile, Egypt, Sudan, Ethiopia > 80 % of area, 70 % of population, 60 % of cropland 80 % of GDP (Map: ITT 2013) 25
, slope gently")
")
26 Nile Basin Topographic Zones: 1. Lake Plateau : Peaks 4,300 (m), slope gently 2. Ethiopian Plateau: Peaks 3,500 (m) 3. North Sudan and Egypt: Plain area < 400 (m) 85 % Map: ITT
27 Eastern Nile Basin Issues on the ENB: Ethiopia Generates 85 % water reaching Egypt s Aswan Dam Ethiopia only holds a limited right of exploration of the water resource most populated riparian state New hydropower dams (Map: ITT 2013) 27
28 Eastern Nile Basin Issues on the ENB: Sudan 97 % of it's water resource used Agriculture sector 60% of Land Mass in Basin Sudd Swamp Evap loss of >50% of all Water in White Nile South Sudan (Map: ITT 2013) 28
29 Eastern Nile Basin Issues on the ENB: Egypt 96 % of population live in Nile Delta/Basin Entirely dependent on Nile waters (Only 4% from underground reserves) Water stressed Country (700 m³/cap/y) (Map: ITT 2013) 29
30 What will the future bring? 30

31 Water Demand Increasing water need for domestic use. Growing number of water stressed countries in the basin. m Ethiopia Stress Level Egypt Scarcity Level Water resources availability per capita (m³) (FAO 2011) 31
32 Population / UNDESA 2030 population prospects x Egypt Sudan Ethiopia Years
33 Egypt 300 GDP, current US$ (billion) GDP, current US$ World Bank, World Development Indicators, 2013
34 Sudan 80 GDP, current US$ (billion) GDP, current US$ World Bank, World Development Indicators, 2013
35 Ethiopia 45 GDP, current US$ (billion) GDP, current US$ World Bank, World Development Indicators, 2013
36 Egypt 3000 Total population with Unimproved Water (x1000) World Bank, World Development Indicators, 2013
37 Sudan Total population with Unimproved Water (x1000) World Bank, World Development Indicators, 2013
38 Ethiopia Total population with Unimproved Water (x1000) World Bank, World Development Indicators, 2013


39 Eastern Nile Countries Economic Development
40 Power Demand (World Bank, 2004) 40

41

42 Dams and Utilization Purposes Country Dam River Year of Const. Storage Capacity (BMC) Commis. Current Purpose Egypt Old Aswan Dam Aswan High Dam Main Nile Main Nile Irrigation, power Multipurpose Sennar Dam Blue Nile Irrigation, power Jebel Awlia Dam White Nile Irrigation, power Sudan Khashm Elgirba Dam Atbara (60%) Irrigation, power Roseires Dam Blue Nile (75%) Irrigation, power Merowe Dam Main Nile Power Ethiopia Tekeze Upper Atbara Power Uganda Owen Falls Lake Victoria Power (Map: ITT 2013) 42
 63 Areal average rainfall of the catchment (mm/year) (3) 1,230 Rainfall @dam site (mm/year) (4) 850 Net evaporation loss from Reservoir (mm/year) (After deducting")
43 Basic figures of Grand Renaissance (Millennium) Dam Total catchment area at dam axis (km 2 ) (1) 172,250 Reservoir surface area at full supply level (km 2 ) (2) 1,680 Storage capacity of the reservoir, Billion cubic Meter (2) 63 Areal average rainfall of the catchment (mm/year) (3) 1,230 site (mm/year) (4) 850 Net evaporation loss from Reservoir (mm/year) (After deducting rainfall on the reservoir) (5) 1080 Total Evaporation Losses (full supply); (km³) 1.84 Mean inflow to the reservoir from (m 3 /sec) (1) 1,547 Max. Hydropower capacity (MW) / net generation (GWh) (6) 6,000 / 15,000 Starting date (2) April 2011 Completion date (2) July 2017 Sources: (1) Personal communication with personnel working on the dam project (2) (3) Value adopted from calculated areal rainfall of upper Blue Nile (4) Adopted from near by meteorological station (Ethiopian Meteorological Agency) (5) (6)
44 Impacts vs benefits? Reduce water availability during filling Evaporation losses: 1.8 km³ Relocation of people Increased life span of downstream dams (sediment trap) Flow regulation upstream instead of Aswan lake 44


45 Nile Basin Land Use: (ESRI Global map 2008) 45

46 Land use dynamics 46


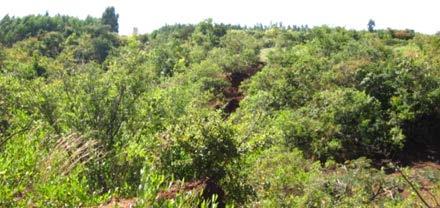

47 Eucalyptus Open Grazing Woody shrub Crop land


48 Tana Sub-basin Beles Sub-Basin Woldesenbet,
49 Beles sub basin land cover changes 70 Area (%) Years Cultivation Grassland Forest Woodland Savanah Water Woldesenbet,


50
51 Hydro-meteorological Variability! Long term climate change??? Q (Mm 3 /year) Annual river flow at Border River flow (Mm3/year) Data source: Ethiopian Ministry of Water Resources
52 52
")
53 Hydropower Potential 69% 75% 22% 33% 7% 49% Ethiopias potential: 45 GW Percentage of technical and economic hydropower potential exploited World Atlas of Hydropower & Dams, 2003 (World Bank, 2004) 53
54 Potential Energy Develop Renewable Resources! hydropower considering the impacts - developing sustainable hydropower Solar Energy, Wind energy?! realizing that energy efficiency is most potential energy source of the future 54
55 Food Crop production: far below optimum efficiency (more crop per drop!) Import staple food from those countries which produce it efficiently (import of virtual water), produce high value crops for export 55
56 Low crop productivity in Gezira Scheme is possibly due to mismanagement of irrigation water at the field level. WUE (kg/m 3 ) Water use efficiency for main crops in Gezira Scheme, Sudan ( ) Source: Sabry et.al.,
 Wheat yield from 1961 to 2011 Source: FAOSTAT")
57 Water use efficiency in nine irrigated wheat systems After: Zwart and Bastiaanssen (2007) Wheat yield from 1961 to 2011 Source: FAOSTAT 2013
 Source: FAO 2011")
58 Irrigation Scenarios Projection of harvested areas of the Nile basin (Ha) Source: FAO

59 Proposed Dams in the Nile Basin FAO-Nile Basin Project ( ) Dam Name Country Reservoir Capacity (km3) Power Generation (MW) Expected Opening date Baro multi-purpose dam Ethiopia NA 896 NA Grand Renaissance Dam Ethiopia Karadobi Ethiopia NA Mabil Ethiopia Mendaia Ethiopia Fifth Cataract Shereyk Dam Sudan NA 350 NA Second Cataract- Dal Dam Sudan NA NA Third Cataract Kajbar Dam Sudan NA
60 Potential: rainwater How much water falls on the basin? ca 1800 * 10 9 m³ How much water flows into Egypt? ca 55 * 10 9 m³ rainwater harvesting! Storing more rainwater - under ground, -in smaller reservoirs, - in soil?!! 60
61 smart storage 61
62 Benefit Sharing General Concept: Share the benefits resulting from the development of the water resources in order to satisfy the needs of the concerned populations. Transboundary Benefit Sharing: A common management of water resources generates net benefits compared to the unilateral development of the water resources. The concept is about the cooperation of riparian states for the use, protection, or joint development of shared water bodies (transboundary rivers, lakes and aquifers), whereby the riparian states focus on the benefits from water cooperation and the winwin options instead of a potentially conflicting water sharing Non-cooperation = economic losses 62

63 Future high voltage transmission lines?! 63


64 Opportunities Hydropower Protected Areas and Parks Irrigation 64
65 Current Cooperation in the Nile Basin 1990 TECCONILE, CIDA Nile-COM Nile-TAC Nile-SEC Established in 1999 to promote cooperation between all the Nile riparians (transitional) Goal: Achieve sustainable socioeconomic development through the equitable utilisation of, and benefit from, the common Nile Basin water resources Modus operandi: create enabling environment for the implementation of cooperative projects Strong support by international donors NB Commission? NBI is a transitional arrangement until a permanent framework will be in place 65

66 Towards Cooperation Downstream Equitable utilisation Benefits- Sharing Development Upstream 66

67 Please visit us! in Cologne or at: water-energy-food-nexus.info/ 67

68 Basin Case Studies developed together with partners of ITT Learning from real life problems Natural Labs Wupper, DE Information Systems for multi-purpose river basin management San Luis Potosi, MX Closed Basin, Altiplano, floods and droughts, groundwater overuse Gezira, SD Optimisation of large scale irrigation Azraq, JO Closed Basin, groundwater RAMSAR wetland destruction Gondar, ET Rain-fed agriculture in Ethiopian highland Baghmati, NP Integrated river basin development Vu Gia Thu Bon, VN Coordinated Reservoir Management, Floods and Droughts Limarí, CL Drought, basin vs field water use efficiency Macacu, BR Water Quality protection for urban drinking water supply Semarang, ID Coastal Zone and Urban Watershed Management Data Information Knowledge Action
69 Thank you for your attention! Contact Information: Lars Ribbe: Professor for Integrated Land and Water Resources Management, Director of ITT, Cologne University of Applied Sciences 69
70 Additional Information 70
71 Research Overview of the Nile Basin Research group at ITT Downscaling of GCMs Remote Sensing Hydrological model Mike Basin SWAT, etc Scenarios on (future) water availability Water demand Agroclimatology / Agriculture (AquaCrop) Hydropower Households Industry Basin water use / Base-line allocations Costs and benefits of development projects User value of water Intangible values of water Economic evaluation of water uses Alternative water allocation scenarios Optimization models for transboundary water allocation Water rights issues and political interests National water policies vs regional integration NBI - Institutional set-up for Cooperative development and benefit-sharing Incentives for cooperation Partial vs. global coalitions
72 References 1. UNEP World Health Organization 3. U.S. Census Bureau, 2009) from WaterWatch, 2009: 6. UNEP World Bank, searchmenupk= &thesitepk=523679&entityid= _ &searchmenupk= &thesi tepk= Mark Zeitoun, J.A. (Tony) Allan, Yasir Mohieldeen (2010): Virtual water flows of the Nile Basin, : A first approximation and implications for water security Original Research Article Global Environmental Change, Volume 20, Issue 2, May 2010, Pages


73 Water Resources (World Resources Institute, 2003) (FAO 2011) 73
74 Existing Dams in the Eastern Nile Basin FAO-Nile Basin Project ( ) Dam name Country Crest Height (m) Reservoir Capacity (km3) Purpose Power Generation (MW) Operation al Since Esna barrage Egypt 16 NA Irrigation/Flood control/hydropower High Aswan Dam Egypt Irrigation/Flood control/hydropower Old Aswan Dam Egypt 53 5 Irrigation/Hydropower Tana Beles Ethiopia Run of river - Hydropower Tekezze Ethiopia Hydropower Tis Abay I+II Ethiopia Run of river 3.5 Hydropower /2001 Jabel Aulia Sudan Irrigation/Hydropower Khashm El Gibra Sudan Irrigation/Hydropower Merowe Sudan Irrigation/Hydropower Roseires Sudan 60 3 Irrigation/Hydropower Sennar Sudan Irrigation/Hydropower 1925


75 Irrigation and Food Security Crop water consumption (WaterWatch, 2009) 75