Calibration of a Groundwater Flow Model. ME. Phatcharasak Arlai and Prof. Dr. Manfred Koch
|
|
|
- Ethan McCormick
- 5 years ago
- Views:
Transcription
1 Numerical Modeling of possible Saltwater Intrusion Mechanisms in the Multiple-Layer Coastal Aquifer System of the Gulf of Thailand Progress of the Research Work in 2004 Calibration of a Groundwater Flow Model ME. Phatcharasak Arlai and Prof. Dr. Manfred Koch
2 Contents of Presentation Introduction Field visit in Thailand, 2004 Setup the 3D groundwater model of the Bangkok multiple aquifer system Transfer of input parameters of GMS model to PMWIN 10-layers groundwater model Management of the observational input data Check of the input parameters of JICA Generation of input parameters based on the new available aquifer profiles Extraction of the parameters values from the aquifer profiles Generation of the input parameters using the Kriging method
3 Contents of Presentation (cont.) Calibrations of relevant aquifer characteristics Trial and error approach Pest inverse modeling approach Head distribution Next milestones of the work
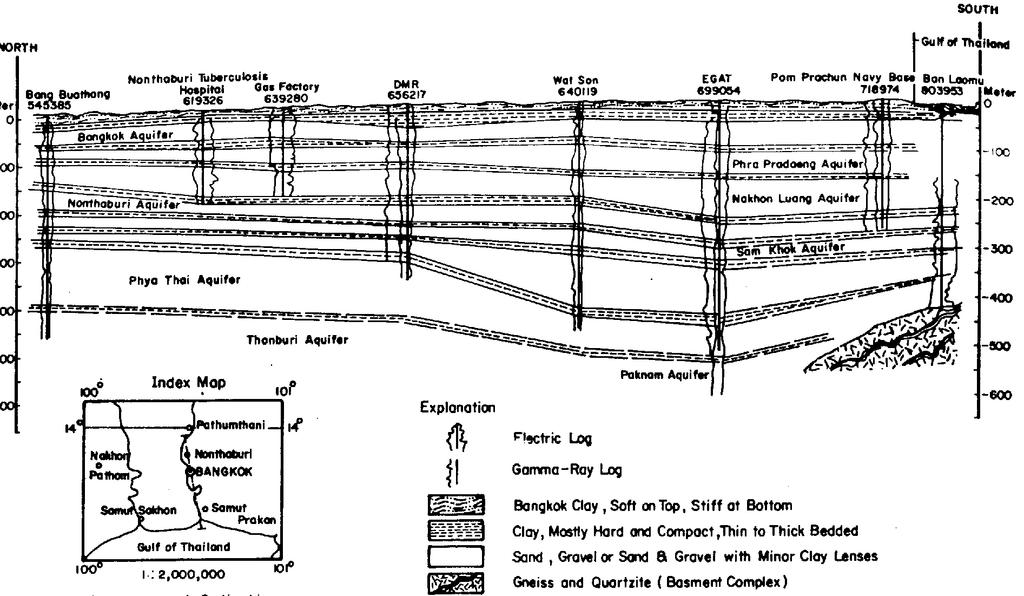
4 Introduction The Bangkok aquifers system underneath Bangkok and adjoining provinces is composed of 8 water bearing units (Figure 1). 1 The groundwater exploitation from the aquifers has increased tremendously and so numerous wells have been drilled into the multiple aquifers system since 1954, many without government control until 1983 (Table 1). 1 As a consequences, saline water has been drawn from its sources towards the producing areas. The fresh groundwater is contaminated by salty water due to an over-extraction extraction of the groundwater higher than the natural yield of the aquifers ( A.D. Gupta and P.N.D.D Yapa,, 1981; Somkid,, 1985; A.D. Gupta, 1986; G. Subhrendu,, 1993; JICA, 1995; Winai,, 1999; Somkid,, 1999) The Thai government and researchers carried out several studies in order to mitigate the salt water intrusion into the aquifers but, so far, the mechanisms and original sources of saltwater intrusion are not yet fully understood. Moreover, they have not yet considered the effects of density-dependent dependent flow in the study area.

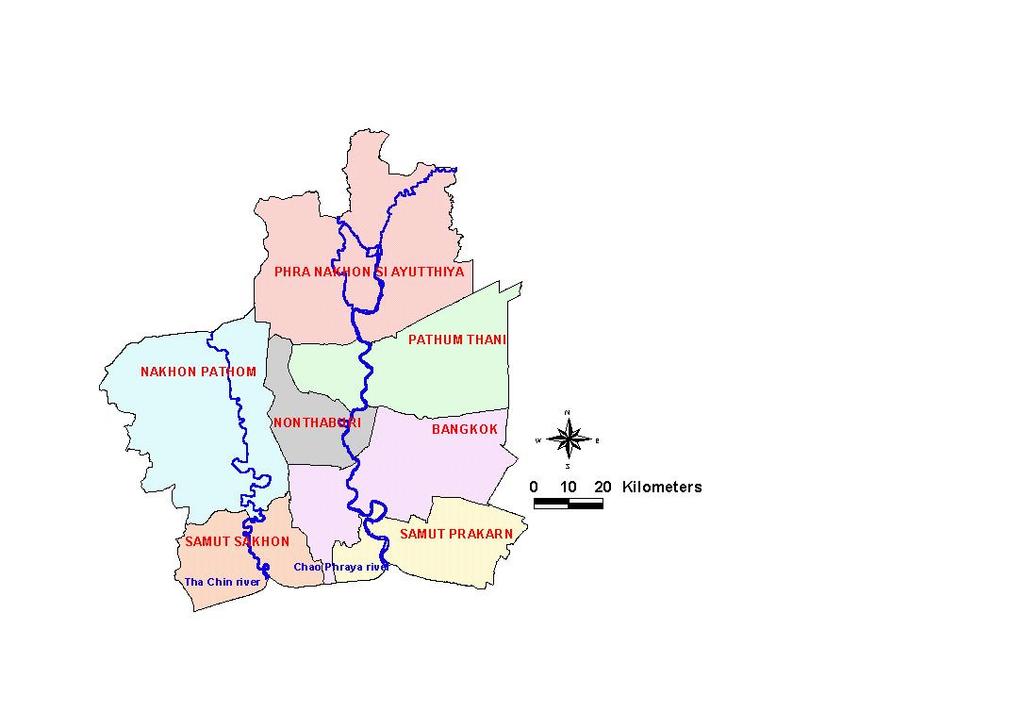
5 Location map of Bangkok Metropolitan Area Figure 1
6 Table 1: History of Groundwater Pumpage Year Groundwater References Pumpage (10^6 CMD) Somkid Somkid JICA Winai

7 Field visit in Thailand 2004 Field trip in Bangkok to saw Monitoring Stations, Geography, and the area of shoreline Discussion on the groundwater problems with the director of Division of Ground Water Reservation Discussion on the scope of work and expected results from the dissertation model the regional flow and solute transport for the present and future situations with the artificial recharge investigate deeply the mechanism of seawater intrusion investigate deeply the mechanism of saltwater leankagce in the suspected areas implement the mitigation plans for the multiple aquifers system Gathered data input parameter data from JICA study Water Level from 1978 to 1997 Groundwater Quality from 1978 to 1997 Pump data The report of the field trip in 2004


8 Setup of the 3D groundwater model of the Bangkok Multiple Aquifer system Transfer of input parameters from the GMS model to PMWIN

9 The 10-layers groundwater model
10 The level of Management MNS water of the observational input data UTM-X level = Coordinate-6e 5 Estimation of the ground level of the monitoring stations UTM-Y = Coordinate-1.4e 6 Transfer of the original coordinate system of the monitoring stations tions to the UTM coordinate system Estimation of the observed annual piezometric heads Screening of the stations that have erroneous water levels by comparison c with the water level trend of neighboring stations Preparation of PMWIN- input files Check of the input parameters of JICA Check of the input parameters of JICA by comparison with the aquifer profiles that were created by the Kasetsart University team in 2003 Comparison of JICA data with the dissertation of AIT 1997.
11 Comparison of parameter distributions from JICA and PMWIN calculations using the new profiles UTM - Y UTM - Y UTM - X Transmissivity distribution in PD aquifer from JICA UTM - X (km) Transmissivity distribution in PD aquifer
12 Comparison of parameter distributions from JICA and PMWIN calculations using the new profiles UTM - Y UTM - X Transmissivity distribution in NL aquifer from JICA Transmissivity distribution in NL aquifer
13 Comparison of parameter distributions from JICA and PMWIN calculations using the new profiles UTM - Y UTM - Y UTM - X Transmissivity distribution in NB aquifer from JICA UTM - X Transmissivity distribution in NB aquifer
14 Generation of input parameters based on the aquifer profiles Extraction of the parameter values from the aquifer profiles
15 Generation of input parameters by using the Kriging method Transmissivity (m3/day) Soil type K xy (m/day) S (m - 1 ) Clay 5E -5 2E -4 UTM - Y Sand 63 2E Gravel 78 5E UTM - X Gangopadhyay, 1997
16 Generation of input parameters using the Kriging Method (Cont.) Transmissivity T = k*b where k = hydraulic conductivity in the concerned direction b = aquifer thickness k xy = (k xy 1*b k xyn *b n )/(b 1 +.+b n ) k z = (b 1 +.+b n )/(b 1 /k z1 +.+b n /k zn ) Z y Vertical Leakance V A = 2/(b 1 /k z1 +b 2 /k z2 ) V B = 2/(b 1 /k z1 + 2*b m /k zm + b 2 /k z2 ) Coefficient of Storage S = s*b s = specific yield A B x
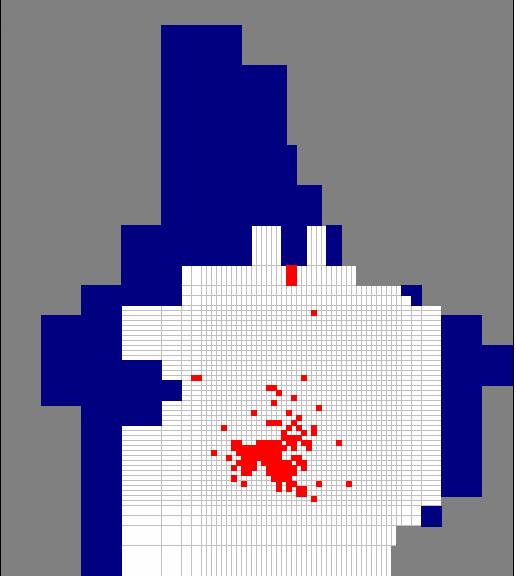
17 Calibrations Trial and error more than 70 times Inverse modeling by PEST UTM - Y Transmissivity (m3/day) UTM - X
18 Trial and Error Multiplied Factor and Measures of Calibration of T Measures of Calibration (m) Multiplied Factor to T ME AME RMSE
19 Trial and Error (Cont.) Multiplied Factor and Measure of Calibration of Vk Measure of Calibration(m) Multiplied Factor of Vk ME AME RMSE
20 Trial and Error (Cont.) Multiplied Factor & Measure of Calibration of S Measure of Calibration(m) Muliplied Factor to S ME AME RMSE
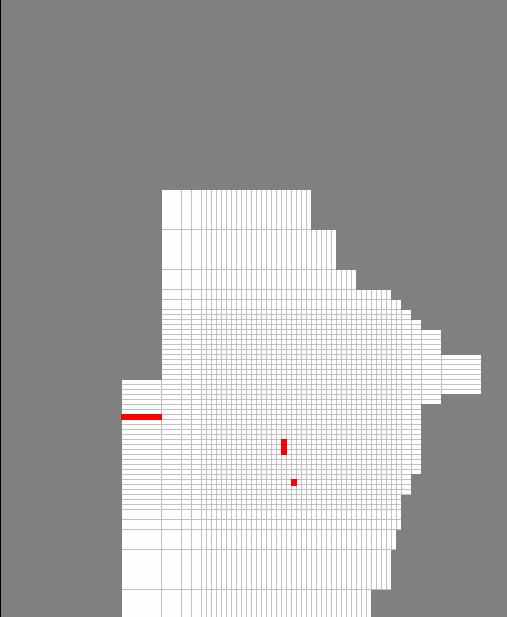
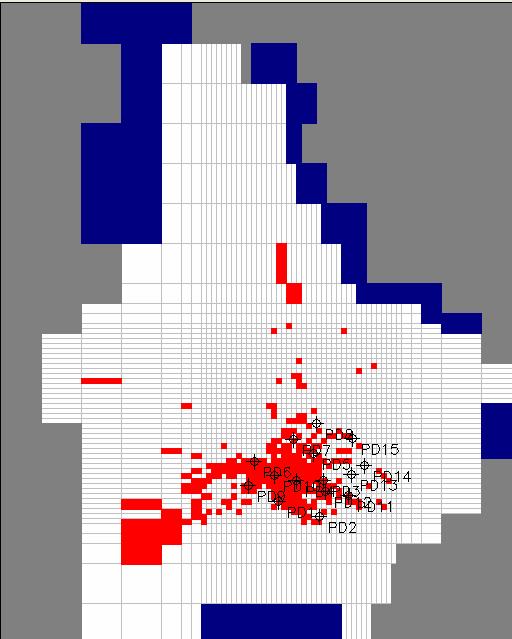
21 T4,T5,T6,Vk3,Vk4, Vk5,Vk6,S4,S5 and 25 S Inverse Modelling Subzonal area for calibration in PD and NL,4 th and 5 th respectively
22 Inverse Modelling by pest Cell position Standard Error Phi

 and JICA")
23 The result comparison between my current study result (a) and JICA (b) (a) (b)
24 Distribution head in the 5th Nakhon Luang in 1983 to 1987
25 Distribution head in the 5th Nakhon Luang in 1988 to 1992

26 Distribution head in the 6 th Nonthaburi in 1983 to 1988
27 Distribution head in the 6 th Nonthaburi in1989 to 1992
28 The next milestones of work and outline of work plan 1 st Phase ( present upto September 2005) Sensitivity Analysis Calibration of the input parameter for the solute transport model Modeling the present situation Modeling possible future scenarios under several mitigation plans 2 nd Phase (September 2005 upto March 2006) Investigation of the seawater intrusion mechanism in Pang Poo industrial utility Investigation of the mechanism of vertical saltwater leakage in the inland area. 3 rd Phase (March 2006 upto August 2006) Implementation of seawater intrusion mitigation plans for the study s area Write the dissertation
29