Evaluating Production Performance from Horizontal Well Refracs in Saskatchewan. Michael Nelson May 4, 2017
|
|
|
- Giles Bryant
- 5 years ago
- Views:
Transcription
1 Evaluating Production Performance from Horizontal Well Refracs in Saskatchewan Michael Nelson May 4, 2017
2 Presentation Overview Study Objectives Intro to Refracs Study Area Data Mining and Filtering Analysis and Results Concluding Remarks
3 Study Objectives How frequently are refracs performed in Saskatchewan? Are the refracs performed in Saskatchewan successful? Are there areas or formations where refracs are more/less successful? Is there potential to utilize refracs as a method of improving recovery of the province s resources?
4 Intro to Refracs Frac completions on wells that have already been previously fractured and produced Can be done on a new interval within the well, the same interval as the initial frac completion, or a combination of both Usually attempted after the well has reached its economic limit rate from the initial completion
5 Intro to Refracs Refracs growing with suggestions that up to 11% of all horizontal wells will be refractured according to IHS Capital costs required for a refrac about 20-35% of new well costs Can produce rates equal to or even above initial well rates
6 Study Area

7 Data Mining and Filtering property of GeoLogic Systems

8 Data Mining and Filtering Production data obtained from Geoscout property of Geologic Systems
9
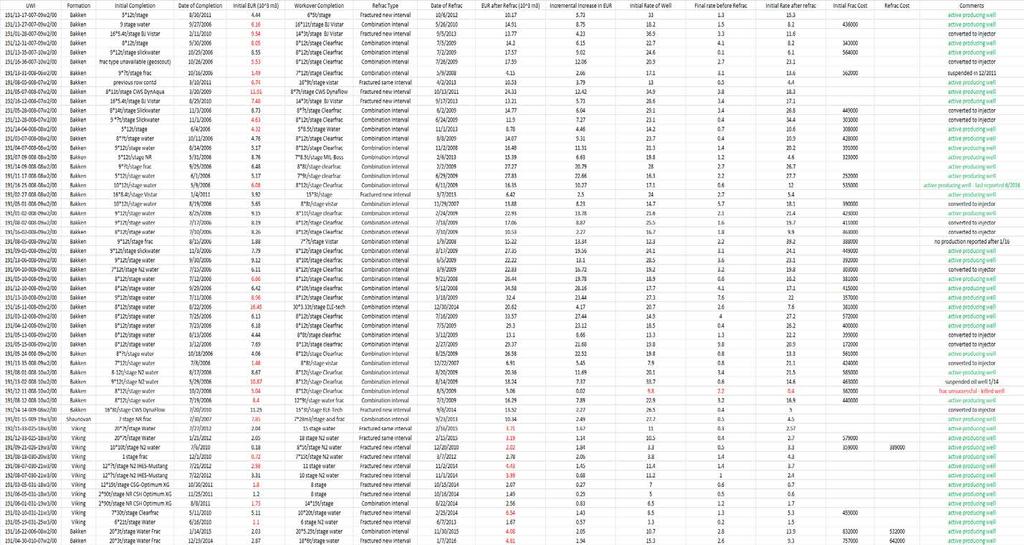
10 Evaluating Performance Options Economic metrics NPV, IRR, PIR ($ or %) EUR values Before and After refrac EUR used to determine incremental EUR (ee 3 mm 3 ) Oil Production Rates compare rate improvement as a result of refrac as well as after refrac rate to initial production rate from initial frac completion (mm 3 /d or % of initial rate)
11 Bakken Refracs by Year

12 Analysis Bakken Wells
13 Analysis W2 1 2 Production as of Feb 2017 was mm 3 Estimated EUR

14 Analysis W2


15 Analysis W2 1 2 Production as of Feb 2017 was mm 3
16 Analysis Bakken Oil Rates
17 Analysis Bakken Oil Rates
18 Bakken Summary Wells: 45 Initial average EUR: 6700 mm 3 After refrac average cum. production: mm 3 Initial average oil rate: 21.4 mm 3 /d (135 bopd) Average rate before refrac: 2.4 mm 3 /d (15.1bopd) Average rate after refrac: 16.8 mm 3 /d (106 bopd) The average refrac restored oil rate to 79% of initial oil rate with a median value at 80% of initial oil rate
19 Viking Refrac Summary

20 Analysis of W3

21 Analysis of W3 1 2
22 Analysis Viking Oil Rates
23 Analysis Viking Oil Rates
24 Viking Summary Wells: 11 Initial average EUR: 2000 mm 3 After refrac average EUR/cum. production: 3100 mm 3 Initial average oil rate: 7.4 mm 3 /d (47 bopd) Average rate before refrac: 0.8 mm 3 /d (5 bopd) Average rate after refrac: 2.6 mm 3 /d (16 bopd) The average refrac restored oil rate to 35% of initial oil rate with a median value at 26% of initial oil rate
25 Additional 2016 Wells 2 Torquay wells in the SE and 7 additional Viking well refracs done in 2016 discovered in frac database in early 2017 All 7 Viking wells had same initial completion design, same recompletion design, were in the same area, and were done by the same company.
26 Additional Viking Wells
27 Additional Viking Wells
28 Additional Viking Wells
29 Additional 2016 Viking Wells Initial frac was a 2*84t/stage frac while the refrac was a 14*12t/stage frac performed over the same interval as the initial completion Average initial well rate was 4.0 mm 3 /d (horizontal offsets in area averaged 8.9 mm 3 /d ) Average after refrac rate was 5.4 mm 3 /d or 135% of initial rate Initial 11 wells had average recompletion cost of $379k on 2 data points, while 2016 wells had average cost of $306k on 7 data points
30 Concluding Remarks Success of refracs formation dependant Requires less capital than a new drill Wells with higher initial rates, or sub optimal initial completion design show potential Some OFS companies offer services to assist in identifying and screening refrac candidate wells Falling completion costs could improve refrac project economics
31 References Trends in U.S. Oil and Natural Gas Upstream Costs, U.S. Energy Information Administration, March 2016 Economic Impacts of CAPP Recommendations, Canadian Association of Petroleum Producers, November 2015, submitted as part of the Alberta Royalty Review Panel Addendum
32 Contact Information